The Trend of This Metal Could Have Immense Consequences if It Breaks Out
Commodity prices are an imperfect but useful forecaster of consumer price inflation. A key secular trend indicator that I use for industrial commodity prices went bullish last year. Since then, prices have corrected. However, it makes sense to take the pulse of the commodity markets from time to time, in order to see whether they, and presumably the CPI, have the potential to perk up. Copper is a commodity that specifically comes to mind, as it is reputed to have a "Ph.D. in economics". Such a reputation is derived from its widespread applications in most sectors of the economy, ranging from homes and factories to electronics and power generation and transmission. As a result, demand for copper is often viewed as a reliable leading indicator of economic health. That demand is reflected in price swings in the copper market.
Chart 1 shows that copper can also be used as a proxy for commodities in general. The CRB Composite is shown in the top window, the lower one being occupied by the long-term KST for the copper price. The green shadings approximate the periods when the KST is above its MA. It's by no means a perfect indicator, since copper has but a small weighting in the Index. However, it does capture most of the bullish moves in the CRB.
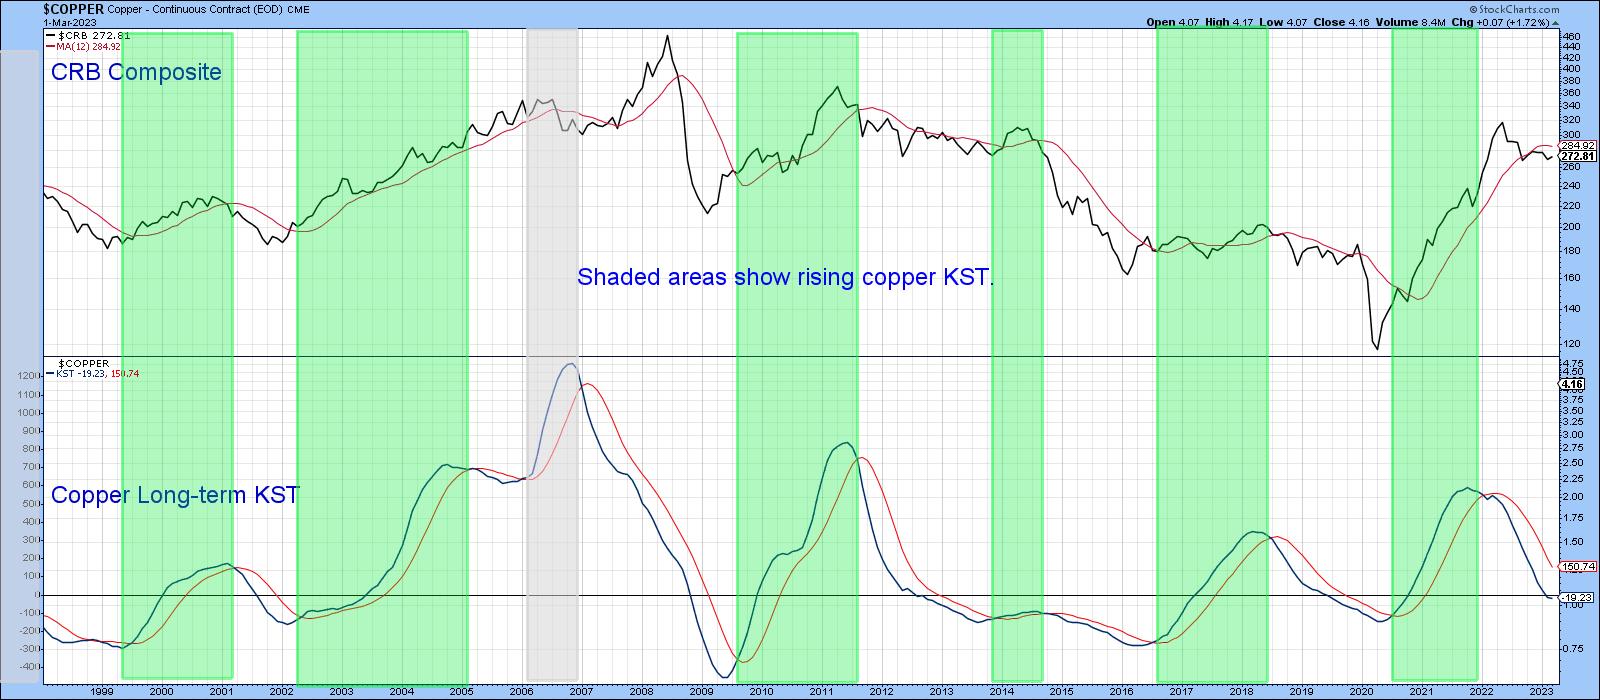
Chart 2 compares long-term momentum between copper and the CRB Composite. The solid arrows indicate that copper turns ahead of or simultaneously with the Index at cyclic lows. Just to keep us guessing, it occasionally lags, as we can see from the dashed arrows.
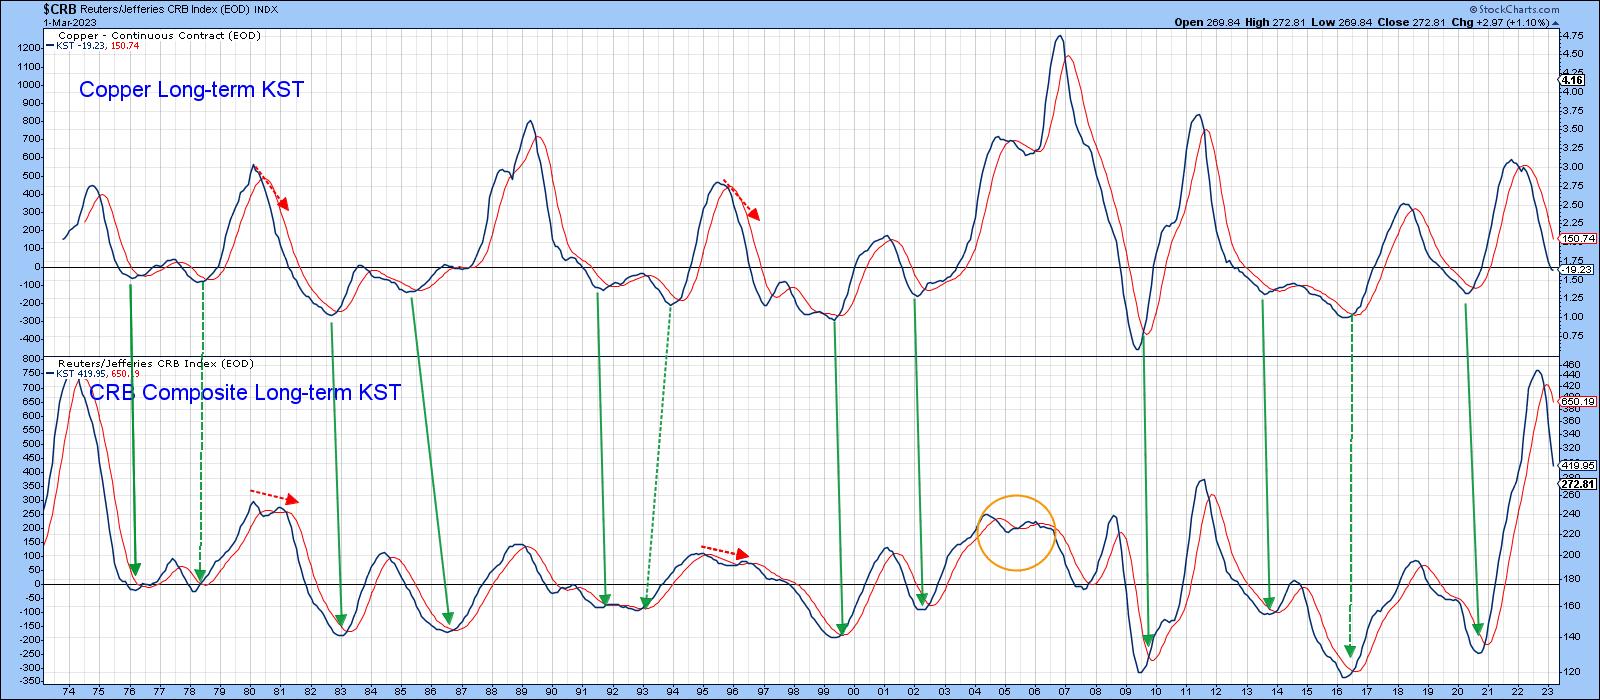
The copper KST is currently close to zero and is therefore in a much better position to experience an upside reversal than the CRB. The implication is that it is once again positioned to turn first, which is one reason why we should watch it carefully.
Another is featured in Chart 3. This arrangement compares the monthly price with a PPO using the 6- and 15-month parameters. The shaded areas tell us when the shorter-term EMA is above its longer-term counterpart; that marks when the oscillator is above zero. You can hardly see it, but February experienced a very marginal buy signal. However, it's really important to see a more decisive crossover this month in order to place it firmly in the bullish camp. In that respect, it is worth noting that this this technique has already experienced two whipsaws since 1998, which have been flagged by the ellipses.
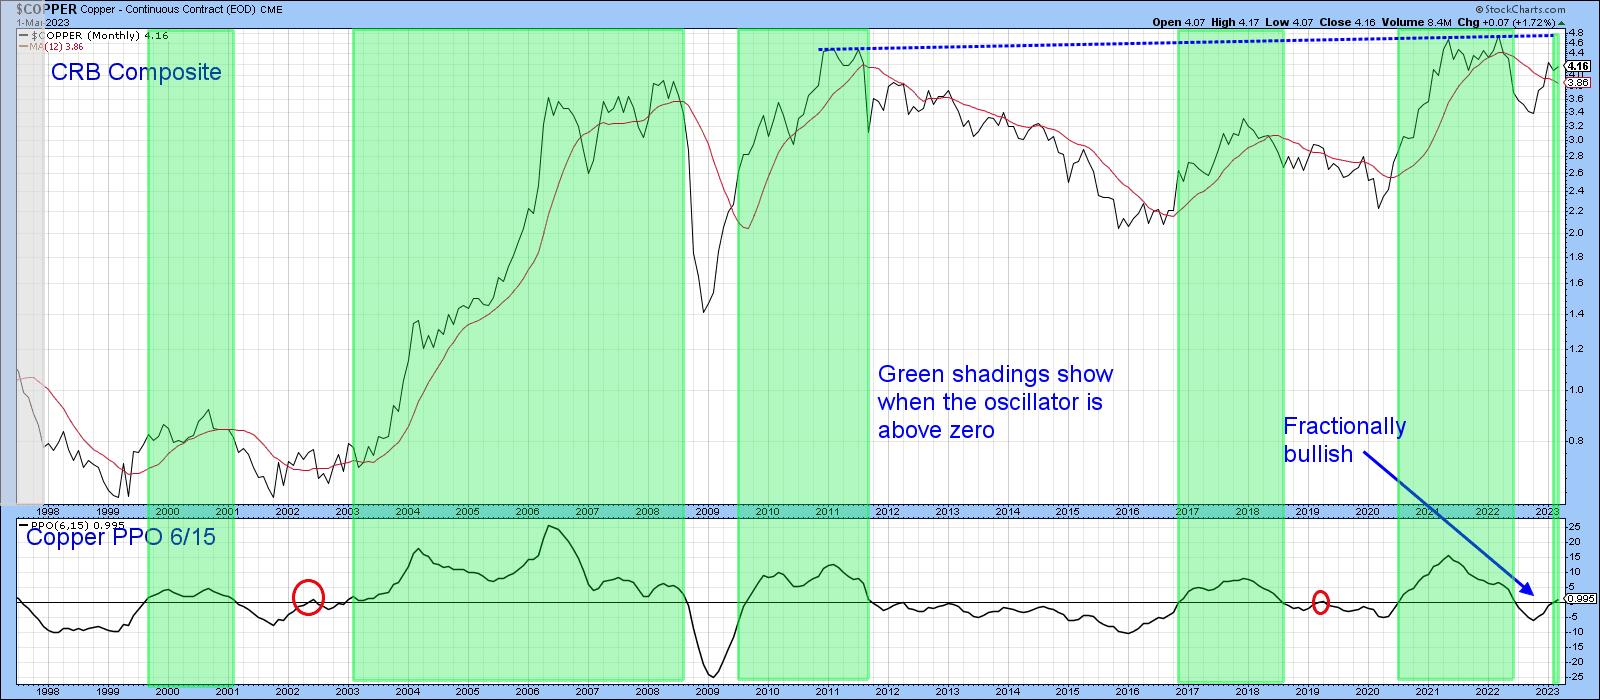
The current signal has the ability to be historic, in the sense that the price is not far from multi-year resistance in the form of the dashed blue trendline joining the 2011, 2021, and 2022 peaks. A move above the line, with a decisive month-end close above the $4.75 level, would be highly significant.
Chart 4 shows how high the stakes are. In this instance, the copper price has been adjusted to take the rising cost of living into consideration. This adjusted price naturally reflects a similar path to the nominal series. However, the overhead resistance, featured in Chart 3, can be shown to extend all the way back to 1974. Note that the Coppock Curve has begun to edge up, and the price itself is well above its 41-month MA. I didn't put in the 12-month MA to avoid complicating the chart, but the price is above that timespan as well.
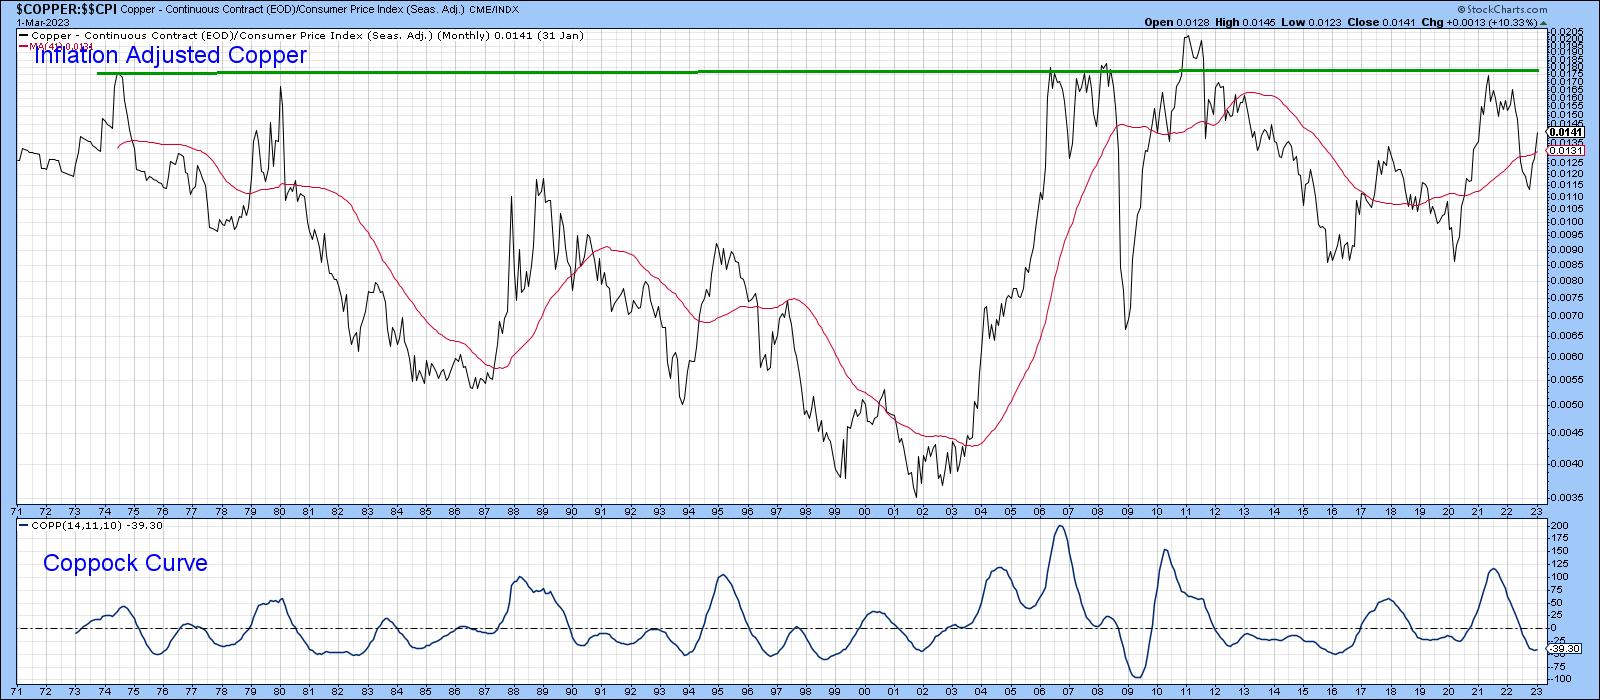
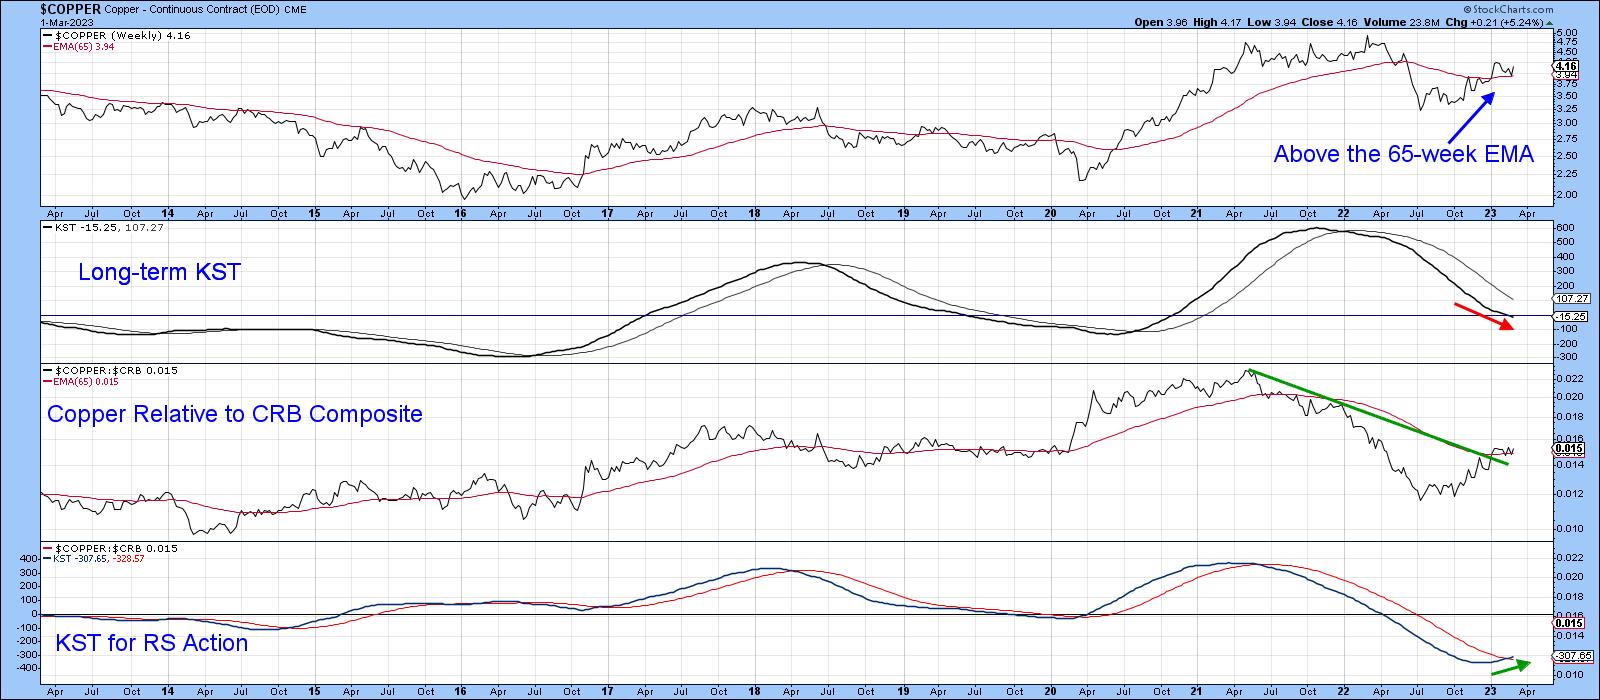
Chart 5 also looks encouraging, since the price is above its 65-week EMA, as is its RS line, as measured against the CRB Composite. The RS has also managed to cross above its 2021-23 down trendline, price action which is also supported by a positive KST.
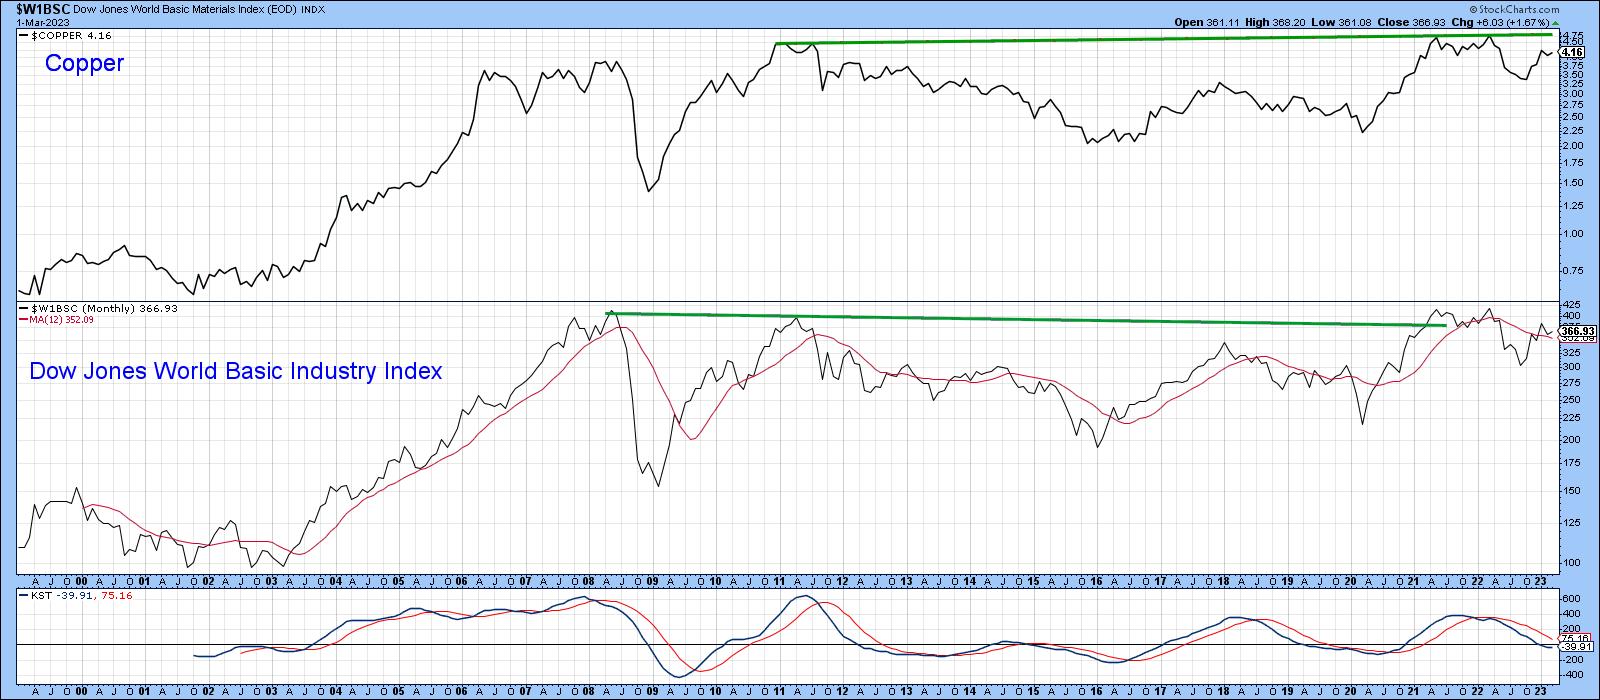
Finally, Chart 6 compares the copper price to the Dow Jones Global Index of basic material stocks. Price action between them is not identical, but close enough to show they are both trading in the upper part of a potentially huge consolidation pattern. Should they manage to break out going forward, it would represent one advanced sign that another round of price inflation is probably in the works.
Good luck and good charting,
Martin J. Pring
The views expressed in this article are those of the author and do not necessarily reflect the position or opinion of Pring Turner Capital Groupof Walnut Creek or its affiliates.


