Three Charts I Am Watching Closely for a Verdict
Charts have always fascinated me, so I plow through a lot of them in the course of a typical week. To me, breakouts hold a similar buzz as a striker scoring a great goal from the edge of the penalty box in soccer. To boot, I do not see any of those types of potential breaks at the moment, except for the possibility of gold, discussed last week. That said, there are a couple of setups that look interesting, so I would like to share them with you.
The Shanghai Composite
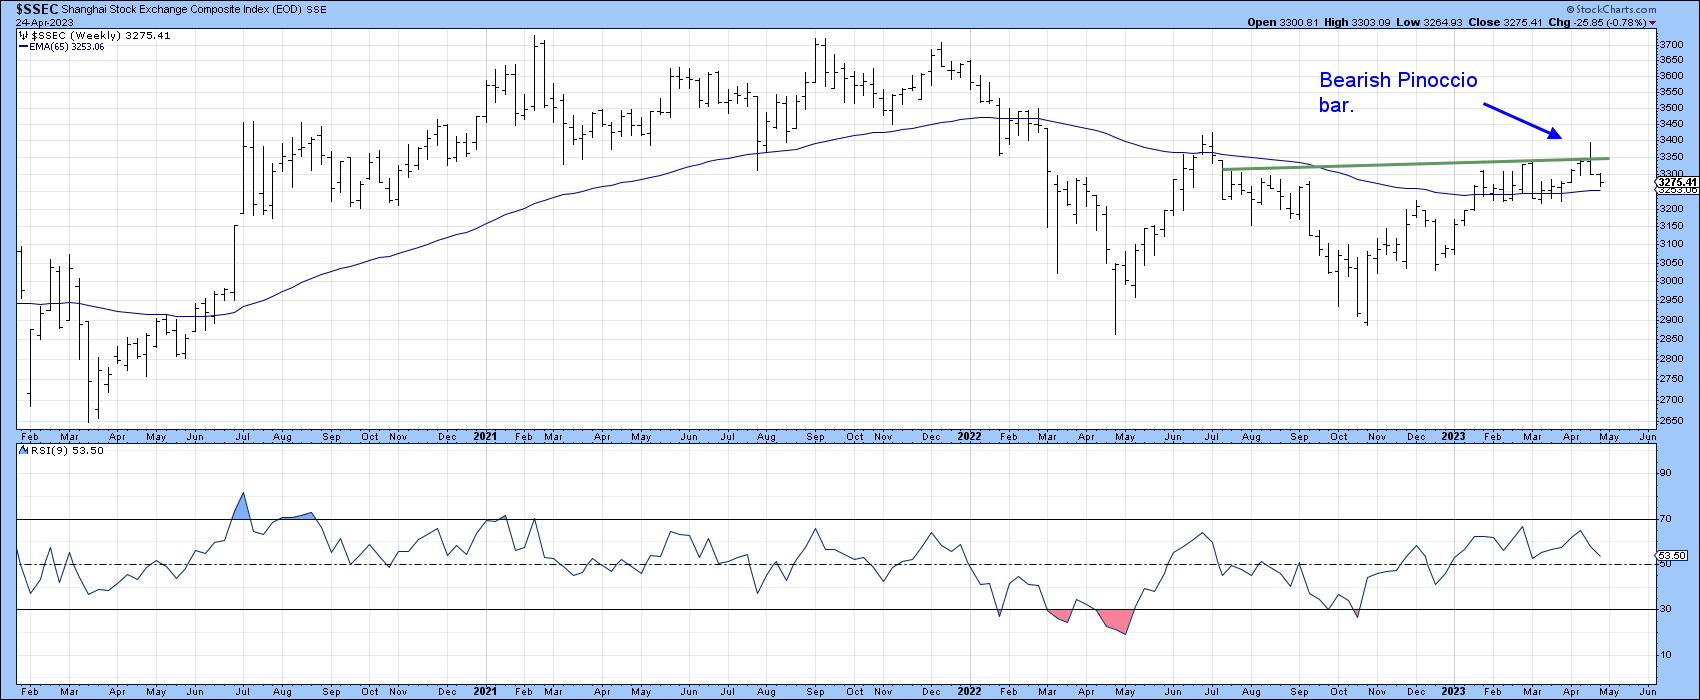
Shanghai caught my attention over the weekend because, prior to last week, it looked as if it was going to break to the upside, thereby resolving the recent consolidation in a positive manner. However, last week's action changed things, because the breakout tuned out to be an exhaustion week. I call this form of exhaustion a "Pinocchio" bar, as it, like the Disney character, has a penchant for telling lies, or in this case triggering false breakouts. Pinocchios are formed when the price breaks through resistance on an intraperiod basis, but neither the open or close are able to hold above it, thereby trapping many bullish intra-week traders in the process. Often, the volatility of the Pinocchio is followed by a short consolidation, following which prices then head lower. Since this is a weekly chart, it has negative implications for between 5-10 weeks. What makes this one particularly critical is the fact that some of the longer-term indicators, like the KST, are very finely balanced and can easily tip in either direction. You can also see in this chart that the 9-week RSI has been unable to generate an overbought reading since July 2020, which is also a sign of weakness. That said, Pinocchio bars, like all one- and two-bar phenomena, need some form of confirmation.
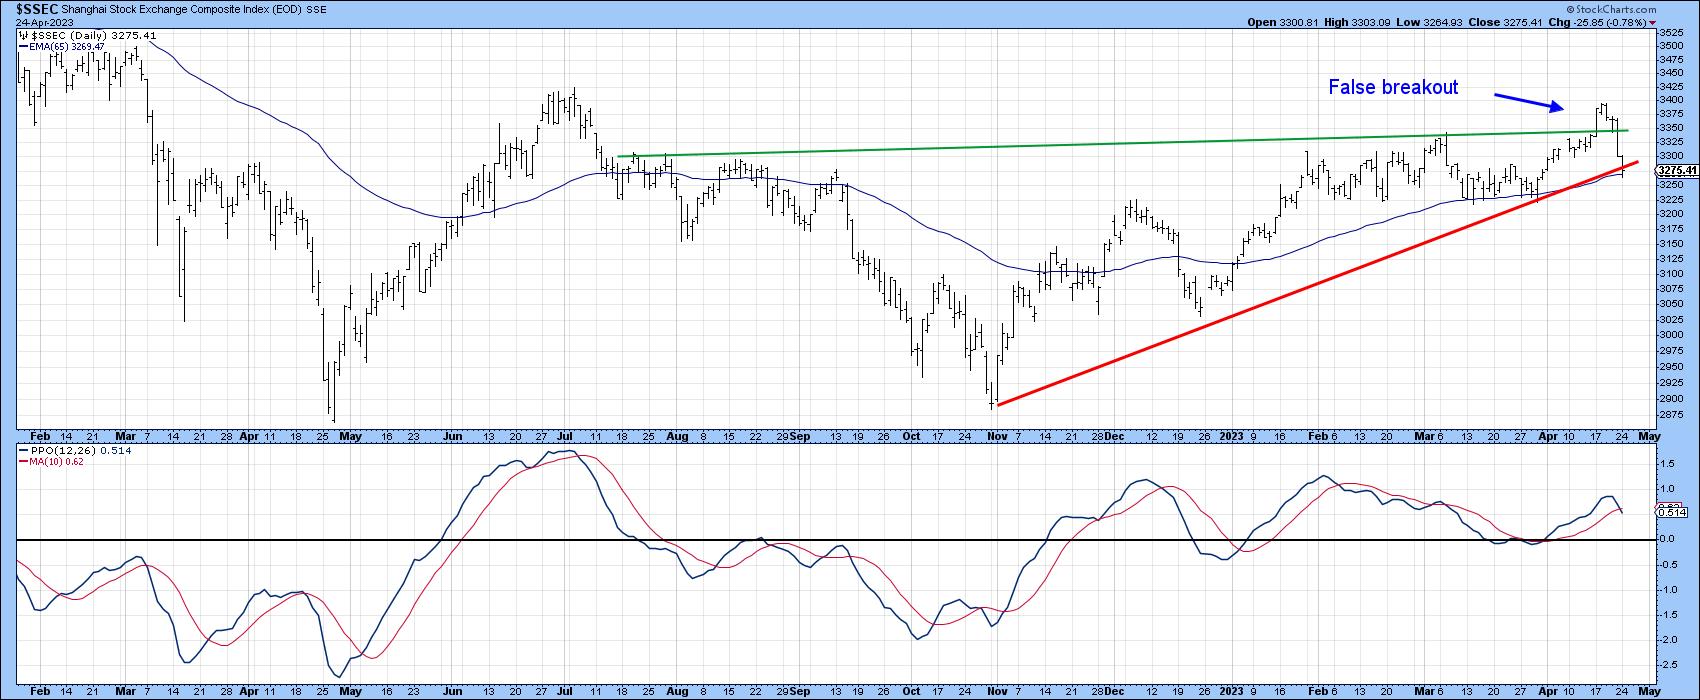
For this we turn to Chart 2, where you can see that daily action has pushed the price slightly below its October 2022-April 2023 up trendline, hence why I am watching it. The other side of the coin is that the bulls win out and the Index manages to regain its composure and rally above the Pinocchio high, which would be very positive. However, this seems unlikely, because the PPO has started to roll over. Since China is the world's number two economy, the outcome has significance. Unfortunately, we cannot say "where China goes, there goes the world," because the Chinese market often moves independently. However, that does mean that the situation should be monitored closely for the sake of its own outcome in the period ahead.
Regional Banks
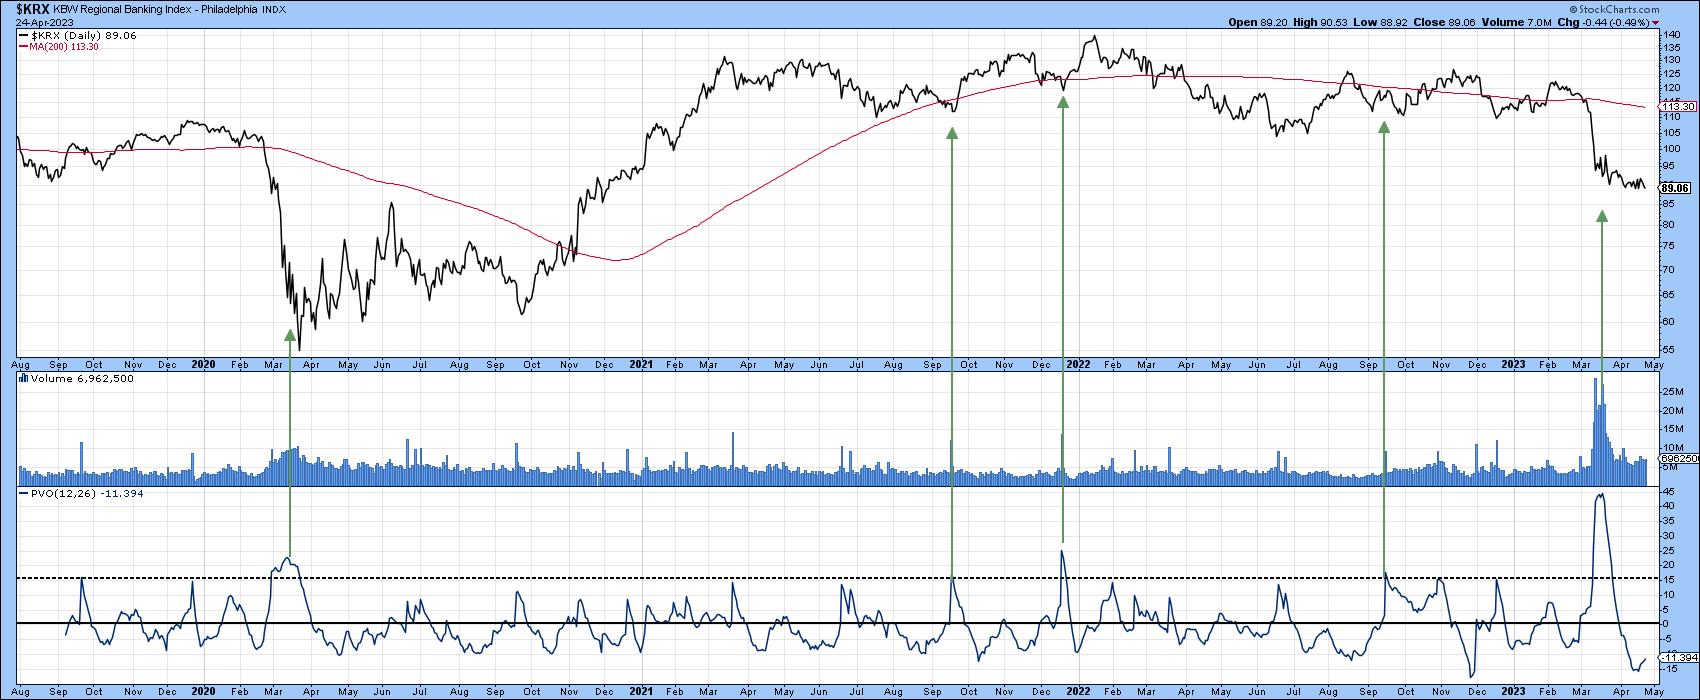
The KBW Regional Banks Index took a real drubbing during the SVP crisis last month and has not done much ever since. It did, however, reflect some of the characteristics of a double bottom formation. In particular, the volume action really got my attention, with that March selling climax. Chart 3 shows that it dwarfs anything seen since the 2020 bear market low.
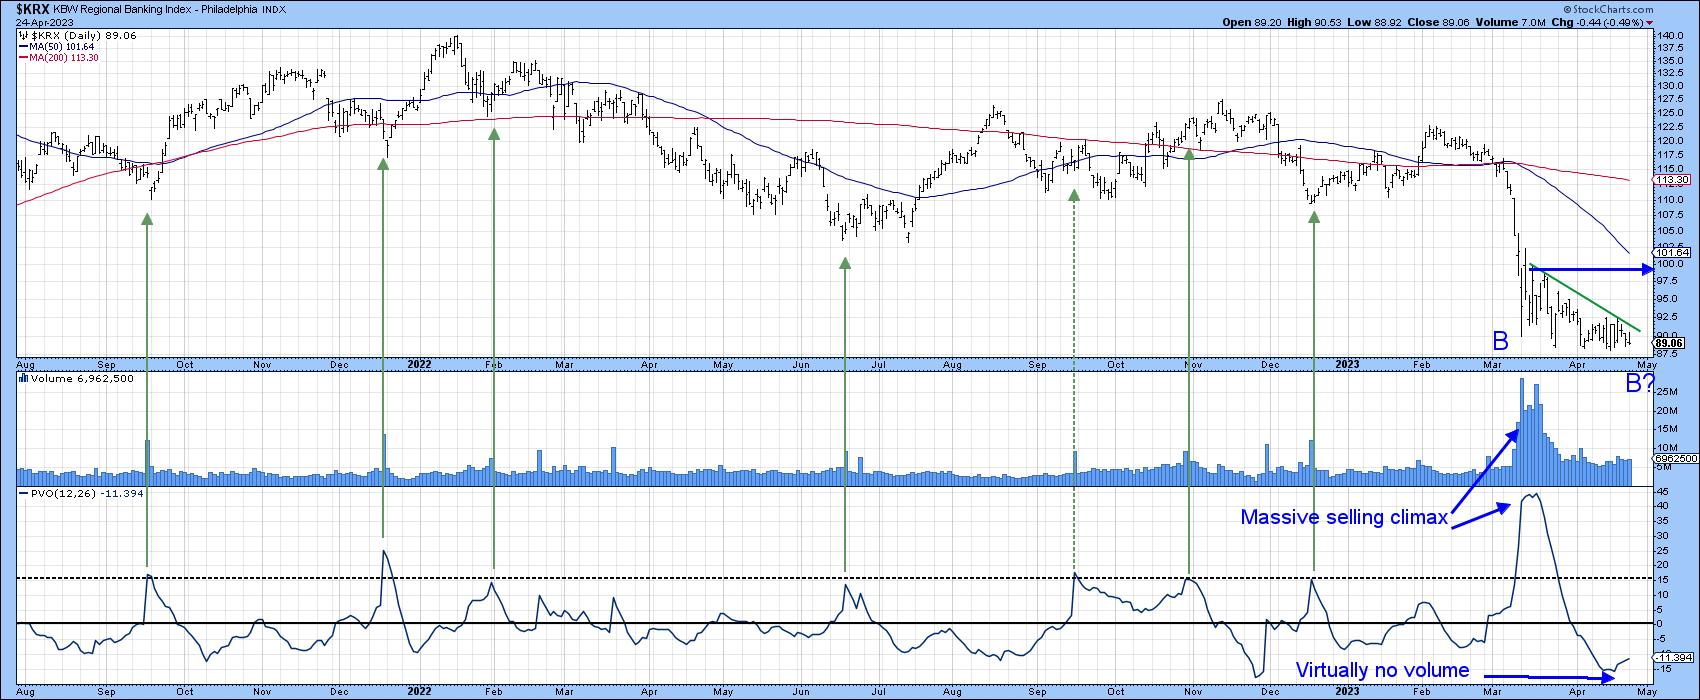
The characteristics of a double bottom involve heavy activity attending the first one and extremely light volume associated with the second. You can see that from the low readings in the histogram, of course. What is most striking, though, is the really low reading in the Price Volume Oscillator in the bottom window, which represents a complete lack of interest. As with all things technical, however, this is merely a suspicion until confirmed by some kind of trend confirmation. Ideally, that would be a break above the horizontal blue line, but an upside penetration of that smaller green down trendline would certainly help to stem any fears on my part of serious new lows being registered, and more likely lead to a spirited rally.
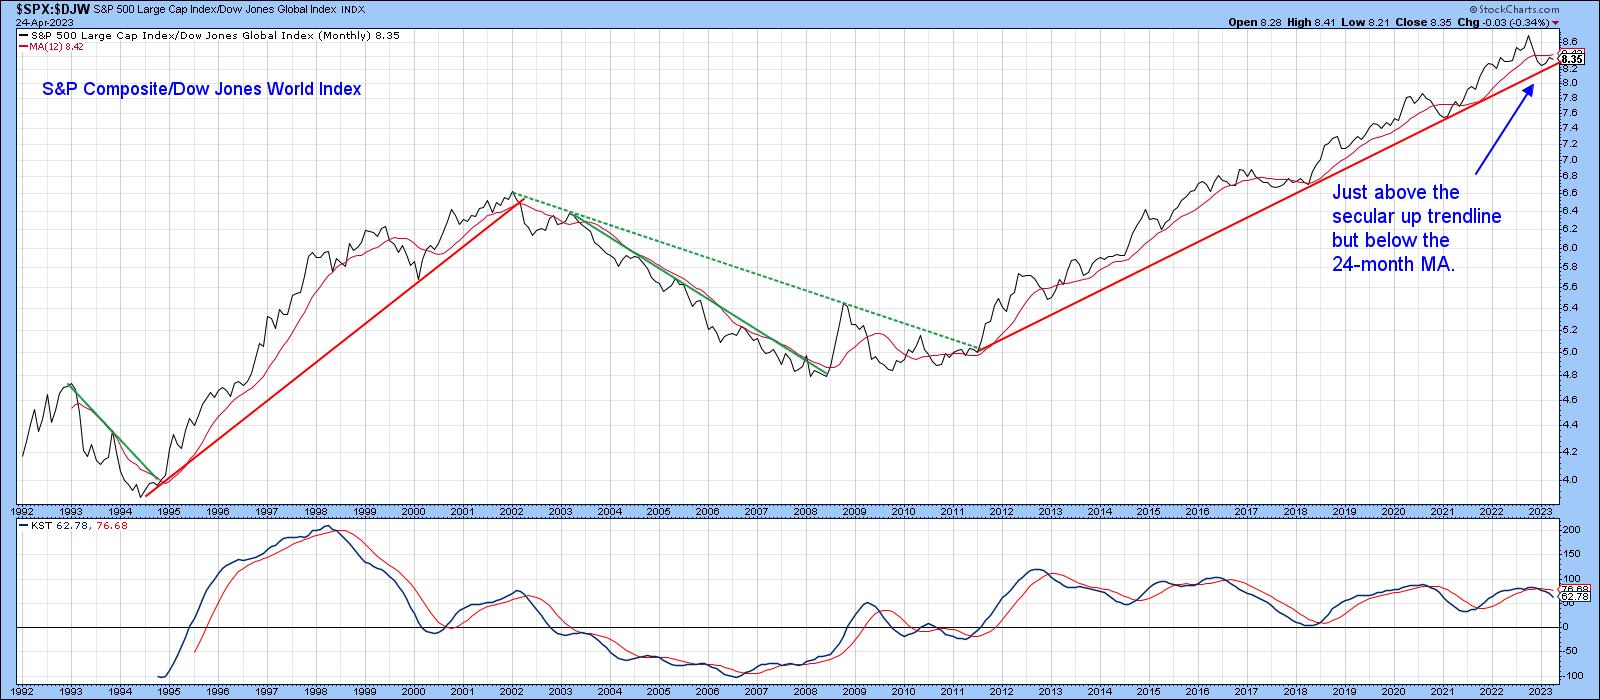
America vs. the World
Another situation that could be on the verge of an important reversal is the relationship between the S&P Composite and the Dow Jones World Index. That's because it is currently resting just above a 12-year up trendline. It is also a tad below the 24-month MA, and the long-term KST has gone decisively bearish. Now it's true that some of the previous KST sell signals did not have much of a negative effect on the ratio, but, then again, none of them experienced a break of the up trendline, which is why it's important to monitor it.
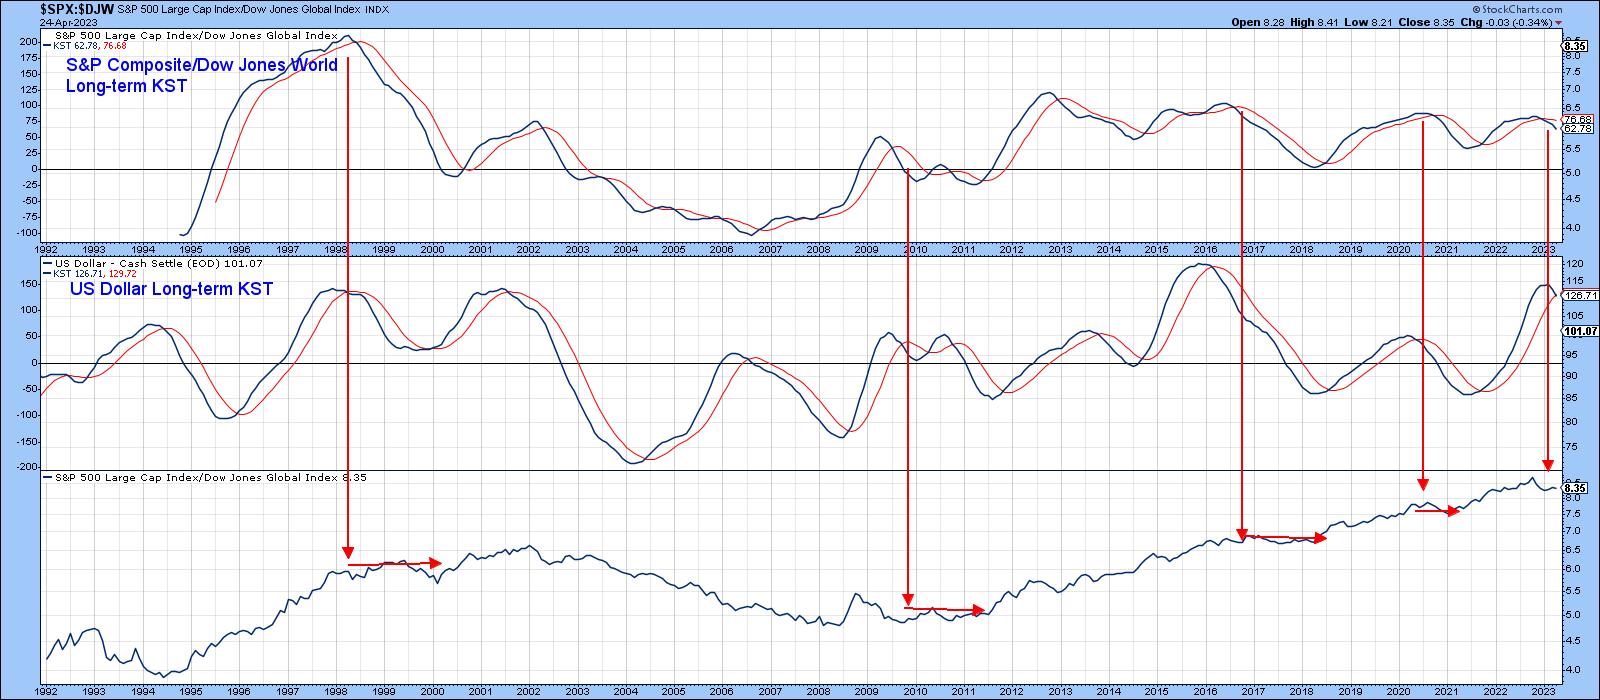
This time there is a good chance of a breakdown materializing because the KST signal is being supported by a sell signal for the US Dollar, as shown in Chart 6. These momentum indicators do not move in sync all of the time, but the red arrows show there is enough evidence to suggest that, when they are both negative, the ratio is more likely to be under pressure than when not.
Good luck and good charting,
Martin J. Pring
The views expressed in this article are those of the author and do not necessarily reflect the position or opinion of Pring Turner Capital Groupof Walnut Creek or its affiliates.


