What Are the Implications of Last Month's Gold Breakout for Commodities?
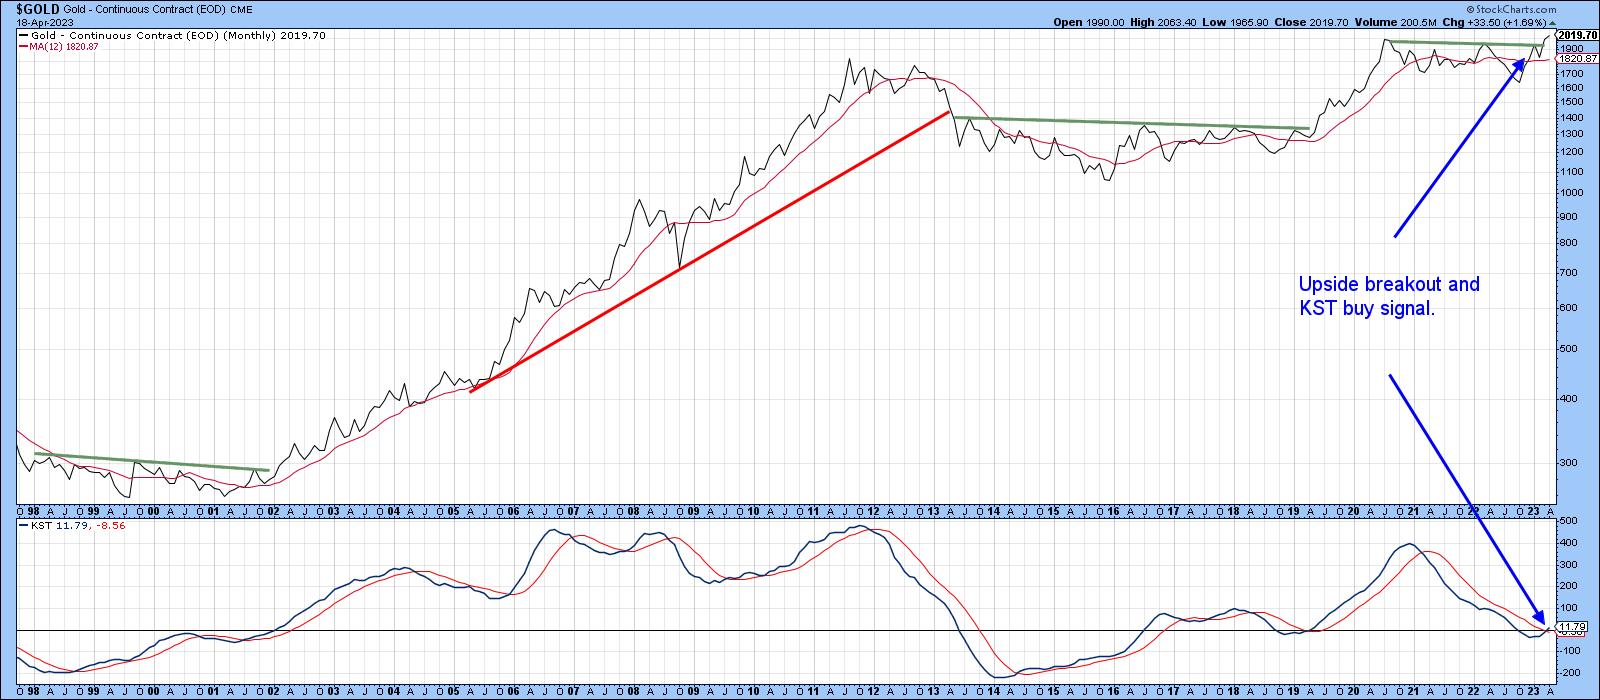
Chart 1 below shows that, on a monthly close basis, gold broke out from a large consolidation formation in March. It has built on that move in the first part of April by moving slightly higher. The implication is obviously for higher gold prices, once the overbought condition laid out in Chart 5 has had a chance to correct. That said, higher gold prices also affect other markets and the economy.
Gold is in a Primary Bull Market
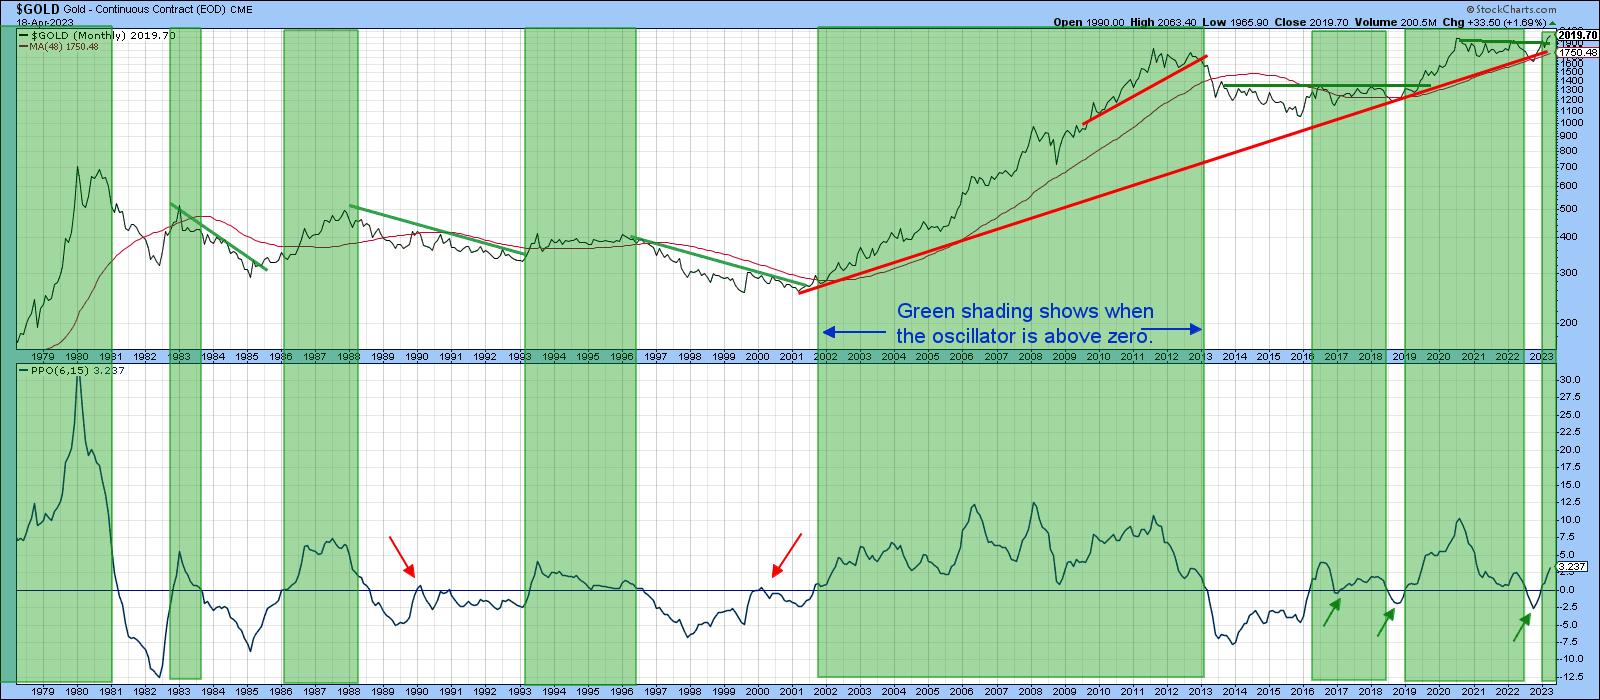
Charts 1 and 2 offer evidence that gold is in a primary bull market. First, both monthly-based charts indicate a breakout from the 2020–23 trading range. Chart 1 also shows that the long-term Know Sure Thing (KST) is in a bullish mode. Another positive omen—the latest buy signal has been triggered from a relatively neutral position. Consequently, the indicator is not overextended in any way and, therefore, has substantial upside potential before becoming overextended.
Second, the 6-15-EMA model for gold has gone positive. This may sound complicated, but the "model" is simply a percentage price oscillator (PPO) using the six and 15-month parameters, as plotted in Chart 2. Zero crossovers in both directions are used as buy and sell signals. Positive environments using this approach, have been shaded in green. Like all techniques, this one has its share of false or misleading signals; however, in 45 or so years of data, there have only been five whipsaws. That's about one every eight years, which makes me pretty comfortable accepting the validity of the latest buy signal. So, if gold is likely to rally, what are the implications for commodities?
The Relationship Between Commodities and Gold
Historically, gold has discounted both inflation and deflation by turning ahead of commodities on both the upside and downside. However, there is a catch, for when gold is outperforming commodities on the upside, they are usually declining in an absolute sense. It's only when commodities begin to outperform the price of the yellow metal that they rise in their own right.
This relationship is demonstrated in Chart 3. The upper window features the CRB Composite; the middle one the ratio between gold and commodities. When the ratio rises, it indicates gold is outperforming the CRB. The KST offers an objective indication as to the direction of the ratio's trend. In that respect, the red arrows tell us when the KST crosses above its moving average from a position close to or below the equilibrium point.
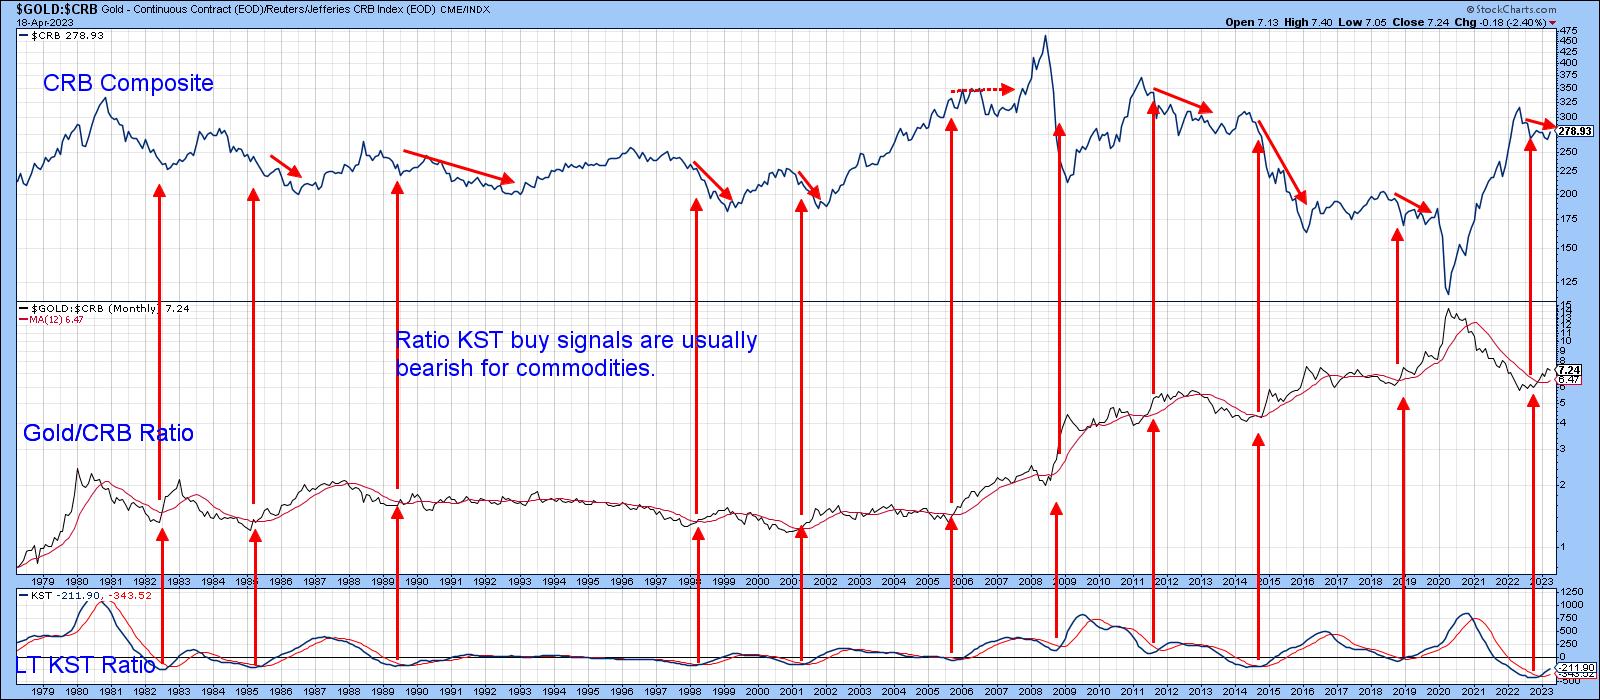
Now, look to the right of the arrow tips. In most instances, it's a bearish omen for prices. The recent buy signal for the gold price itself, therefore, suggests that the gold/commodity ratio will strengthen, and commodities will stabilize or weaken.
Chart 4 shows that this same relationship exists in reverse, as peaks in the gold/commodity KST are typically followed by rising commodities. If commodities are to turn bullish based on this approach, one thing to observe would be a reversal in the KST to the downside.
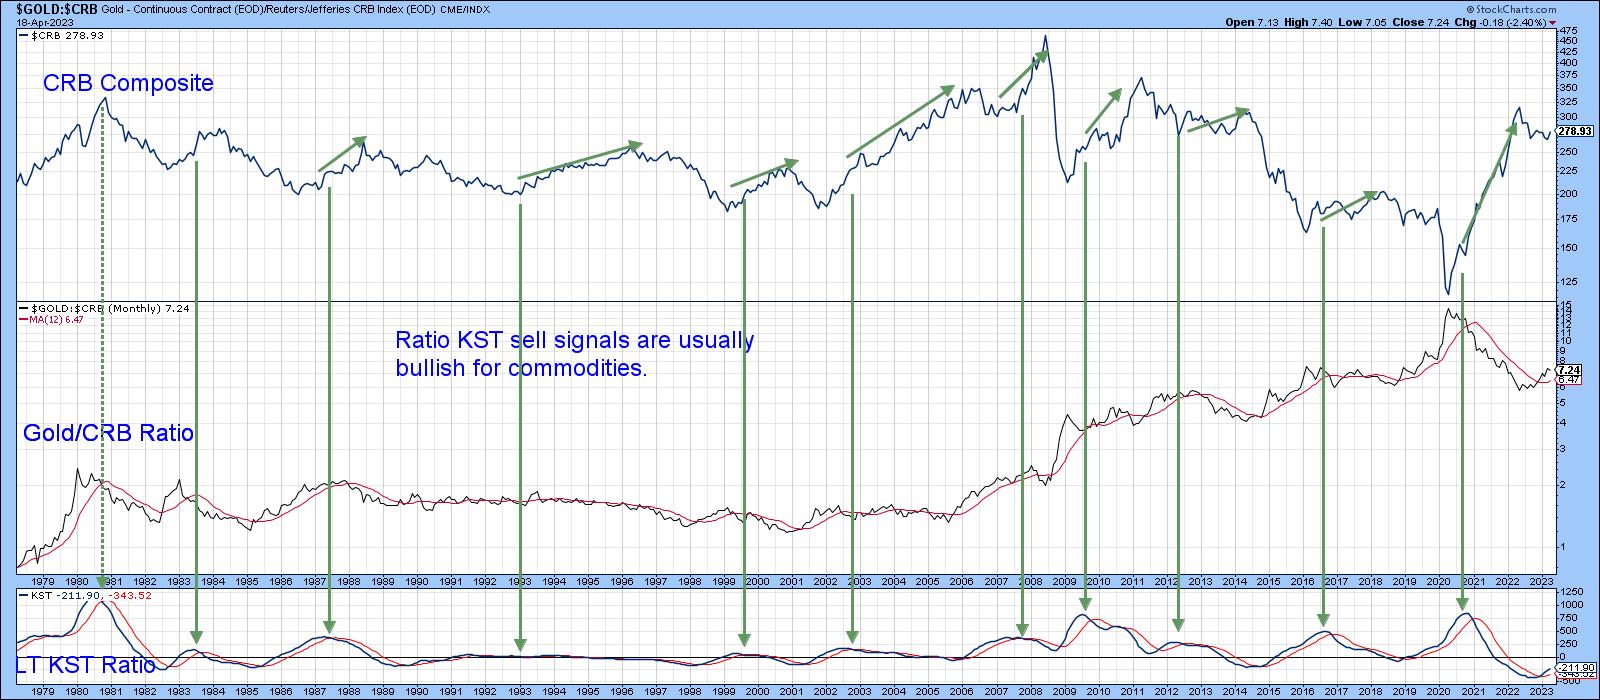
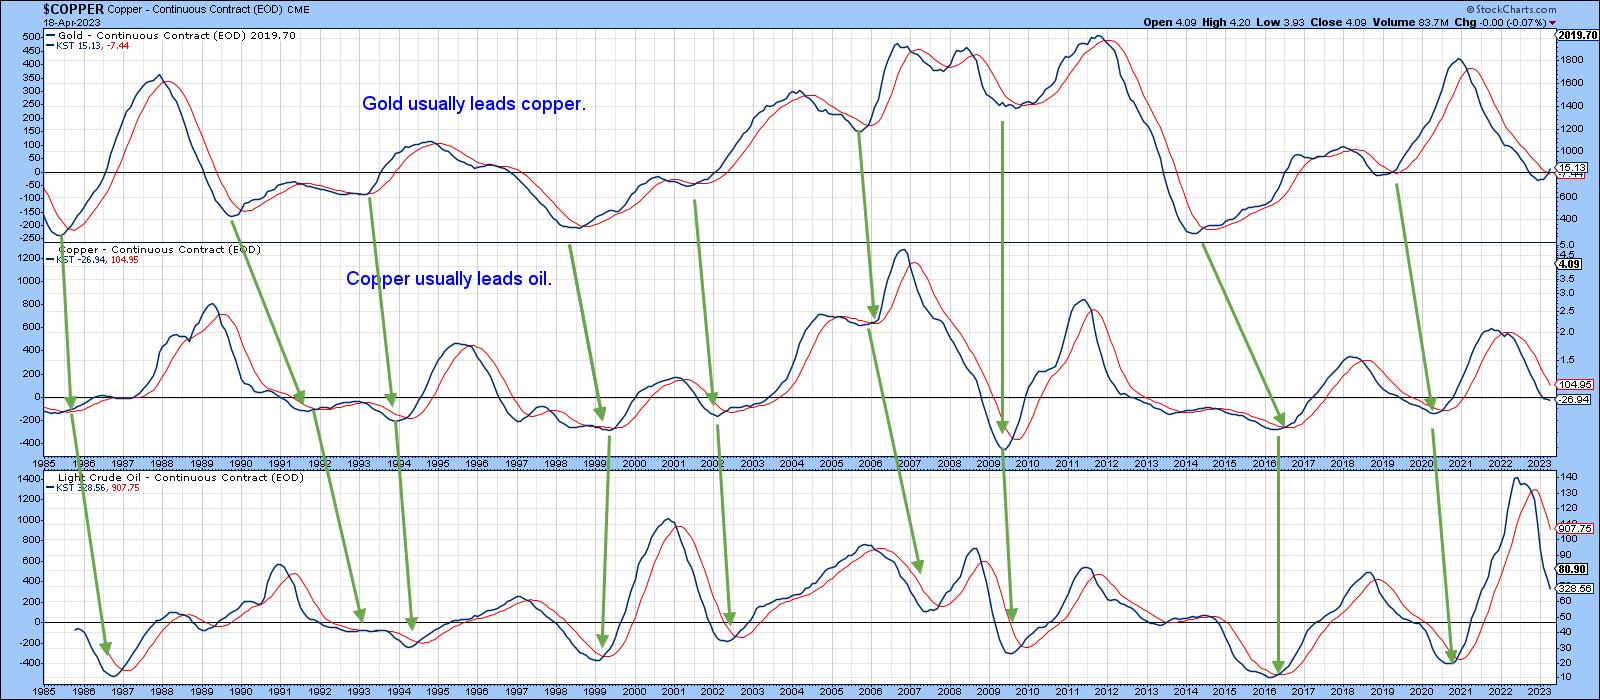
Chart 5 looks at the relationship between gold and commodities differently, as it compares gold's long-term KST with that for two important commodities, copper and West Texas Oil. Gold's momentum typically bottoms ahead of that of copper, which, in turn, leads crude oil. The latest signal in this chronological sequence is a bottoming in gold, so the next expected event is a low in copper. Its KST has stabilized but is, nevertheless, still declining. The position of this relationship remains consistent with that of the gold/CRB ratio in that the rising price of gold is not yet ready to signal a commodity bull market.
Gold's Short-Term Technical Position
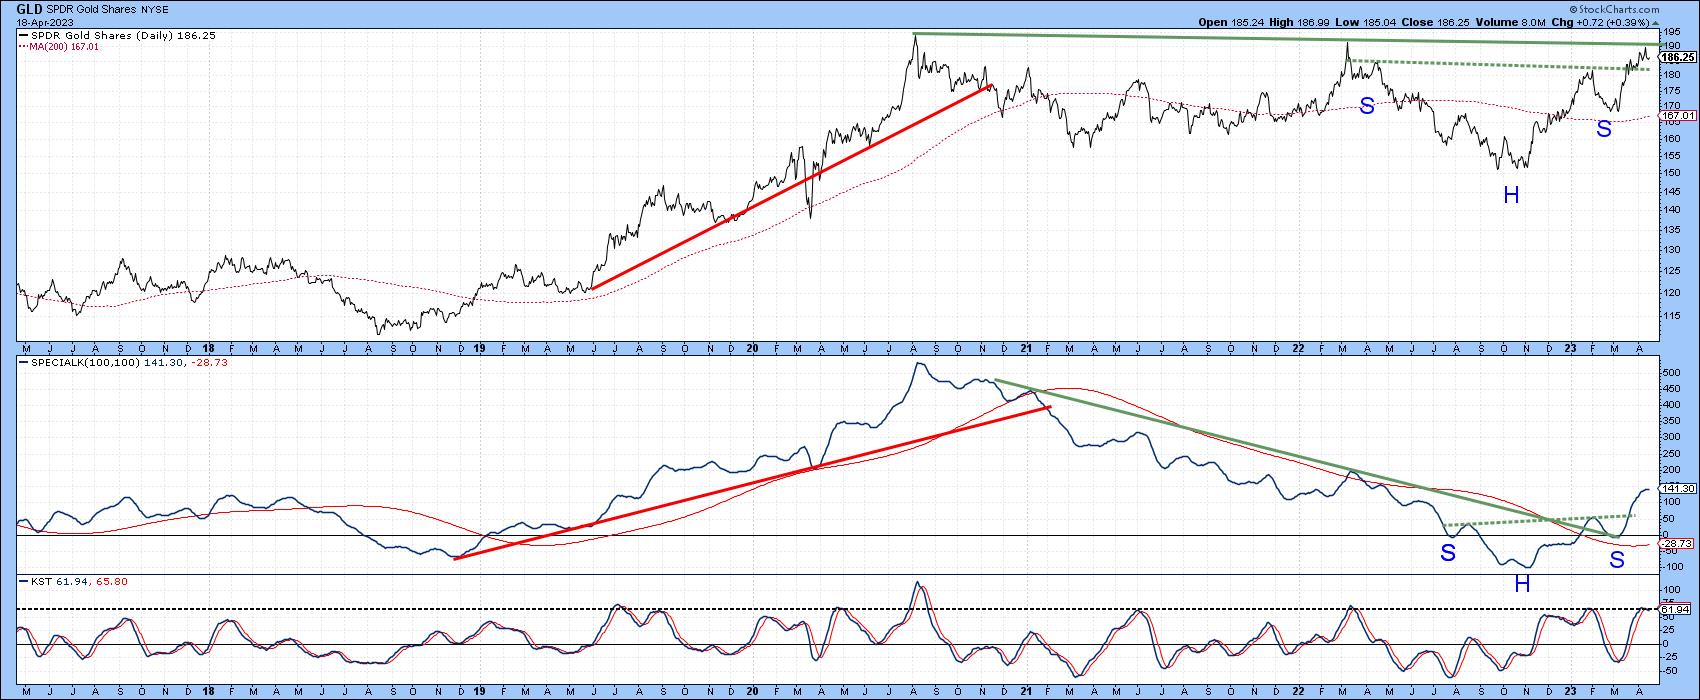
Chart 6 compares the price of the SPDR Gold Trust (GLD) to that of its Special K. The price itself has run into massive resistance in the form of the solid green trendline connecting the 2020, 2022, and 2023 daily closes. The breakout on the monthly charts discussed earlier and the completion of theinverse head-and-shouldersfor both the price and Special K on this chart argue for higher ultimate prices. However, an overbought daily KST in the bottom window tells us we should not be surprised if a near-term correction occurs first. If so, the sharper it is, the greater the odds that it will be taking place under the context of a primary bull market.
Good luck and good charting,
Martin J. Pring
The views expressed in this article are those of the author and do not necessarily reflect the position or opinion of Pring Turner Capital Groupof Walnut Creek or its affiliates.


