Europe and Japan to the Rescue?
Most of the time, when looking at equity markets outside of the US, I focus on the various country ETFs, which are denominated in dollars rather than local currencies. In some ways, this limits my perspective, since currency fluctuations can change some of the outcomes--especially in countries experiencing a high rate of inflation and, therefore, really weak currencies. (Turkey and Argentina come to mind.) Also, the history of many ETFs is limited to the post-financial crisis period, whereas local currency-based indexes often have much larger historical perspective. In that spirit, I would like to feature some international charts that look interesting from a long-term perspective.
Chart 1, for instance, shows that the Dow Jones Europe Index ($E1DOW) has essentially been rangebound since 2007. That said, the Index recently broke out from the range. That breakout is likely to be valid. First, the Index is above its rising 12-month MA. Second, the long-term KST has gone bullish for European stocks. The next challenge would be at the 2007 and 2022 highs.
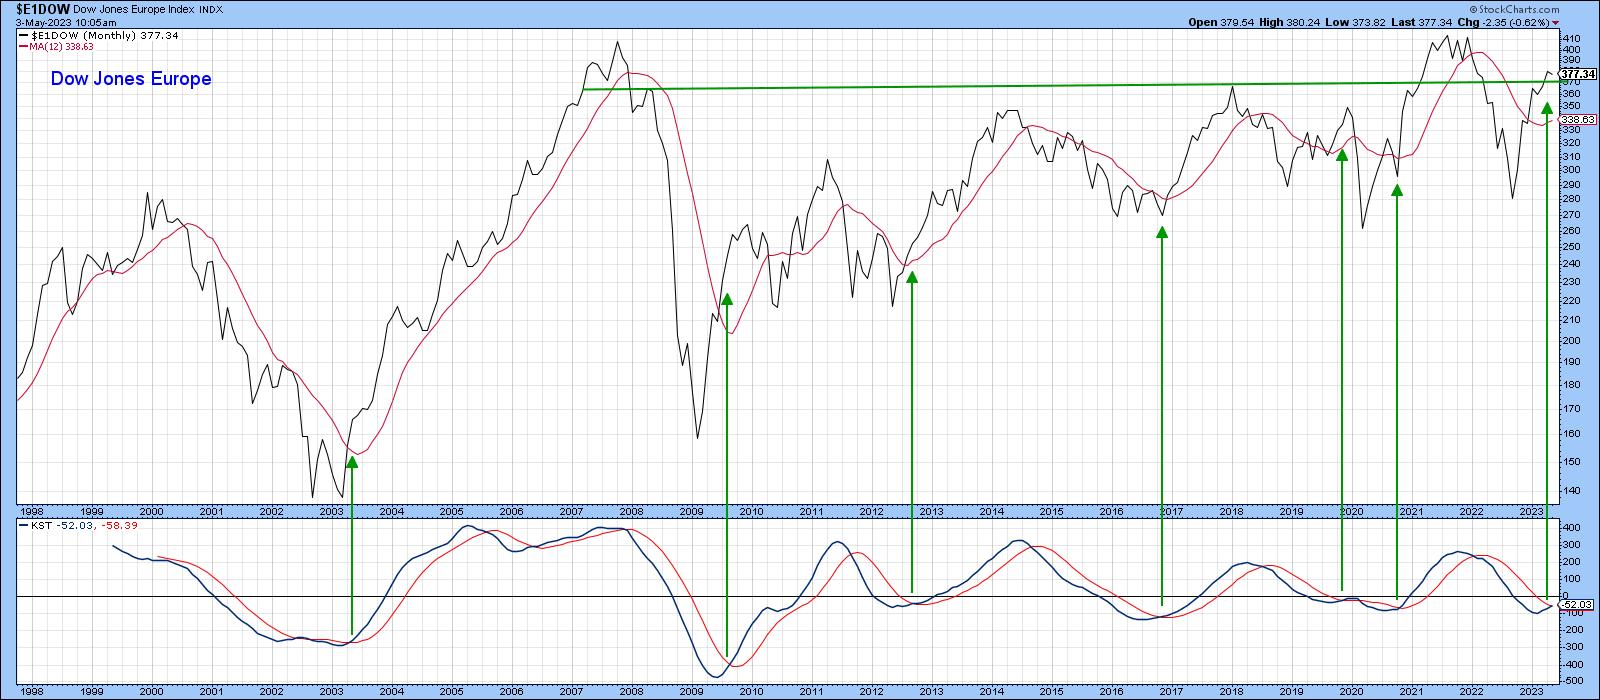
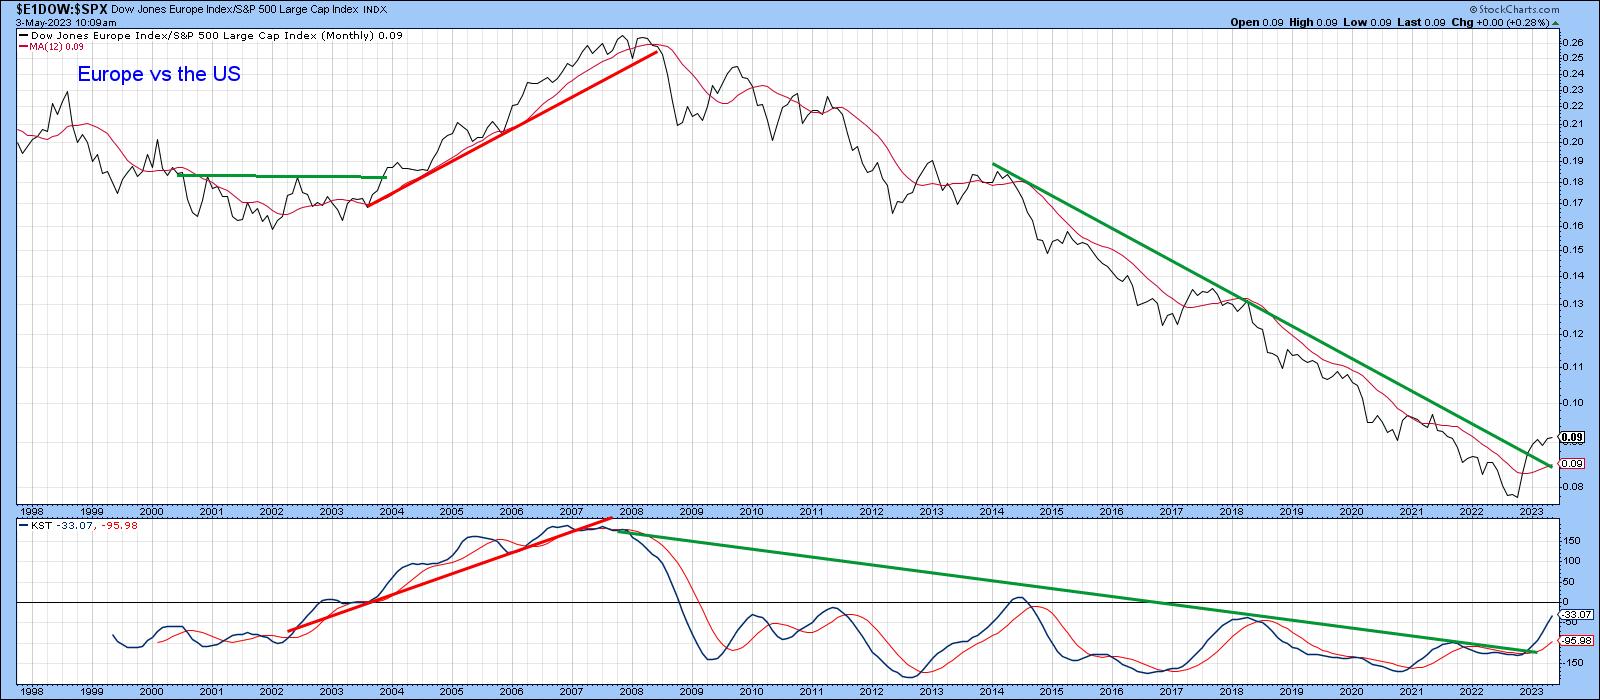
Chart 2 offers further encouraging signs from a relative European aspect. That's because the trendline marking the post-2014 part of the 2007-2022 secular decline in relative action against the US has been violated. Further adding to the bullish case is a KST buy signal and a breakout above the momentum down trendline. Unlike previous KST buy signals, this one has been confirmed by the ratio surpassing its down trendline.
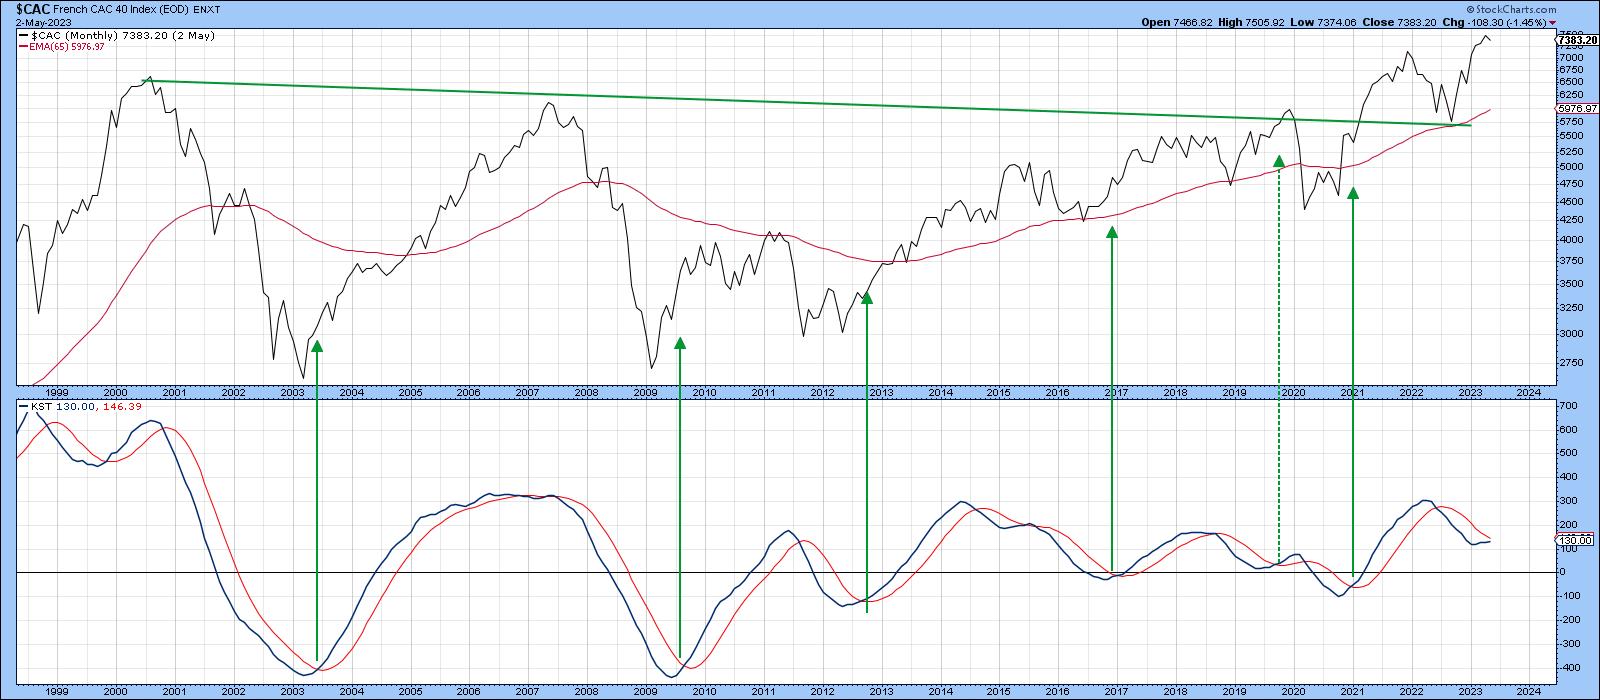
If Europe itself is starting to move higher, then it should follow that some individual country indexes ought to be more established in their uptrends. Chart 3, for instance, shows that France, in the form of the CAC 40 ($CAC), is one market currently trading at a new all-time high. The Index looks to be resting on a very solid foundation. That's because it broke out from a 20-year base in 2021, corrected back to the top of that accumulation pattern and has now moved to new highs.
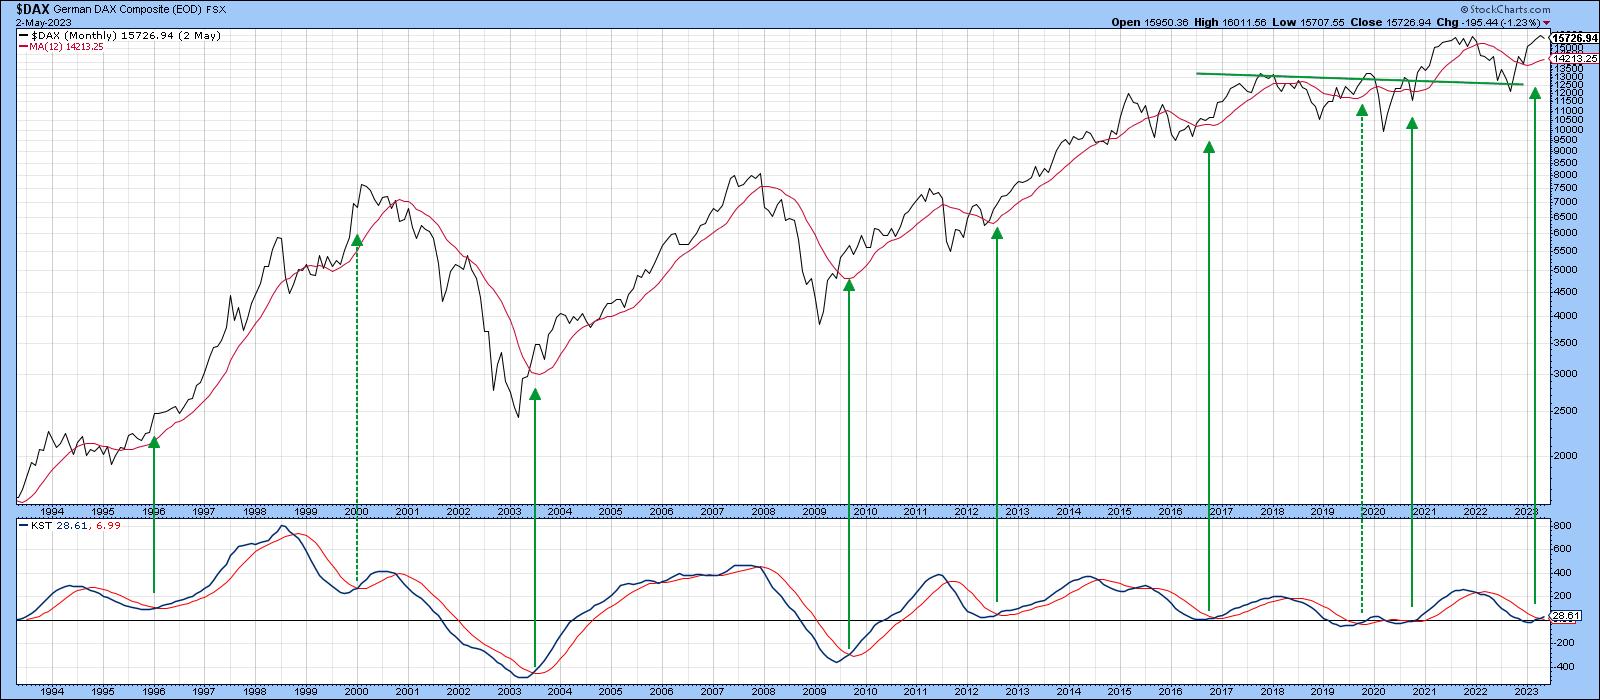
The German DAX ($DAX), which is featured in Chart 4, has been gradually zig-zagging its way higher since 1994, and is now moving away from testing its 2021 breakout. The newly minted KST buy signal also helps.
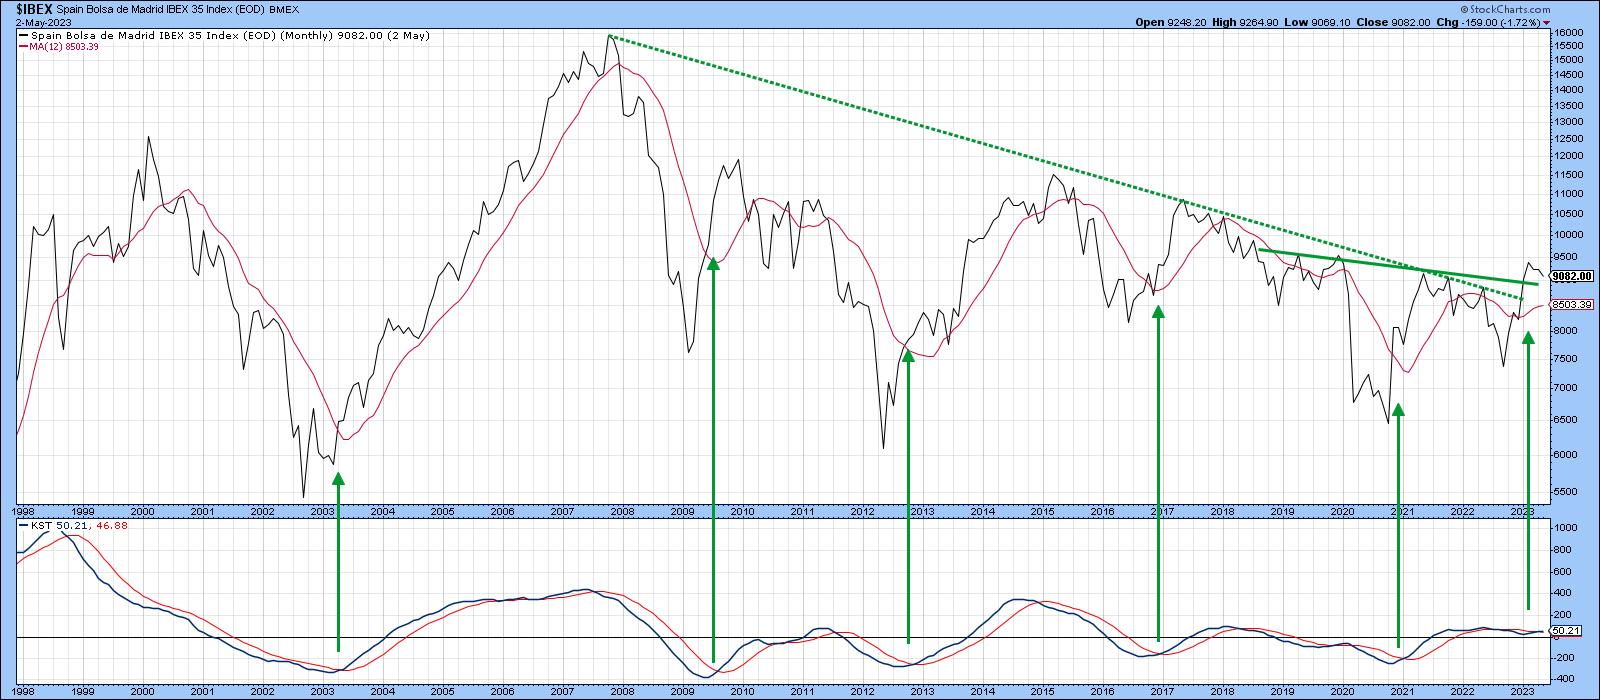
Some other Other European markets that are looking constructive are not at new highs, but have broken above multi-year resistance. The Spanish market, as represented by the Spain Bolsa de Madrid Ibex 35 Index ($IBEX), has managed to surpass two technical hurdles. The first is a break above the 2007-2023 secular down trendline. This is significant not only because the line is lengthy, but because it has been touched or approached on numerous occasions. It therefore represents a very important dynamic level of resistance. Further encouragement comes from the fact that this Index has completed the 2019-2023 base with a decisive upside breakout. Finally, the KST has just crossed above its MA, thereby triggering its sixth buy signal since the turn of the century.
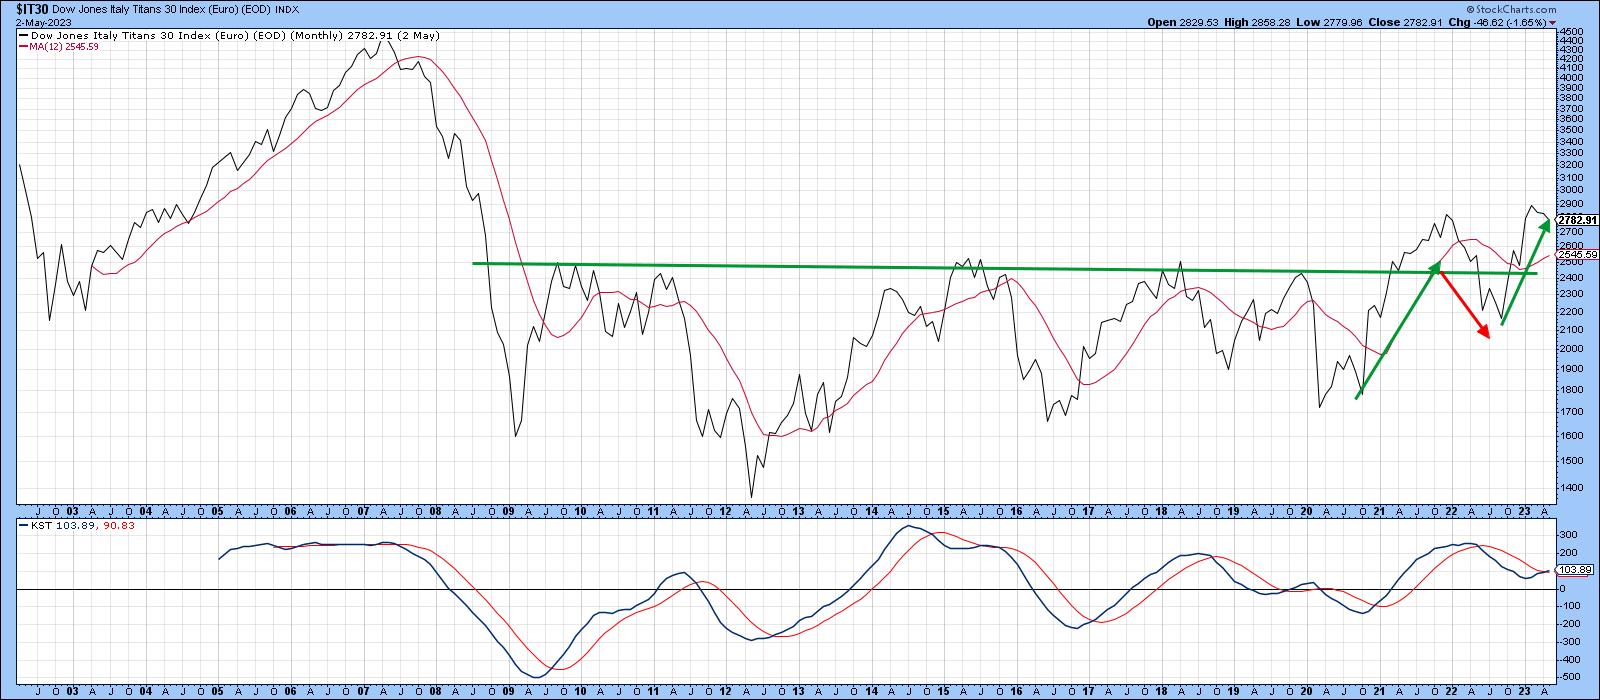
The Italian market, in the form of the Dow Jones Italy Titans ($IT30), is a another European market that has recently broken out from a base. There was a problem in 2021, when the breakout morphed into a whipsaw, but instead of following through on the downside, the Index managed to re-group and has now been able to experience a series of rising peaks and troughs, as flagged by the arrows. The positive action by the long-term KST is also encouraging.
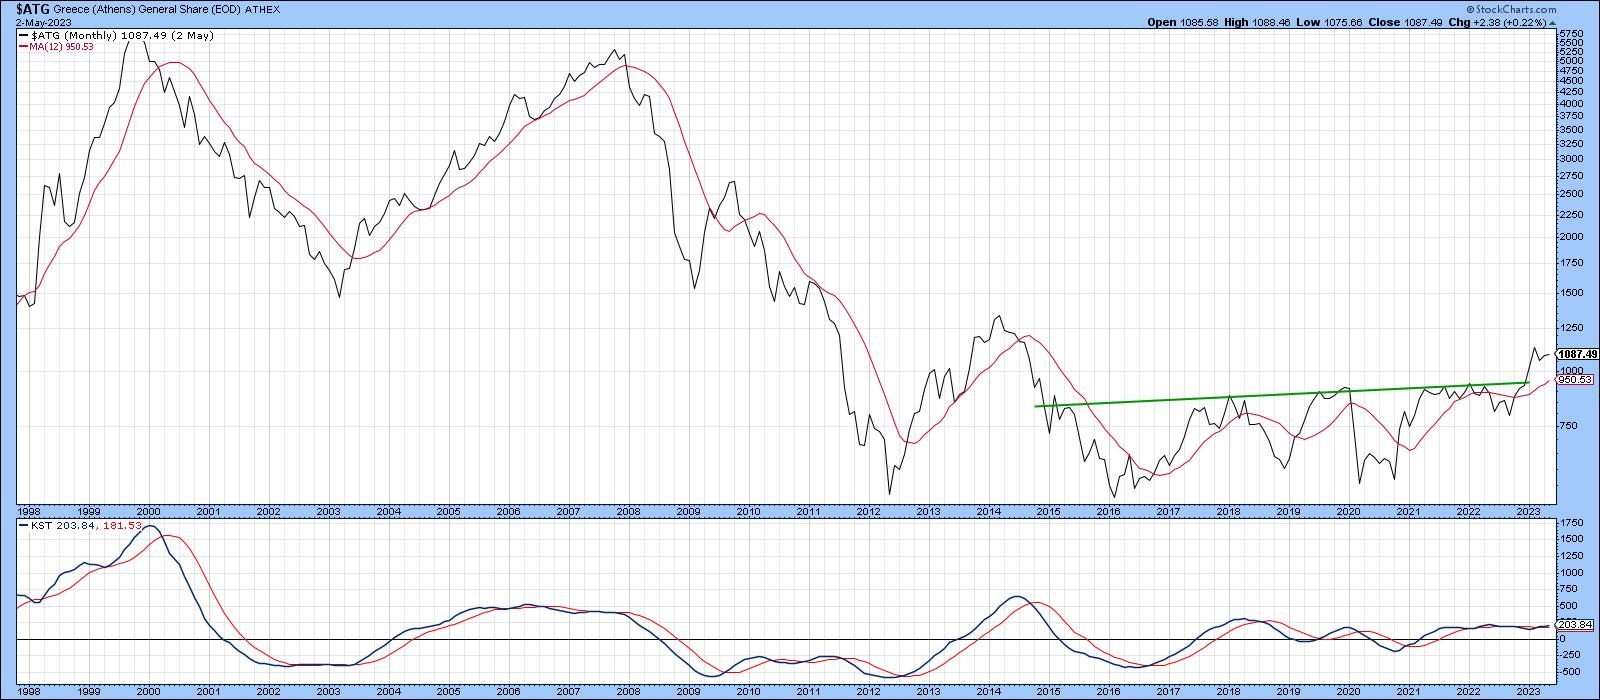
Finally, remember Greece? The Greece (Athens) General Share Index ($ATG) has been in a downtrend since 1999. Chart 7 indicates that this mega-bear has run its course, as the Index has just broken out from its 2015-2023 base in a convincing manner. The positive looking long-term KST is also encouraging.
Japan
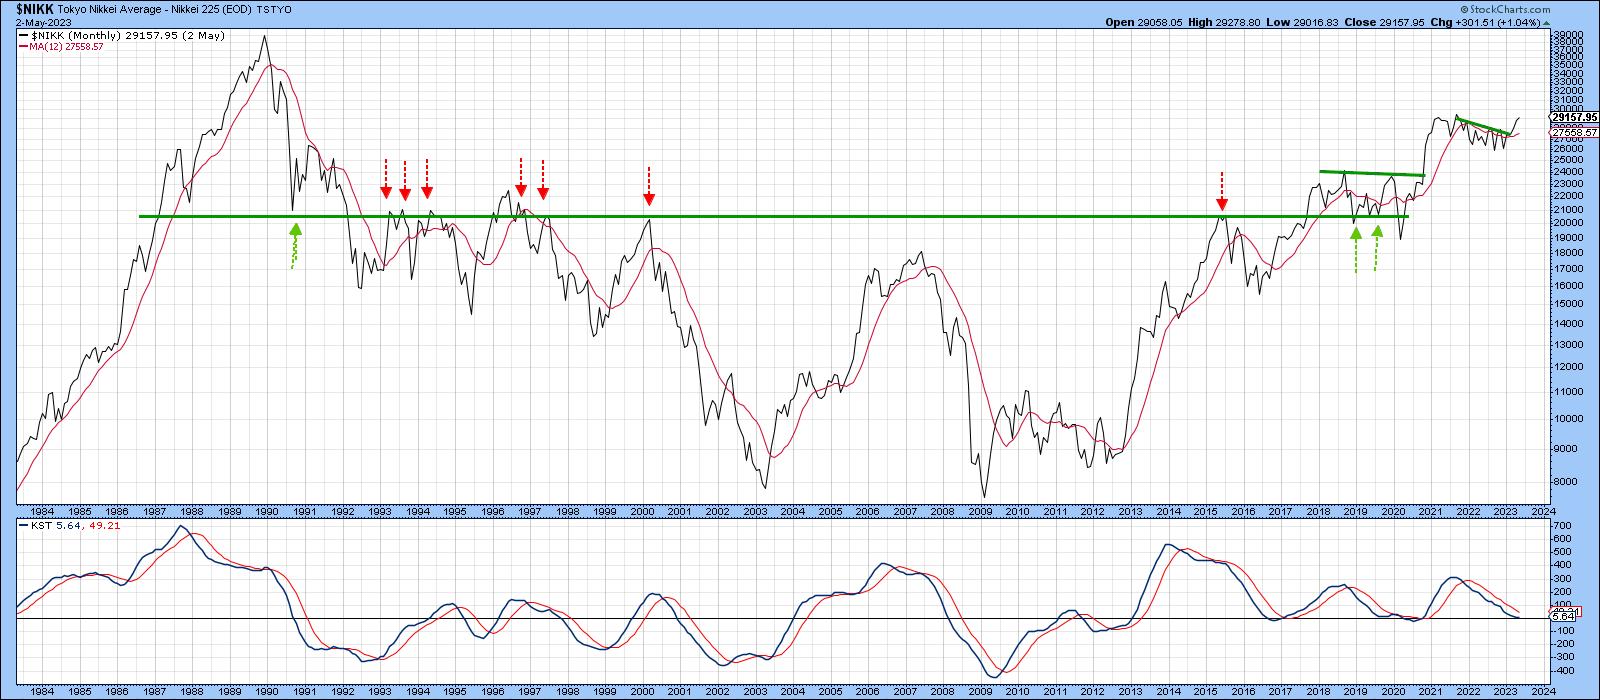
The Japanese market, as portrayed by the Nikkei ($NIKK), looks to be in great long-term shape. Once the secular low was in, its big challenge lay in the 20,000-21,000 level. This has been flagged by the horizontal green trendline. That zone of resistance has now been decisively surpassed, thereby setting the scene for higher prices. It's true that the KST is still declining, but the upside momentum implied by its recent breakout above the 2022-2023 trading range should be sufficient to result in a KST buy signal.
Conclusion
Since the Financial Crisis US equities have outperformed the rest of the world by a wide margin. Recent action by some European countries and Japan, though, suggest it may be time to begin diversifying away from the US. Regardless of whether such a relative transition does or does or does not take place, some of these overseas markets look set to move higher anyway.
Good luck and good charting,
Martin J. Pring
The views expressed in this article are those of the author and do not necessarily reflect the position or opinion of Pring Turner Capital Groupof Walnut Creek or its affiliates.


