Can We Use Golf to Forecast Oil Prices?
There used to be a rule of thumb on Wall Street that, whenever brokers upgraded to a new office after years of making do with smaller premises, it was the sign of market peak. Such behavior typically followed years of a bull market in which the investment houses had grown rich. Moreover, the expansion indicated they expected to grow even richer, a classic contrarian sign that things had moved too far in one direction and that it was time for a reversal in fortunes.
That thought occurred to me when I heard about the LIV/ PGA merger last week. I know it's a stretch, but the Saudi Oil Fund seems very confident that oil price will remain at heady levels for years to come. It also demonstrates that, after a couple of years of relatively high prices. they also have a lot of cash to throw around, just like our broker friends in days of yore.
What triggered my thinking concerning the vulnerability of oil prices is that prices are now below the point where the cuts were originally announced. A market that is unable to respond to otherwise good news is usually vulnerable. Also, reporters from the Journal, Bloomberg and Reuters were excluded from the early June meeting. Even though those from the New York Times were invited, the Times report went on to say, "The move is widely thought to be an effort by the Saudis to muffle critical coverage." If they were so confident of being able to raise prices, why take such action? As always, the answer lies in an examination of the technical position.
The Primary Trend
Chart 1 compares the Crude Oil Continuous Contract, with a PPO using the 6- and 15-month parameters. The pink shadings flag extended periods when the oscillator is below zero. The small blue arrows point out the six false negatives that have developed since 1993, which translates into one every five years -- not perfect, but certainly manageable. At the moment, the oscillator is decisively below the equilibrium point and well beyond any of those whipsaw signals. It therefore offers a unambiguously bearish warning. The chart also tells us that the price is decisively under its 24-month MA, which adds to the vulnerability of the current situation. Note the small green and red arrows, which show that the average has consistently acted as a support/ resistance barrier throughout the 30-year history of oil prices.
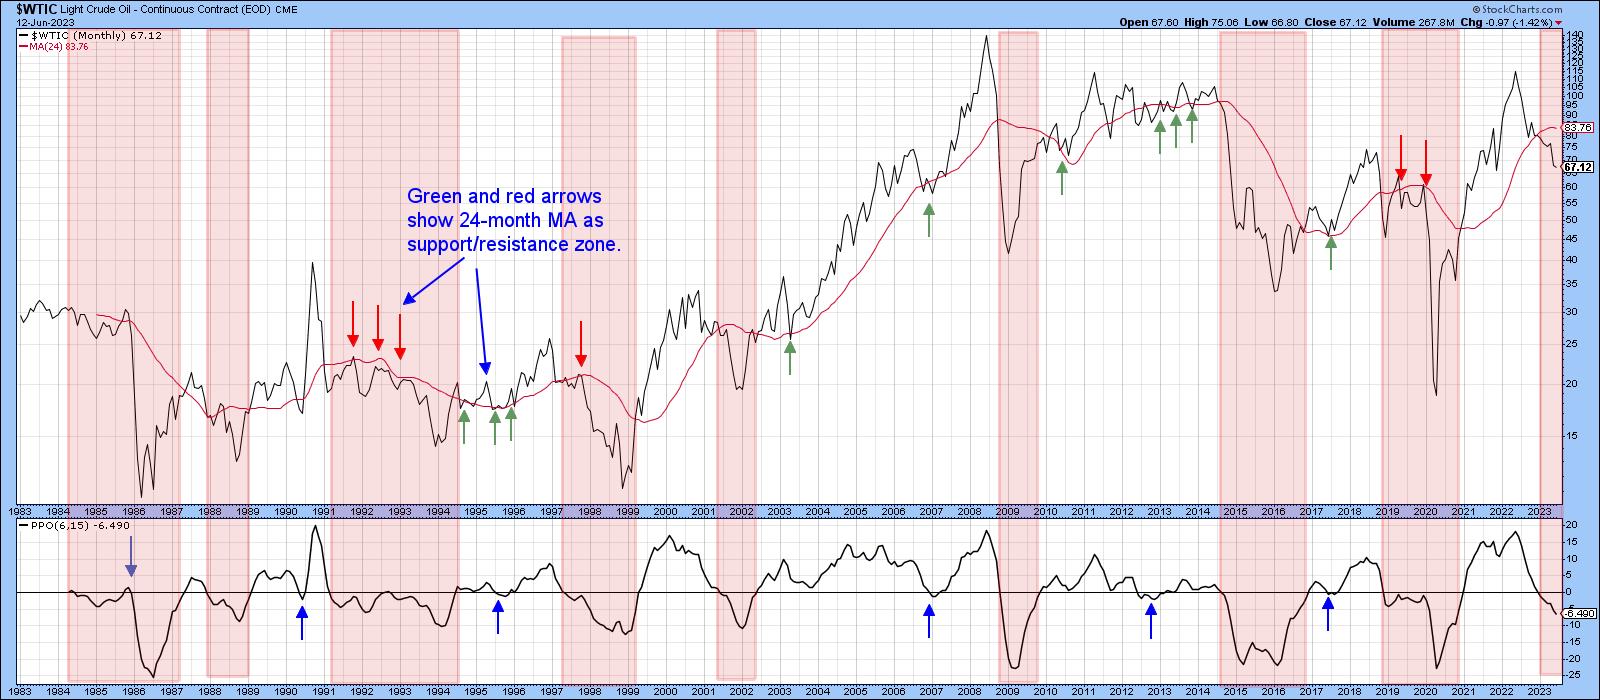
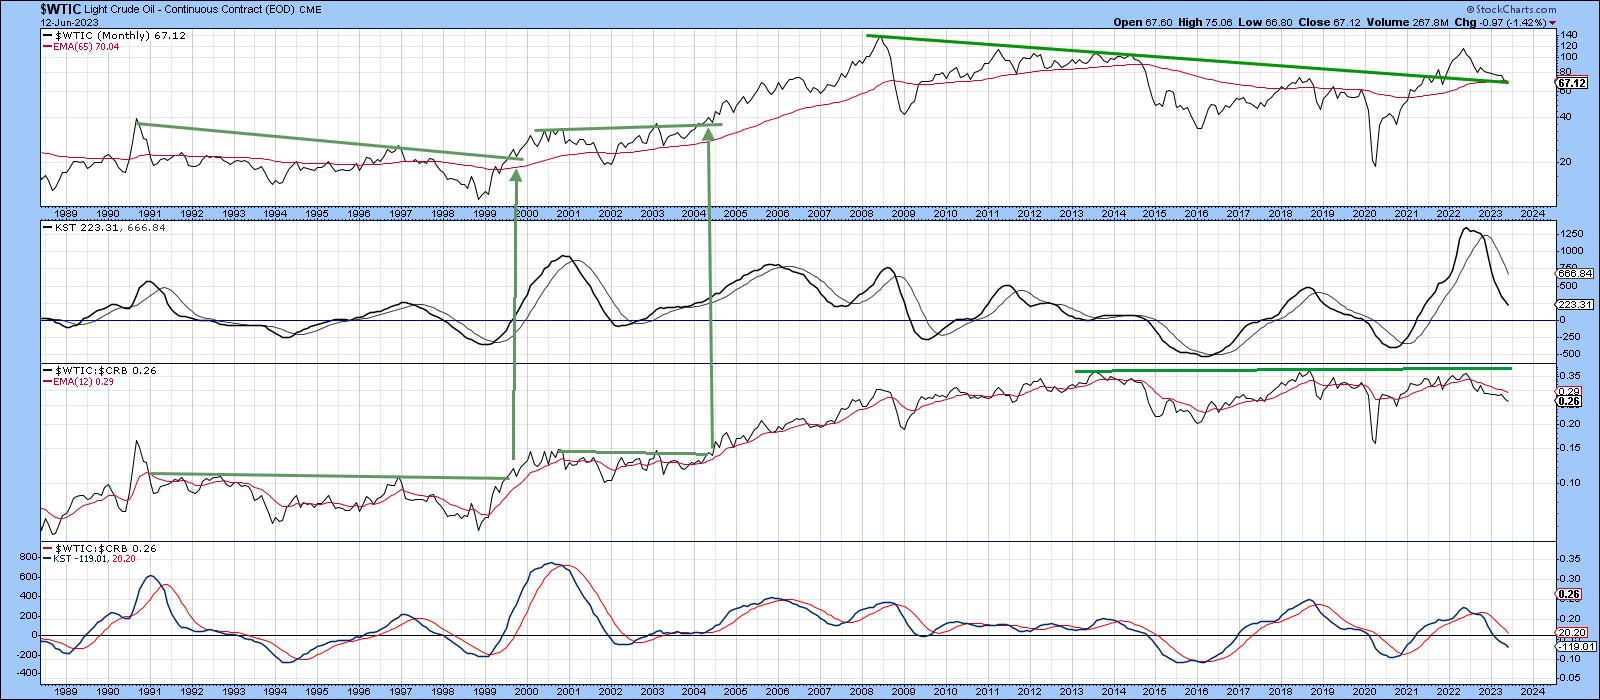
Chart 2 features weekly data and indicates the price has fallen back to important support in the form of the extended 2008-2023 down trendline. The 65-week EMA is in the same vicinity, adding to the importance of the support. The bottom two windows demonstrate the relative action of the oil price to the CRB Composite. It looked as if the RS line was going to complete a joint upside breakout, as was the case in 2005 and 2008. However, that attempt failed. Now it looks as if a period of relative under performance is likely, as the RS line has sunk to a new low under its 12-month MA. Finally, the KST for relative action, in the bottom window, is also in a downward trajectory.
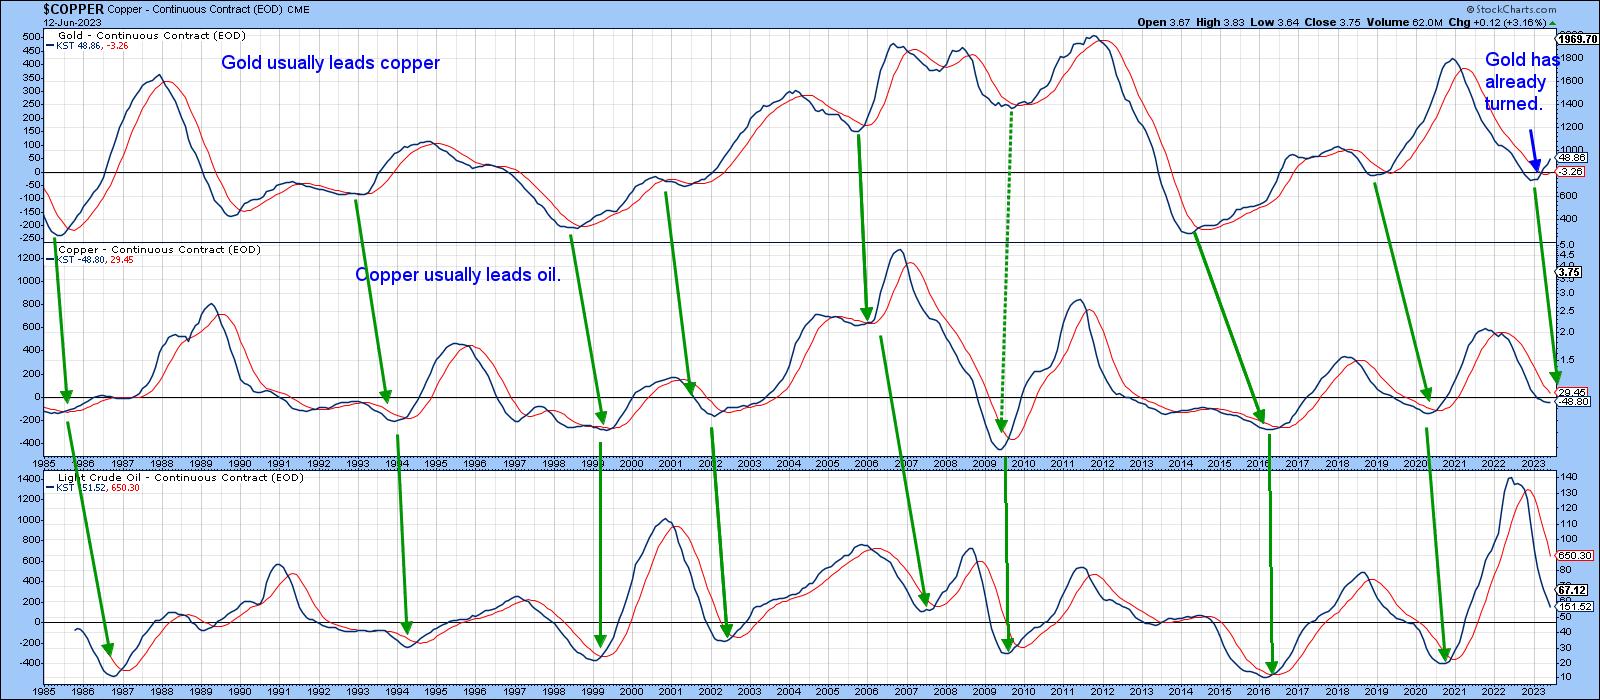
Charts 3 and 4 both compare the long-term KSTs for gold, copper and oil. Chart 3 focuses on the peaks, whereas Chart 4 looks at the troughs.
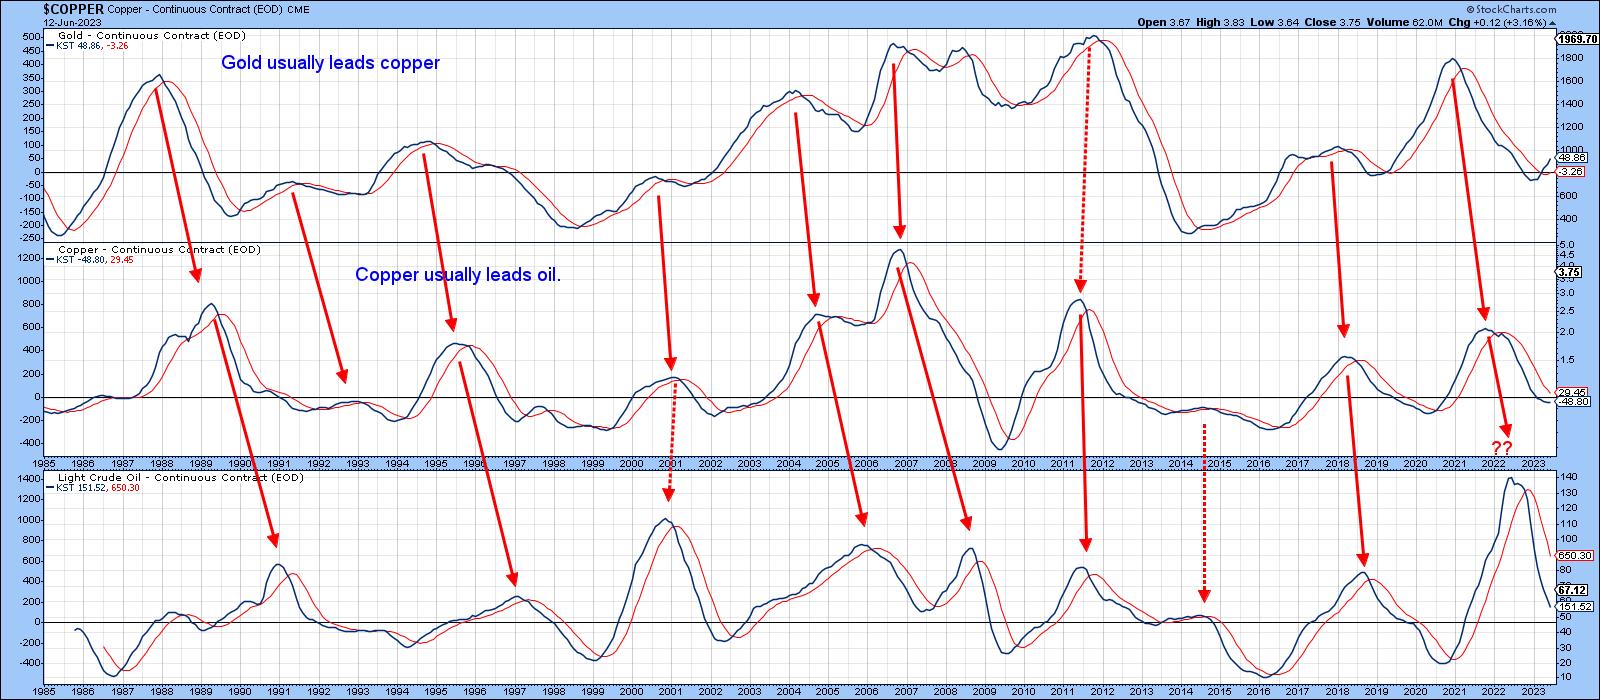
In both instances, there is a definite chronological sequence whereby gold consistently leads copper, which in turn leads the oil price. Referring to Chart 4, we can see that a new cycle has begun, with an upturn in the gold KST. Copper has started to stabilize, but is still bearish. Oil remains in a clear downward trajectory. There is nothing to suggest that this chronological pattern will not extend; however, the failure of either copper or oil to reverse to the upside suggest that the latter continues to be vulnerable.
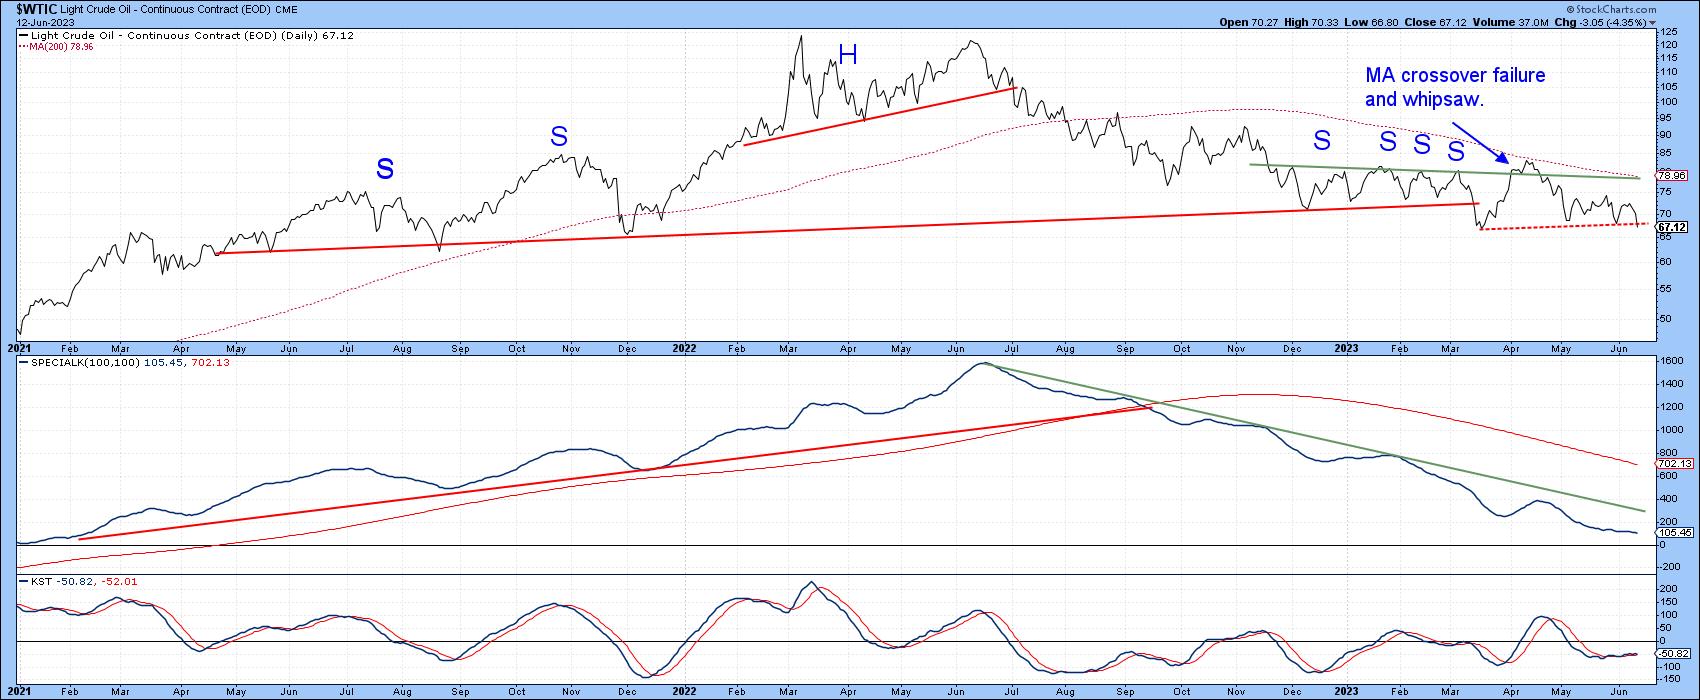
Finally, Chart 5 shows that the price completed a massive head and shoulders top in March. It then quickly bounced and subsequently experienced a breakout above the trendline, joining the four right shoulder rallies. That breakout also proved to be false. Now, the price has fallen back to the dashed red support line; any further weakness would violate the line and confirm that the upside break was indeed false. My expectation is that we will see new lows, but let's allow the market to decide that!
Good luck and good charting,
Martin J. Pring
The views expressed in this article are those of the author and do not necessarily reflect the position or opinion of Pring Turner Capital Groupof Walnut Creek or its affiliates.


