Is Gold About to Explode or Crash?
The price of gold was recently trading at an all-time monthly closing high. Since then, it has backed off, raising the question of whether that was "the" top or whether the subsequent short-term price decline represents a healthy digestion of previous price gains, which will serve as a launching pad for substantially higher prices?
Primary Trend Evidence
My rationale is if that was it, we should be seeing evidence of a primary trend reversal. Charts 1 and 2 suggest otherwise. Chart 1, for instance, shows that the secular uptrend that at the beginning of the century is still intact. That's because the price is trading above the red up trendline and its 12-month MA. We can see that this action is supported by a positive long-term KST. It has only recently gone positive and is by no means overextended. Equally important is the fact that the price has broken out of its 2020-23 trading range and has, so far managed to hold above the breakout point.
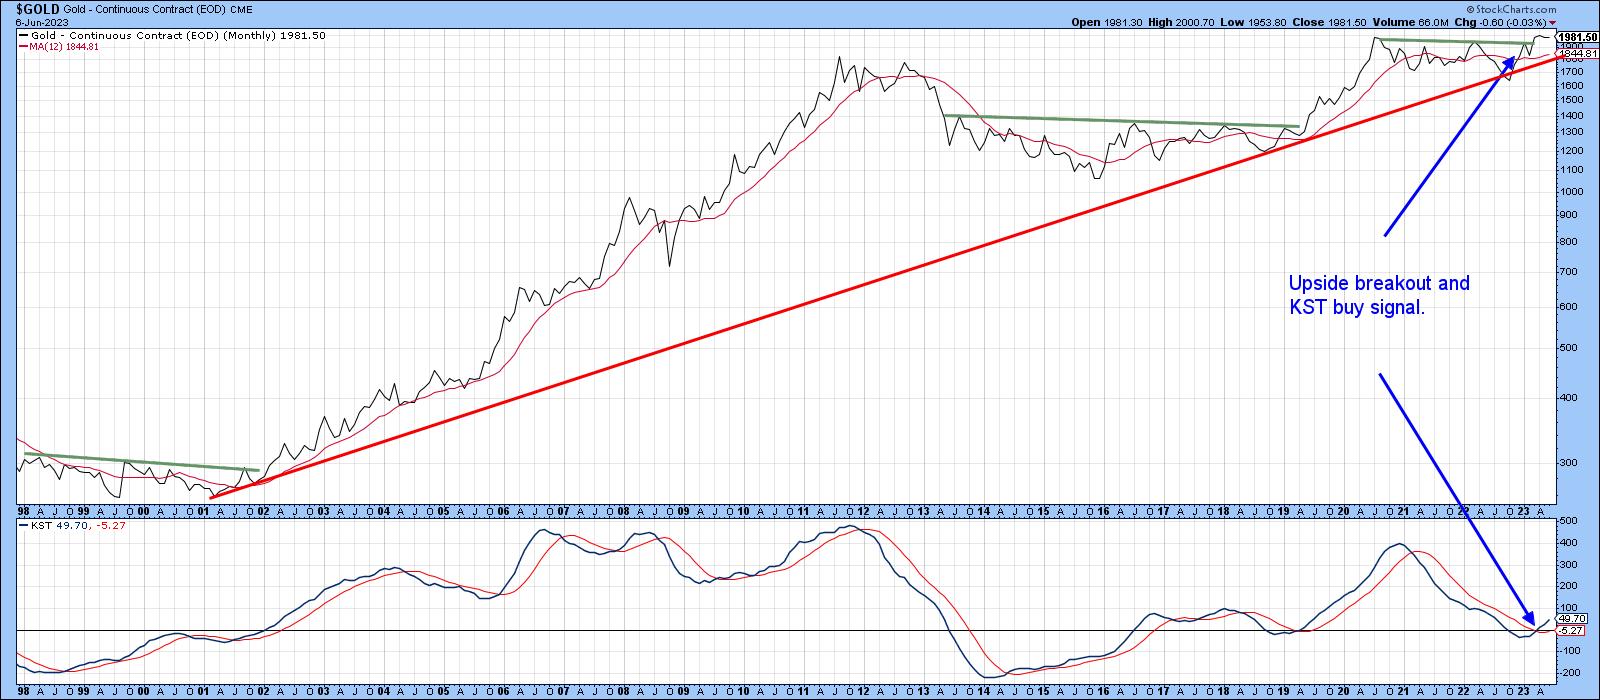
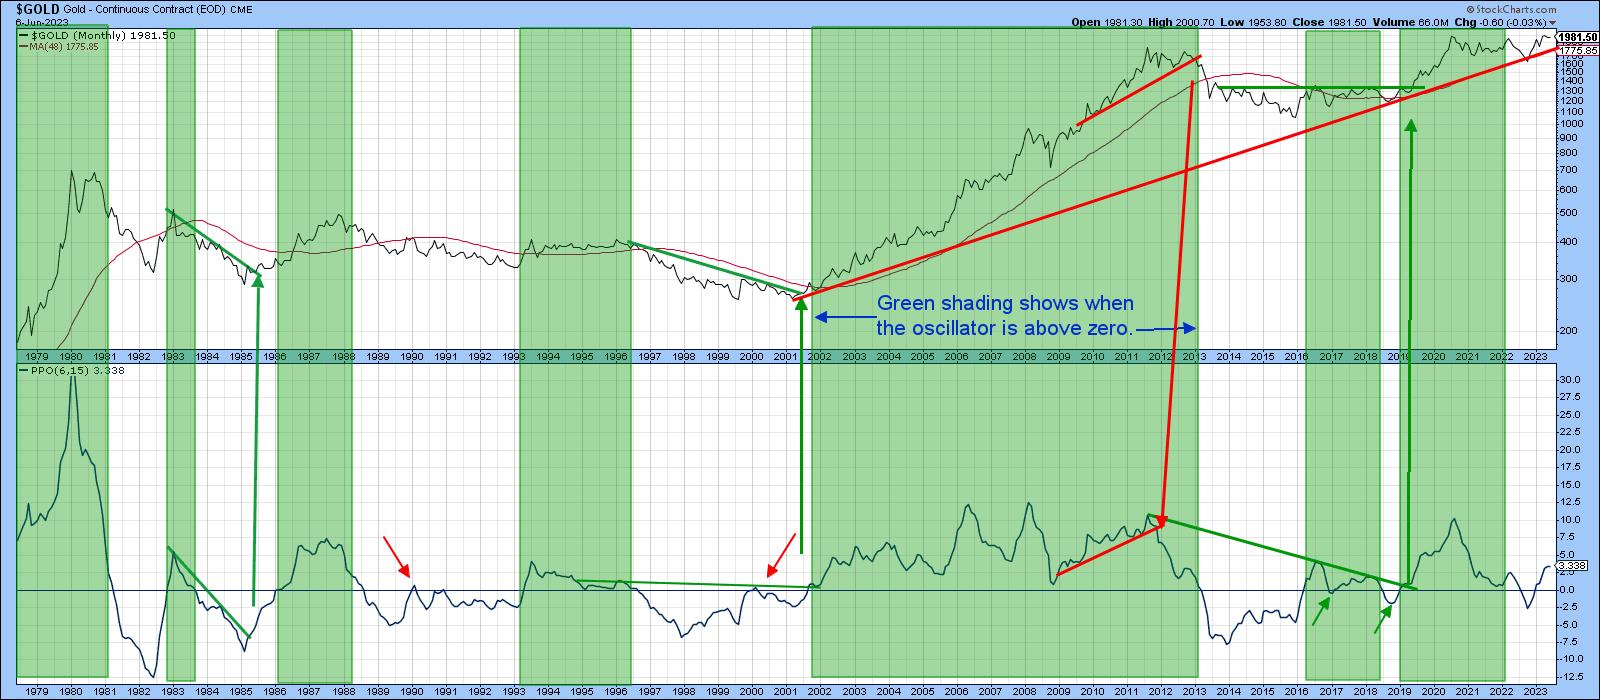
Chart 2 is also encouraging. Here, the gold price is being compared to a PPO using the 6- and 15-month parameters. Extended periods when the indicator traded above zero have been flagged with the green shadings. The four small red and green arrows tell us when whipsaw signals developed; four false signals in 40-plus years of data is not a bad performance. Currently, the PPO is rising and comfortably above its equilibrium point, so an imminent sell signal is not likely. It is also apparent that the secular up trendline is covering the 48-month MA ($1775). Support being provided by these two indicators is formidable. If violated, it would remove a strong pillar for the long-term bullish case.
Character Matters
Short-term indicators behave in a different way in a bull market than a primary bear. During a bull market, oscillators tend to easily reach overbought conditions, with sell signals being ineffective as a bullish primary trend rising tide lifts all boats. Furthermore, on the rare occasion that an oscillator reaches an oversold condition, the price almost invariably snaps back. During a bear market, these characteristics operate in reverse. It follows from this differing behavior that oscillator action can be studied to see whether it is more characteristic of a primary up or downtrend.
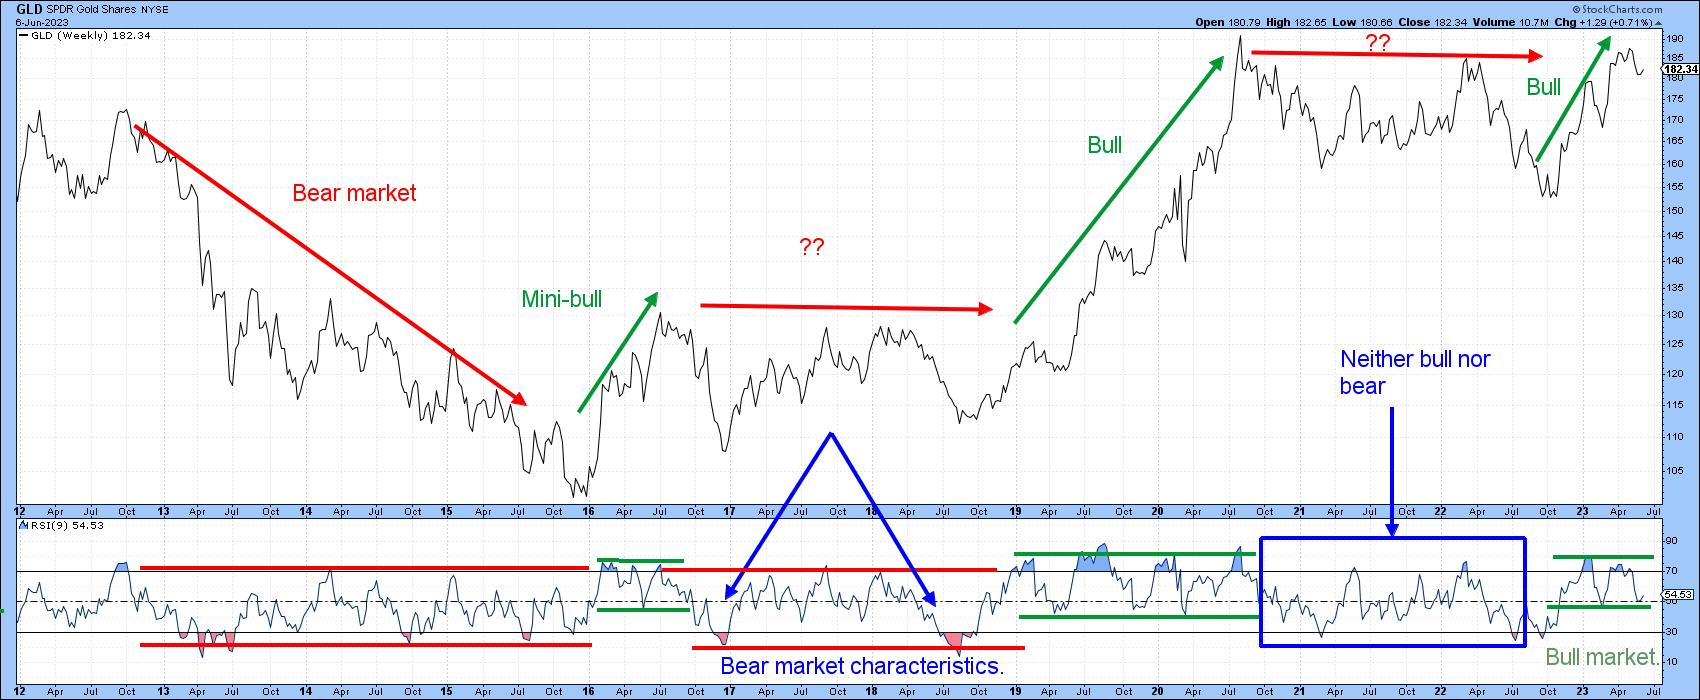
In that respect, Chart 3 compares weekly gold to a 9-week RSI. In a clear-cut bull market like the 2019-20 advance, the railroad tracks for the RSI move distinctly to the north, followed by a corresponding switch to the south during the 2013-15 primary bear market. Since last October, there has been a definite changeover to bull market characteristics, with an instant bounce to the first and only oversold condition outside of the blue rectangle. Following that, two persistent (blue) overbought conditions developed. The subsequent corrections ended around the 50-mark, not much different from the lower tracks which earmarked the previous two bull markets.
Short-Term Gold is Moderately Oversold
The short-term trend for gold is currently negative. That said, there are several reasons for expecting a possible reversal.
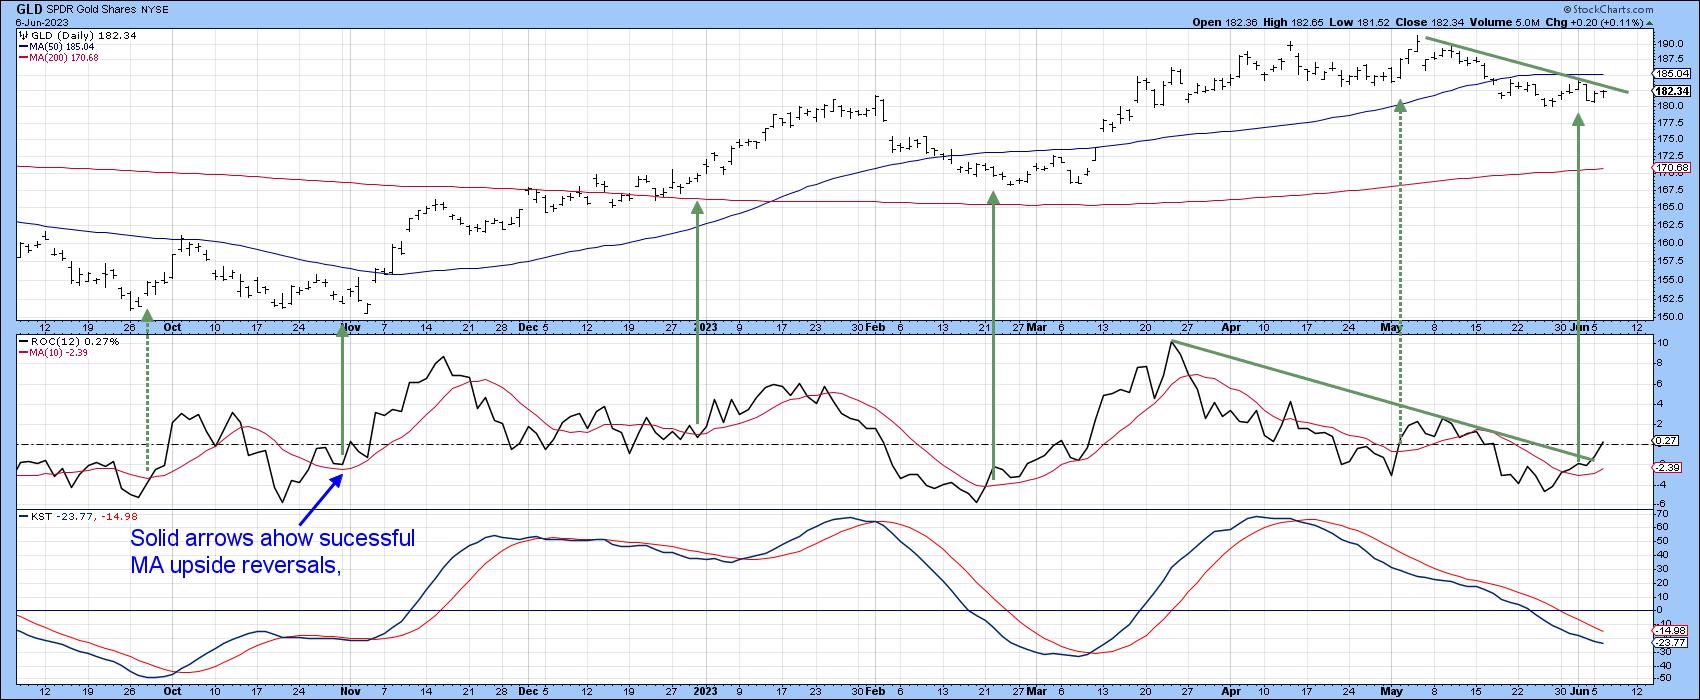
First, Chart 4 shows that the daily KST for the SPDR Gold Trust (GLD) is moderately oversold. If our bull market "rising tide lifts all boats" scenario holds out, that suggests a repeat of last November and March, when a similar KST reading was enough to act as a foundation for a rally.
Second, the 12-day ROC has violated a down trendline and has therefore reinforced the upside reversal in the 10-day MA. The all-important and highly necessary signal has not yet been triggered. That would come with a break above the May/June down trendline, with added confidence being added with a daily close north of the 50-day MA at $195.
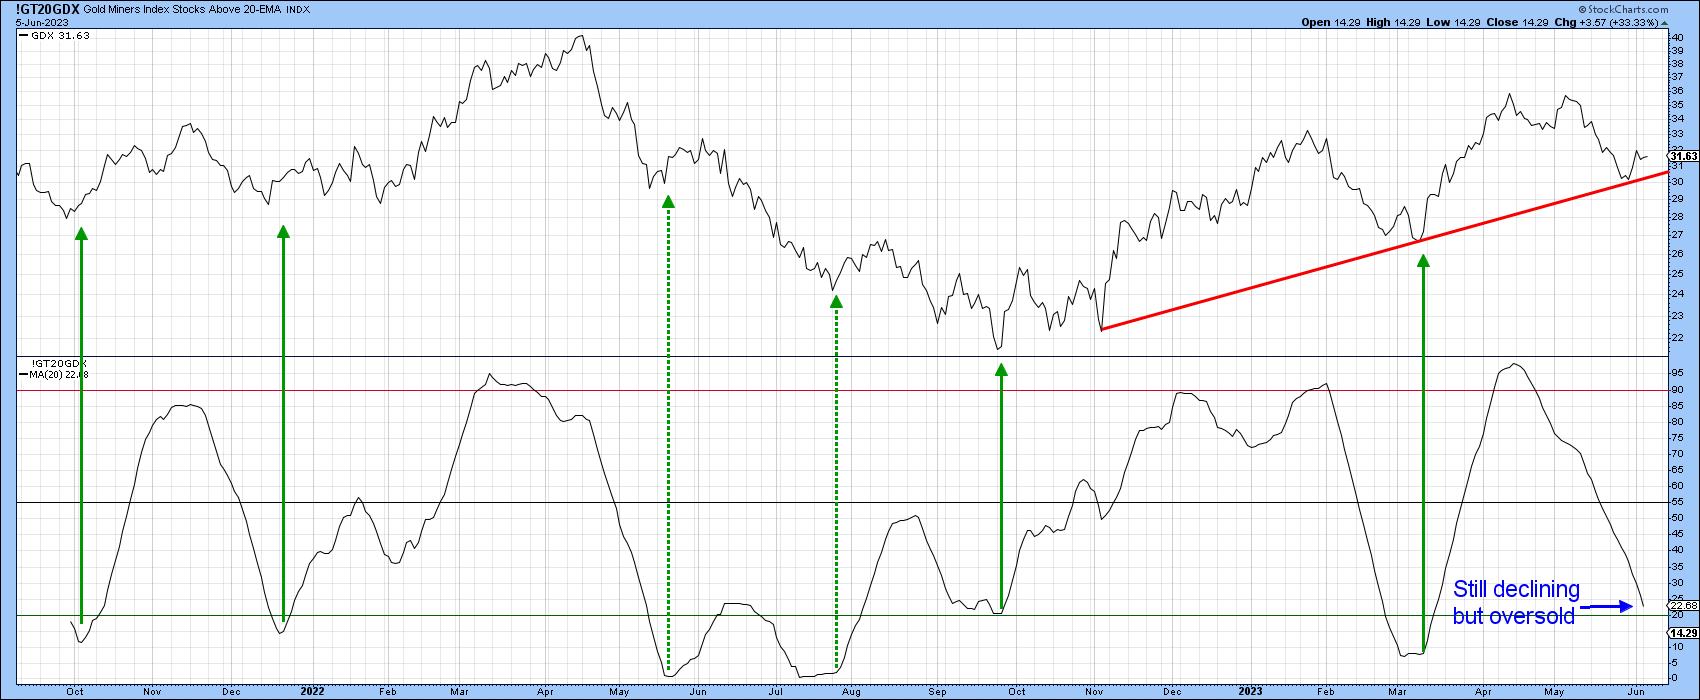
Finally, gold shares usually move in concert with the price of the yellow metal itself. In that respect, a 20-day MA of the number of gold stocks above their 20-day EMA continues to drop, so we cannot say that it is bullish. However, it is oversold. Upside reversals from similar levels have usually been followed by a nice rally, when triggered under the context of a primary up trend. Once again, I do want to stress that a buy signal has not yet been given. However, if the bull market is alive, this is as good a place as any for expecting a short-term reversal, especially as the GDX has recently found support and bounced from its bull market trendline.
Good luck and good charting,
Martin J. Pring
The views expressed in this article are those of the author and do not necessarily reflect the position or opinion ofPring Turner Capital Groupof Walnut Creek or its affiliates.


