It's Time for These Chinese ETFs to Play Catch-Up
There have recently been a lot of depressing stories concerning the state of the Chinese economy. Here are a spattering of headlines that appeared just today:
- China's Economic Recovery Weakens as Growth Concerns Linger (WSJ)
- China Manufacturing Keeps Shrinking, Weighing on Economic Recovery (Bloomberg)
- More Stimulus "Desperately Needed" as China's Economic Recovery Slows Further (CNN)
In my book, that kind of negative consensus is often the precursor of a rally. After all, markets factor in that bad news ahead of time. Consequently, when the news finally breaks, it's usually time to examine the technical picture to see if a new trend may be underway. With that in mind, I am going to start off with a quick examination of the Shanghai Composite, later following up with some Chinese ETFs traded on US exchanges.
Shanghai Composite
Chart 1 compares the Shanghai Composite to its long-term KST. The green-shaded areas tell us when the Index is above its 12-month MA and the KST is north of its 9-month MA. It's not a perfect approach, but it does avoid major declines and captures the most significant rallies.
As you can see, this technique recently went positive. The KST has not yet experienced what we might call a decisive break, so it's not unreasonable to question its validity until a little more strength could put the issue beyond a reasonable doubt.
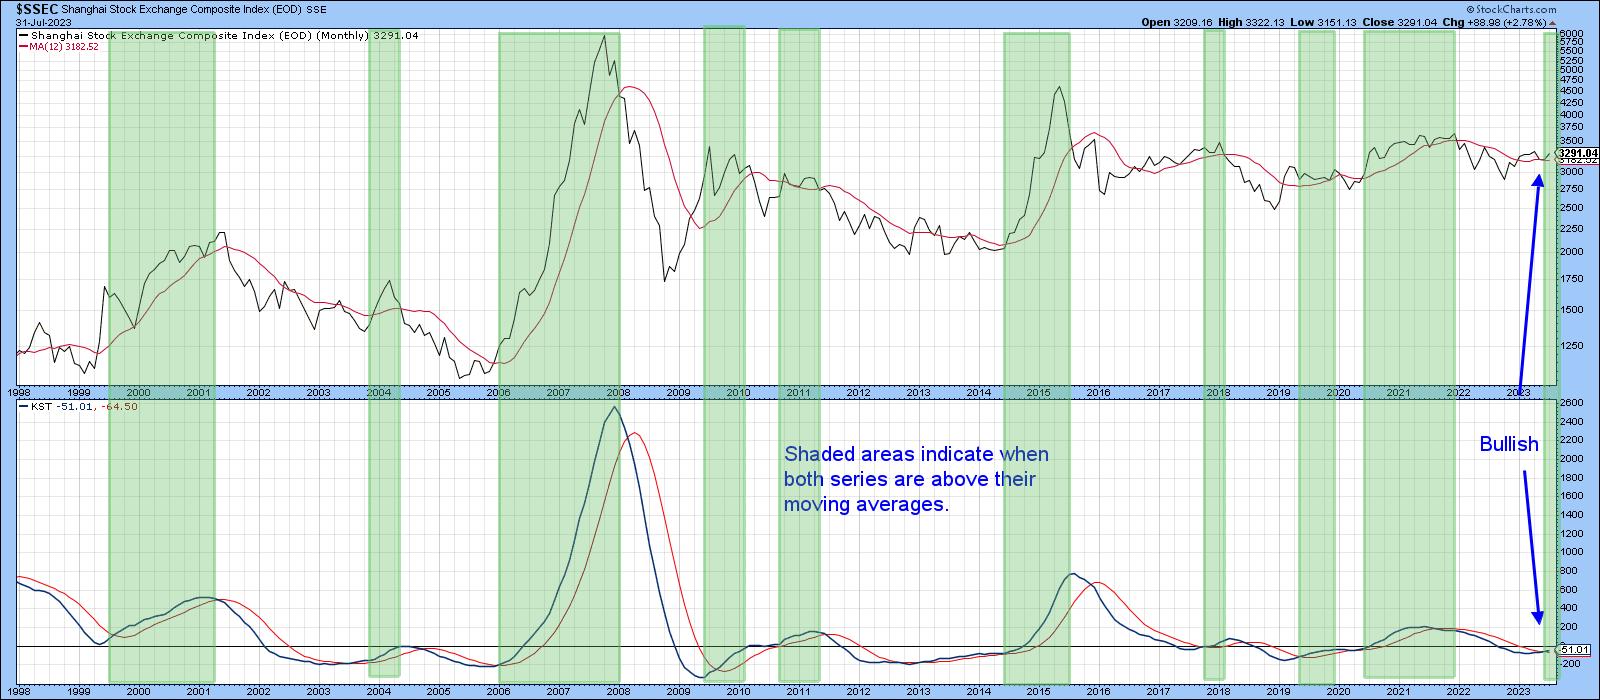
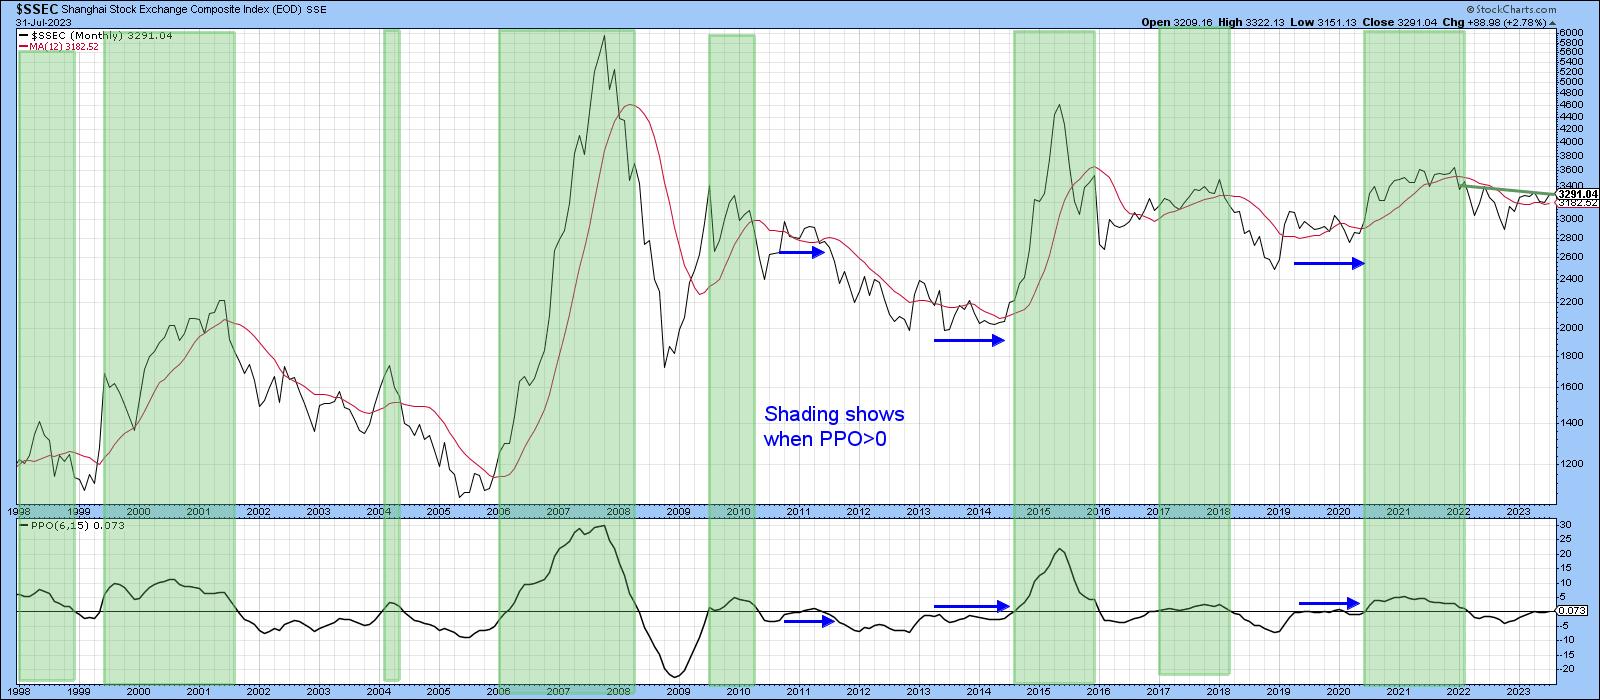
Chart 2 flags periods when the PPO using the 6- and 15-month parameters is above zero. Right now, it is literally right at that equilibrium point and poised for a signal. The small blue arrows indicate instances when the PPO has traded sideways close to zero for an extended period. A worthwhile move has usually followed. The indicator has been close to equilibrium since the beginning of the year, so, if the Index can complete the potential inverse head-and-shoulders with a month-end close above 3,350, a spirited rally would likely follow.
US-Listed Chinese ETFs
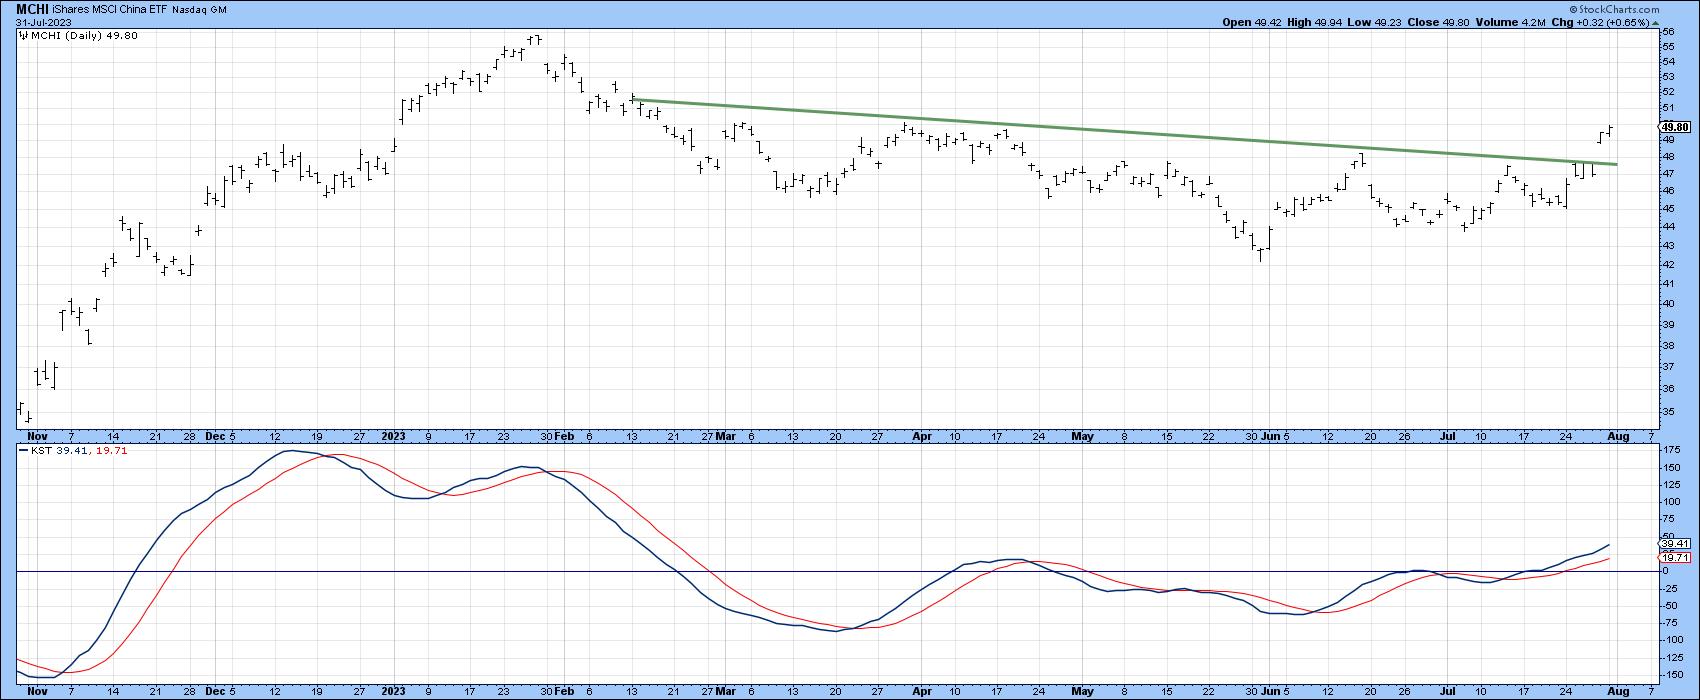
The iShares MSCI China ETF (MCHI) seeks to track the MSCI China Index and is one of the most liquid Chinese shares. The price is trading above its 12-month MA, and the KST is bullish as well. The MCHI also looks as if it is in the process of completing a reverse head-and-shoulders. That would happen with a month-end close north of $52.50.
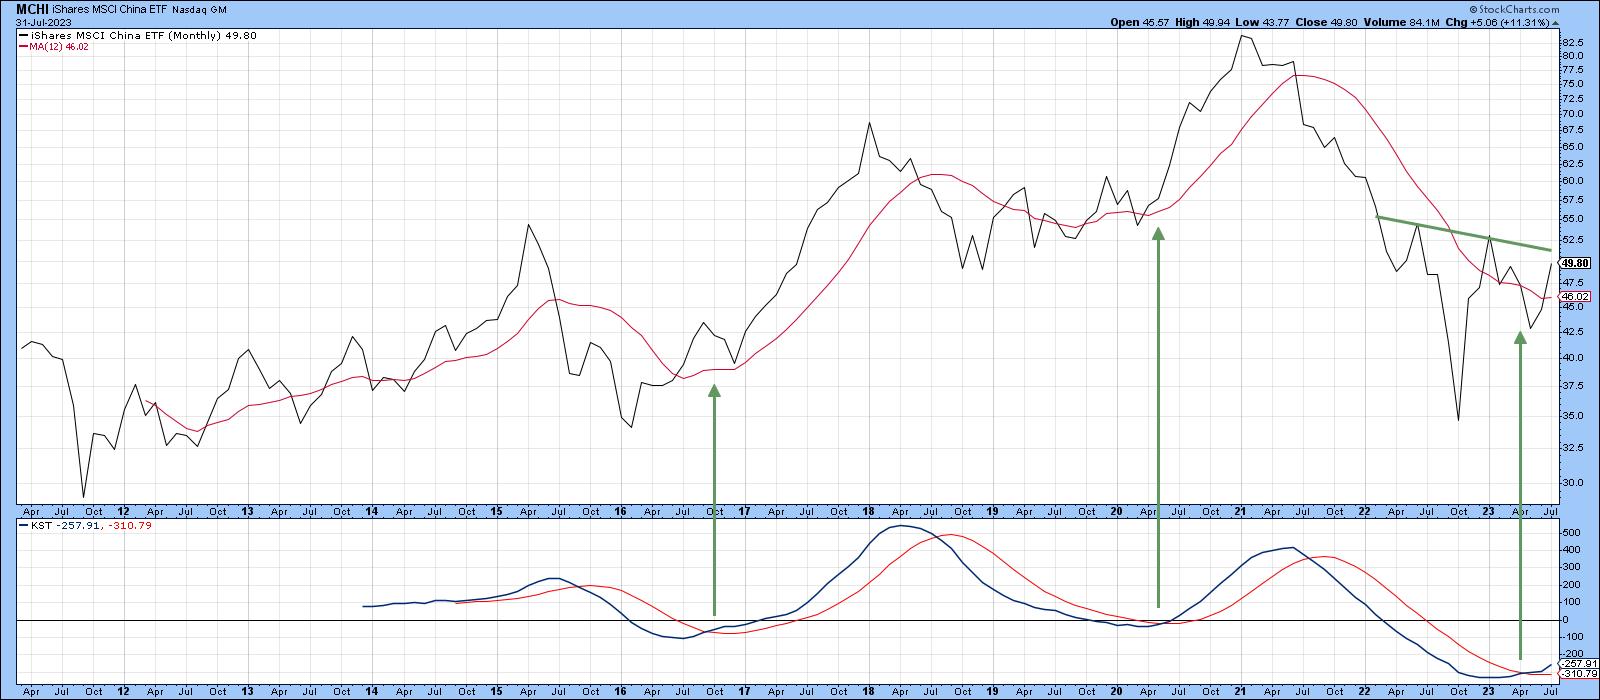
Chart 4 features weekly data together with a 13-week ROC. The thing that impresses me is the fact that the ROC was recently able to register a record reading in excess of 50%. That's either bullish or bearish, depending on your timeframe. First, it's obviously an overbought condition, where the odds favor some kind of corrective activity, so it's near-term bearish, which proved to be the case. Alternatively, from a primary trend aspect, the record reading is an extremely unusual sign that psychology has changed, so it's an early bird signal that a new bull market just began. I call these events "mega-overboughts". Once they are confirmed by a price trend reversal, they usually work. That has just happened with a violation of the 2021-23 down trendline.
There is one other observation from the chart worth noting, relating to the 40- and 65-week moving averages, which are currently converging. We can also see that the short-term time span is in the process of crossing above its longer-term counterpart. Previous examples, which have been flagged by the green arrows, were all followed by some form of a rally.
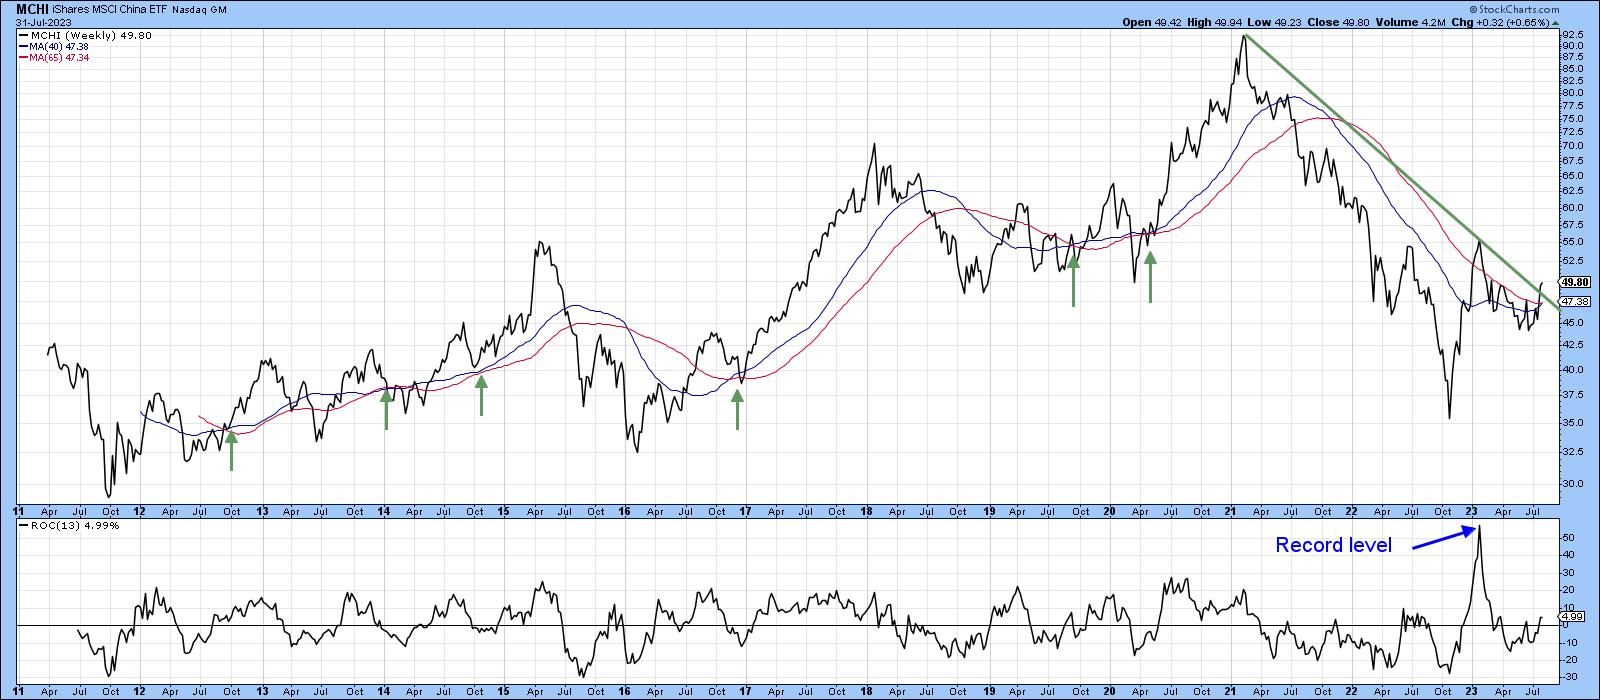
Chart 5 takes us down to the daily action and that shows the MCHI has broken out from its 2023 base, under the cover of a positive a short-term KST.
Charts 6-9 feature Chinese sector ETFs that look promising. They have either broken out in a tentative manner or require additional near-term strength to do so. Chart 5, for instance, indicates that the Global X China Financials (CHIX) are just below its 2028-23 down trendline for both the absolute and relative price. The long-term KSTs are bullish and should enable a breakout to take place.
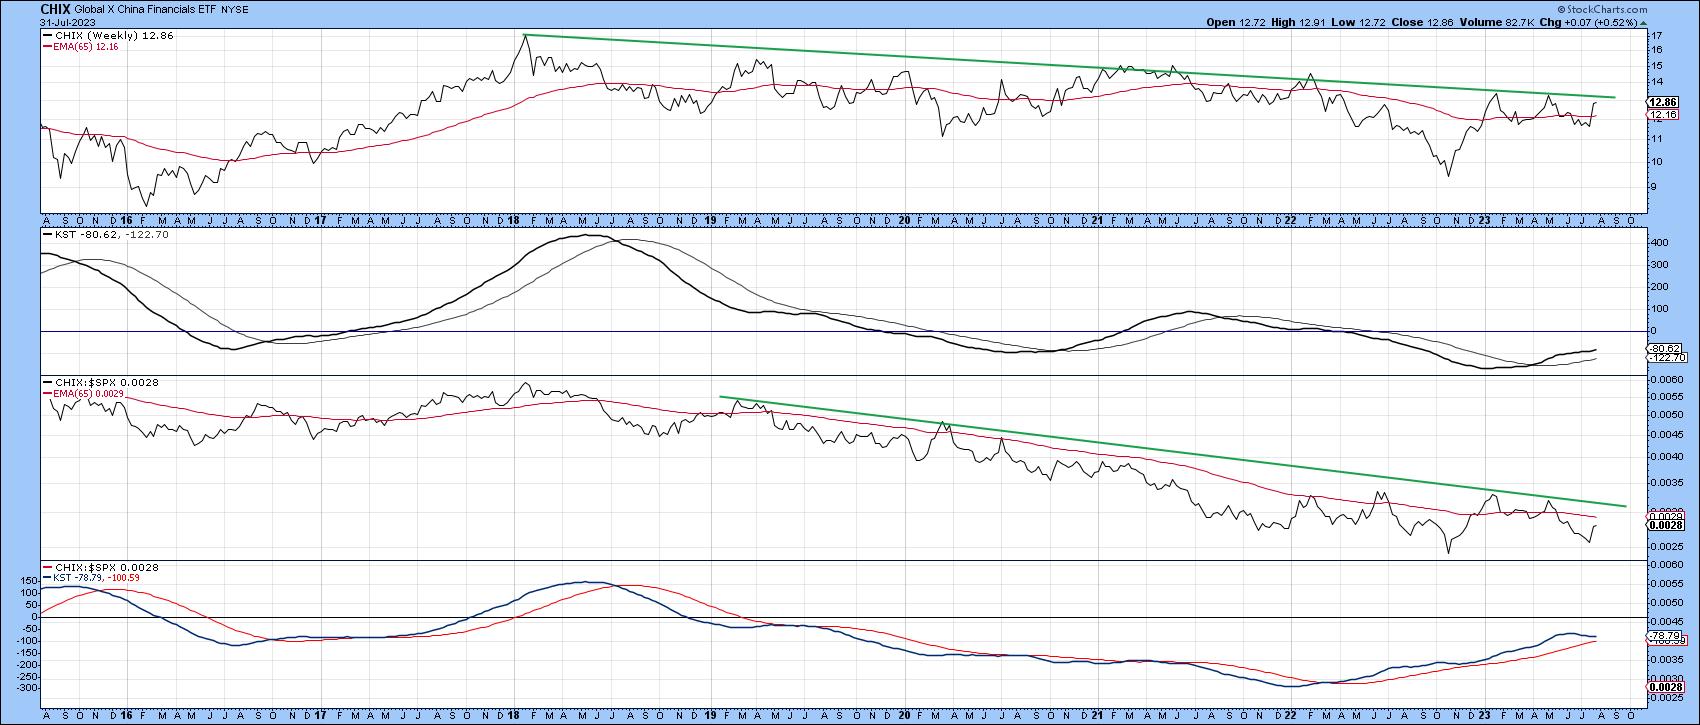
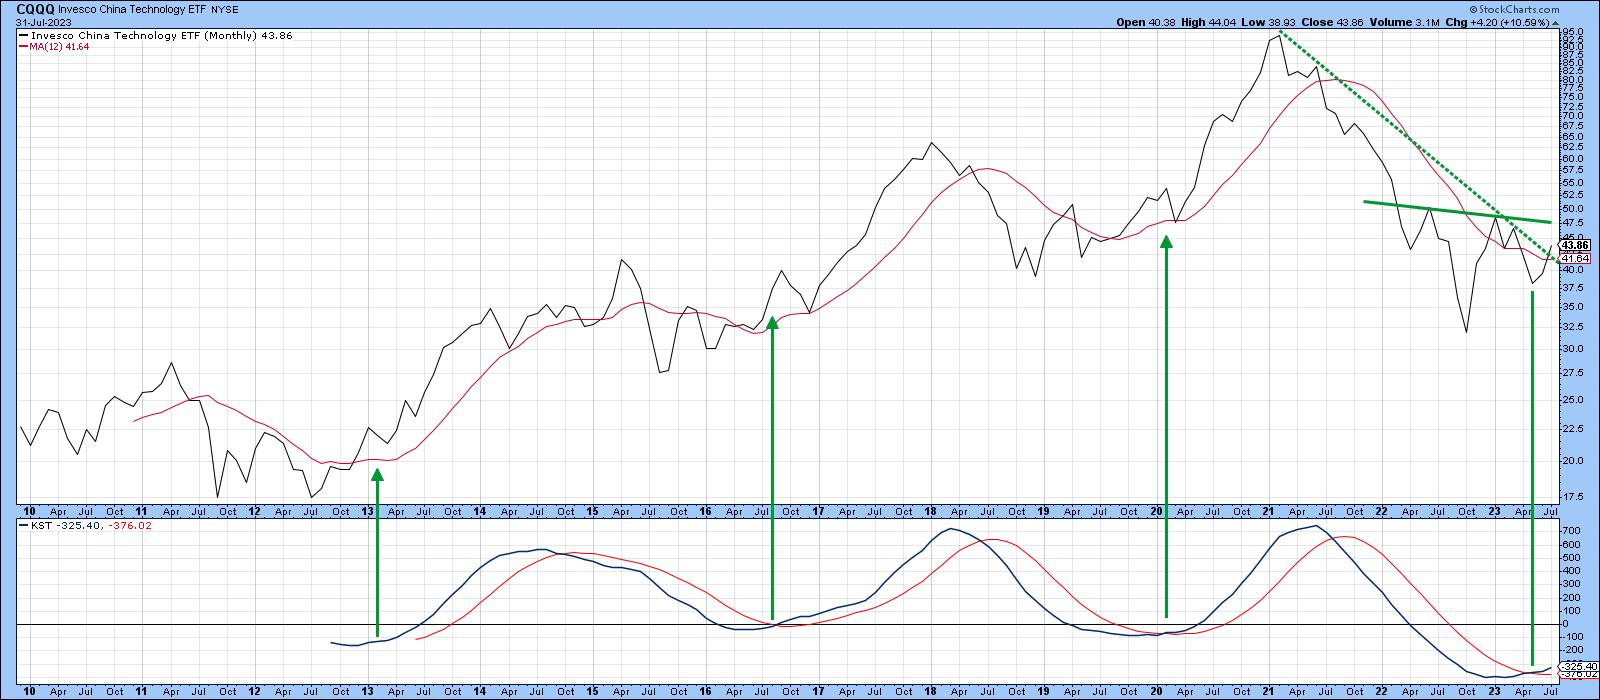
Chart 7 shows that the long-term KST for the Invesco China Technology (CQQQ) has just gone bullish. The three previous ones were followed by a nice rally. The price has already confirmed with a bear market trendline violation, and only requires a month-end close above the neckline at $47.50 to complete the bullish picture.
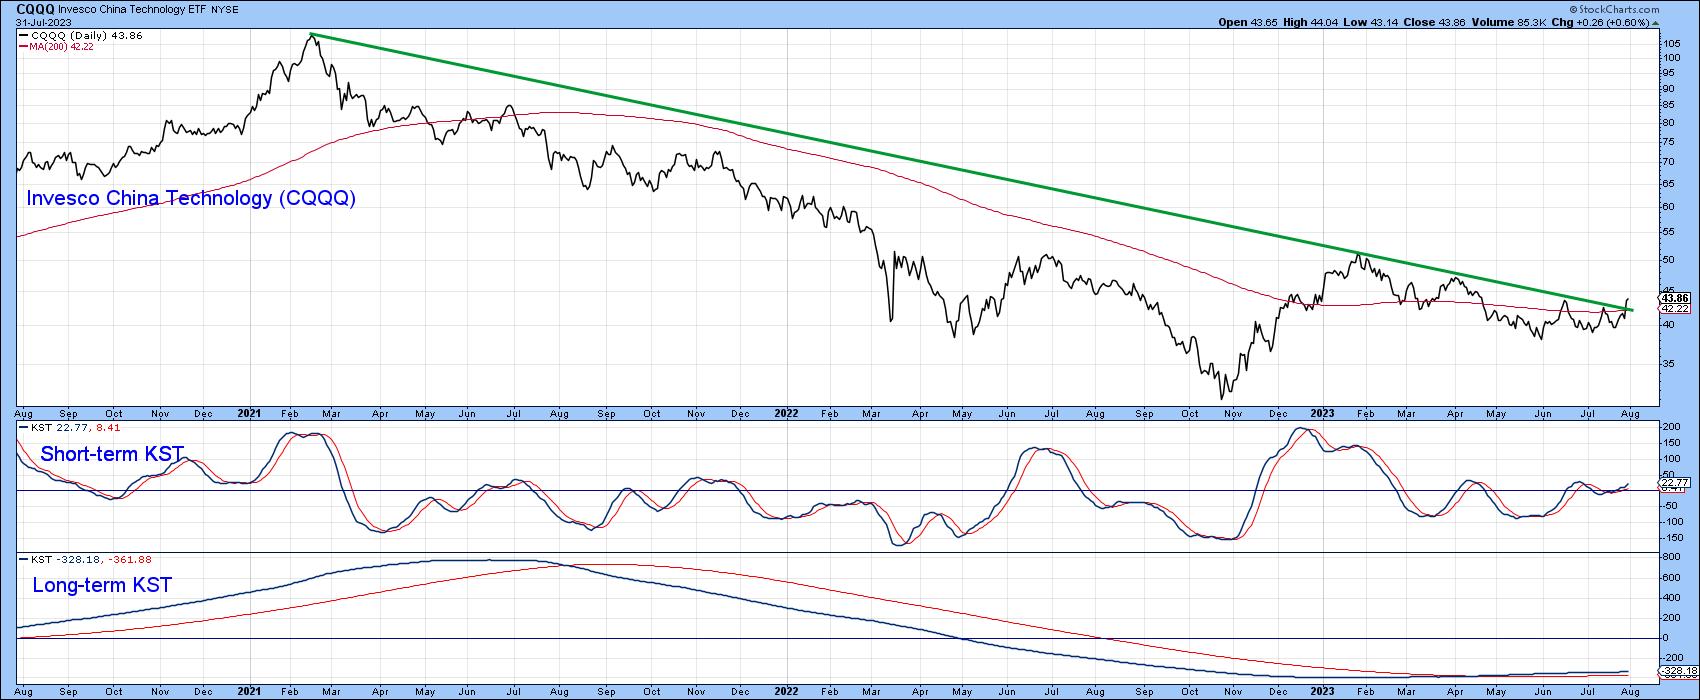
That's likely to happen because Chart 8 reveals a positive short-term KST and very recent down trendline violation.
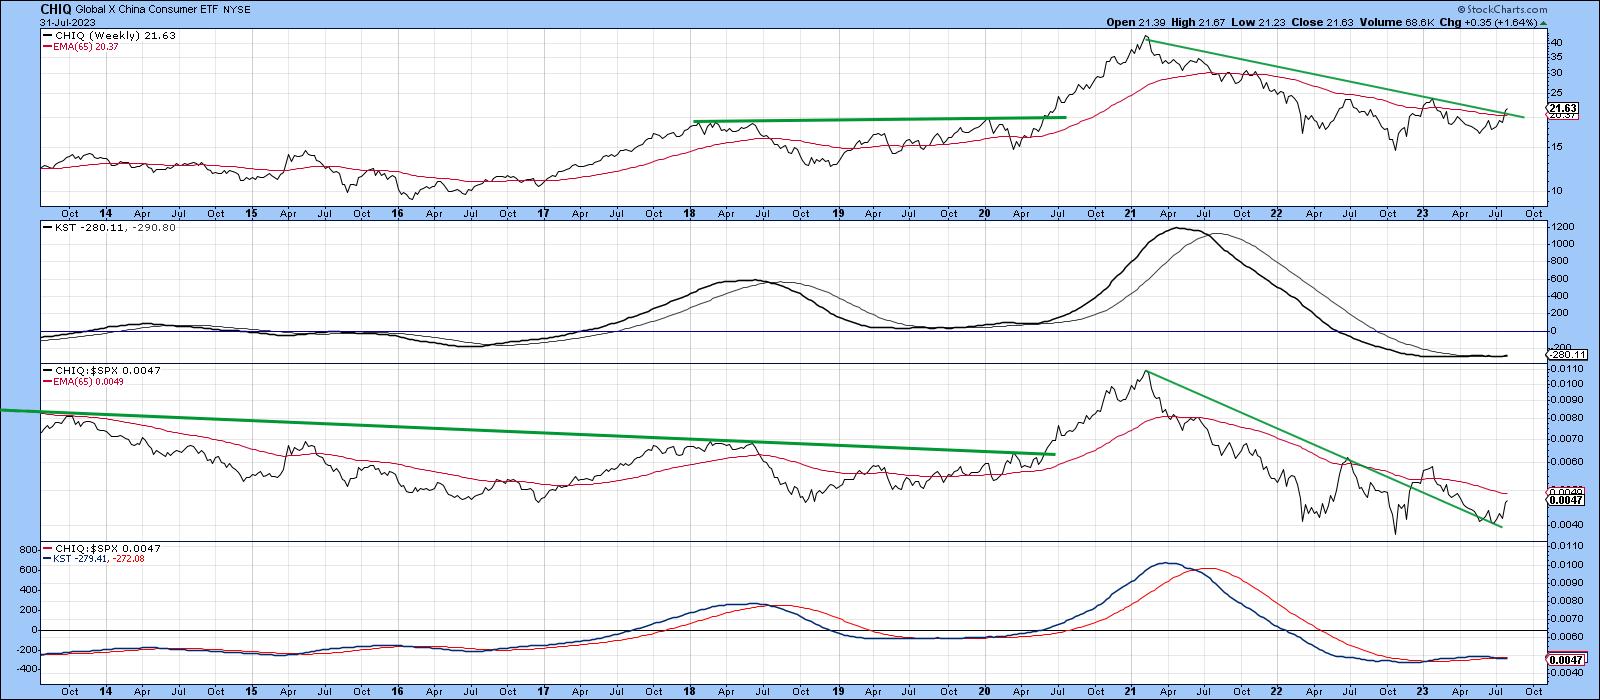
Finally, Chart 9 tells us that both the price and RS line against the S&P for the Global X China Consumer ETF (CHIQ) have violated down trendlines. The breakout for the price is tentative at this point, but the whole setup looks encouraging.
Good luck and good charting,
Martin J. Pring
The views expressed in this article are those of the author and do not necessarily reflect the position or opinion of Pring Turner Capital Groupof Walnut Creek or its affiliates.


