Taking a Deep Dive Into Dr. Copper and What it Means
Last week, I pointed out that several indicators were close to triggering a bull market for commodities. Some of those benchmarks have since been met, but none have yet moved decisively in that direction. Now, it's time to take a deep dive into the copper price, as this widely-used base metal has often served as a leading indicator for commodities in general.
Copper vs. Commodities in General
We can see that from Chart 1, which compares the long-term KST for the CRB Composite to one for the copper price. The arrows connect the lows and show that copper generally leads or coincides with momentum bottoms in the CRB. Copper momentum has recently begun to flatten, but has yet to confirm a reversal by crossing above its MA. It is, though, in a better position to experience an upside reversal than the CRB KST.
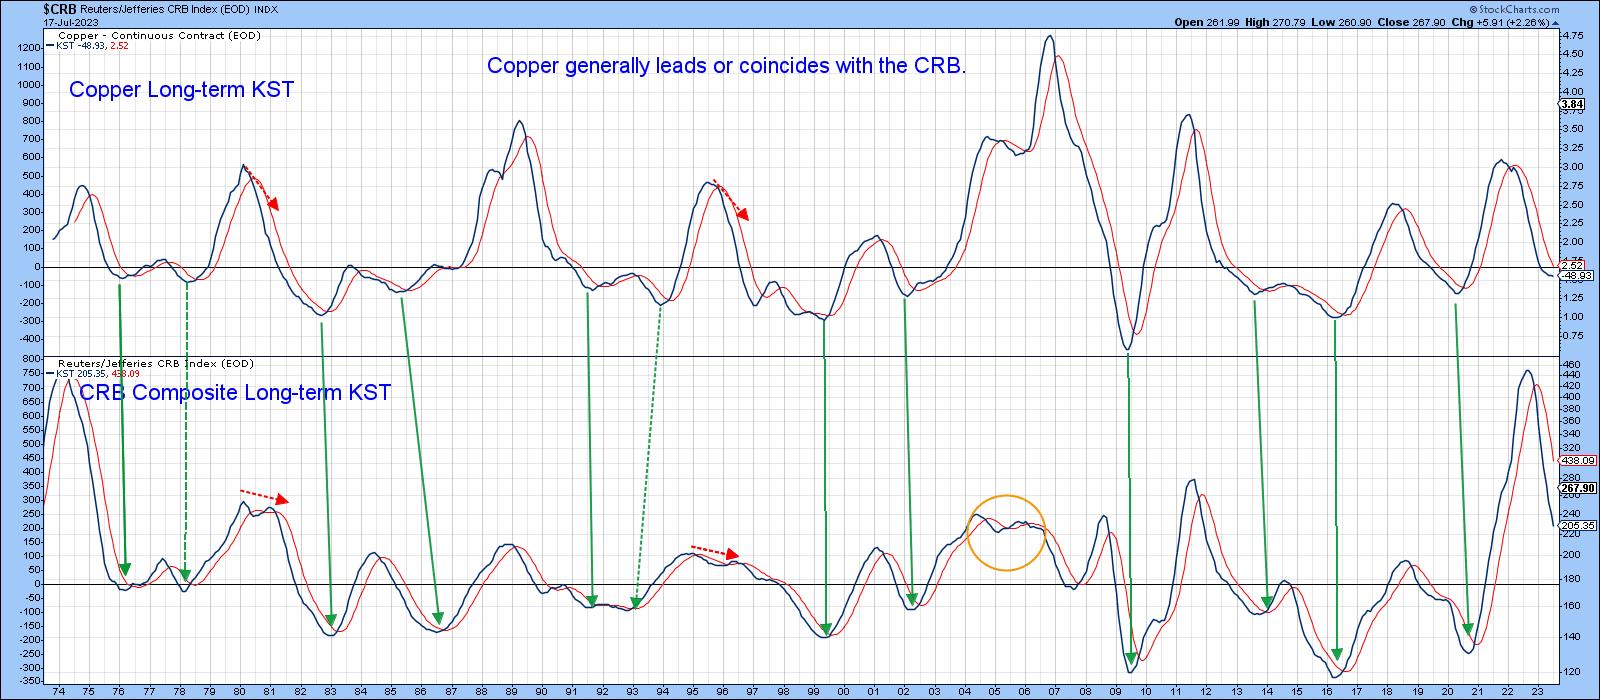
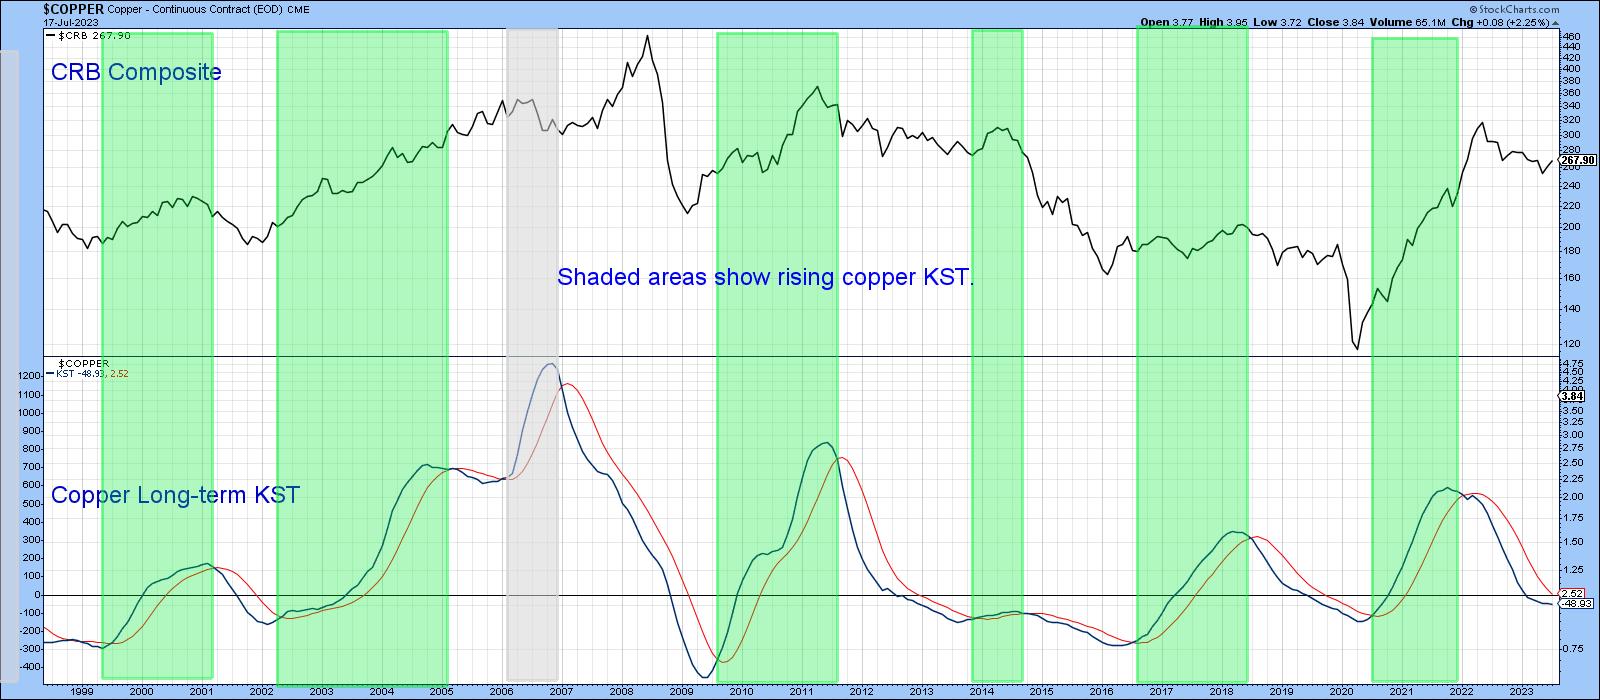
Chart 2, taken from last week's article, demonstrates that, when the KST for copper does cross its MA (which it is poised to do), that will be a bullish development for commodities in general.
The Copper Price
Chart 3 shows a monthly chart of copper together with a 48-month MA. If looks as if the price is in the terminal process of completing a giant ascending right-angled triangle. I need to stress that it has not yet been completed, since that would require a decisive monthly closing price that can hold above the upper trendline, say, between $5-$5.25. The point of displaying this potential formation, though, is to indicate the technical potential for substantially higher prices, if a breakout does materialize.
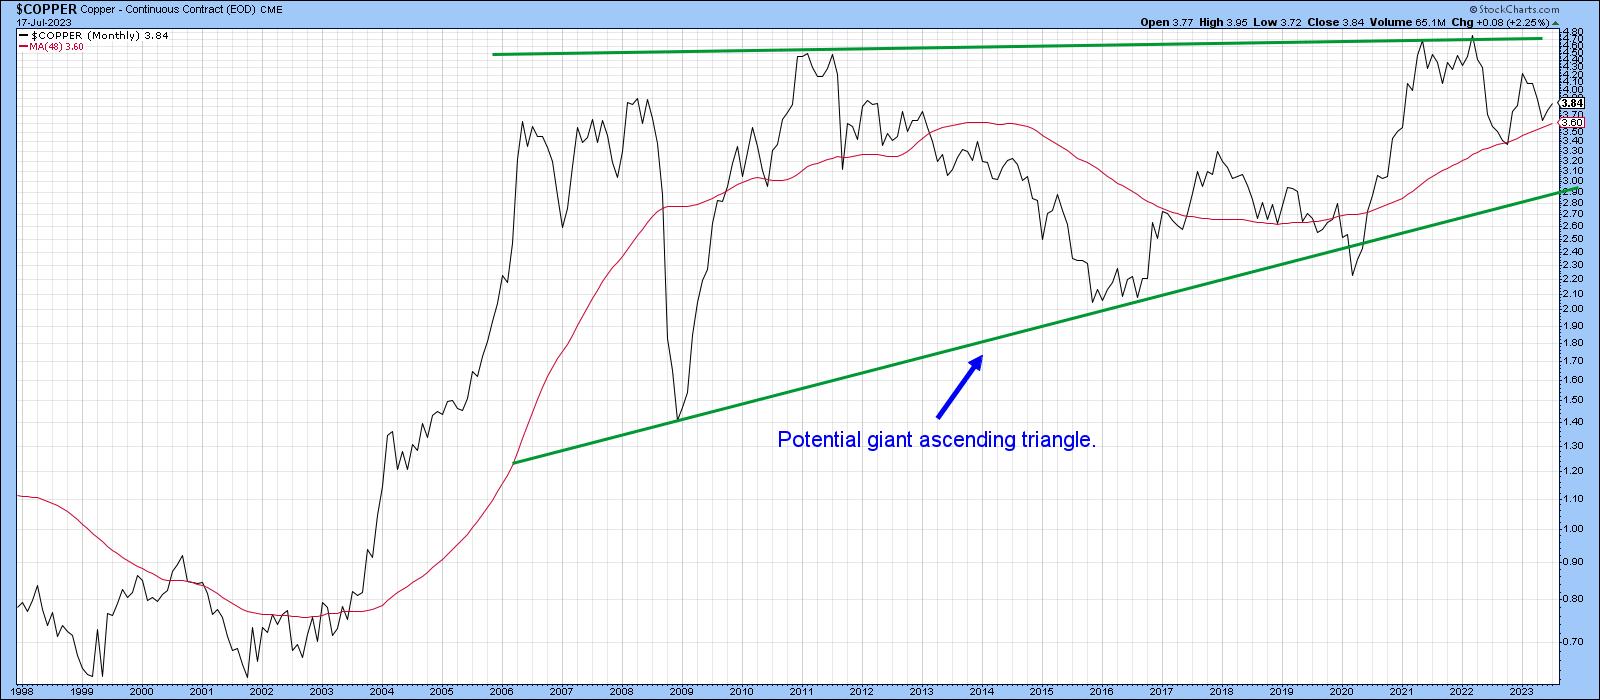
Chart 4 brings us back to earth, since the PPO has gone very quiet so far in 2023. The thick blue arrows indicate the three periods in the past when there was a similar tight balance between buyers and sellers, reflected by a subdued PPO. Each was followed by an explosive rally. That's not to say that the current battle is guaranteed to be resolved in a positive way. However, a PPO reading north of zero would certainly set the scene for one. Remember, any of the charts in this article can be updated by simply clicking on them.
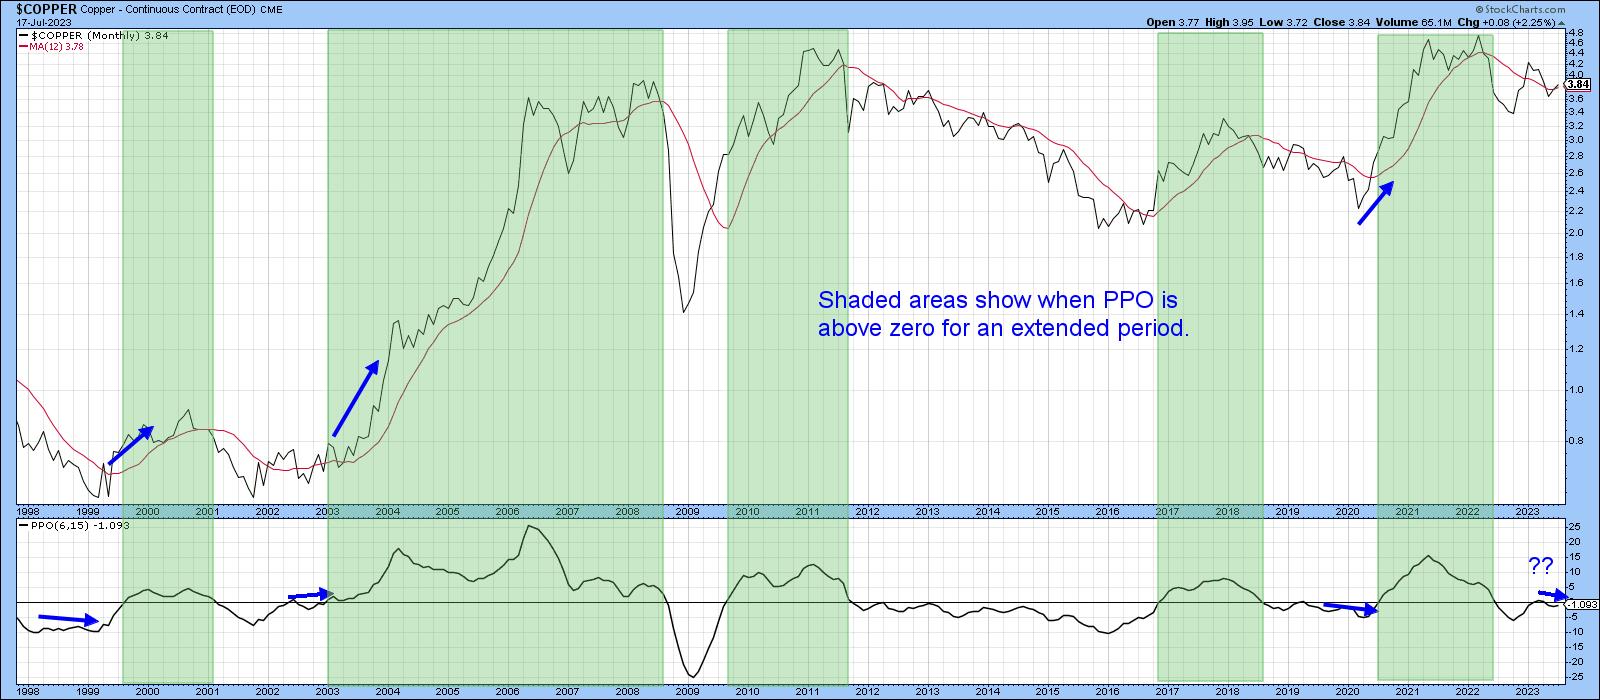
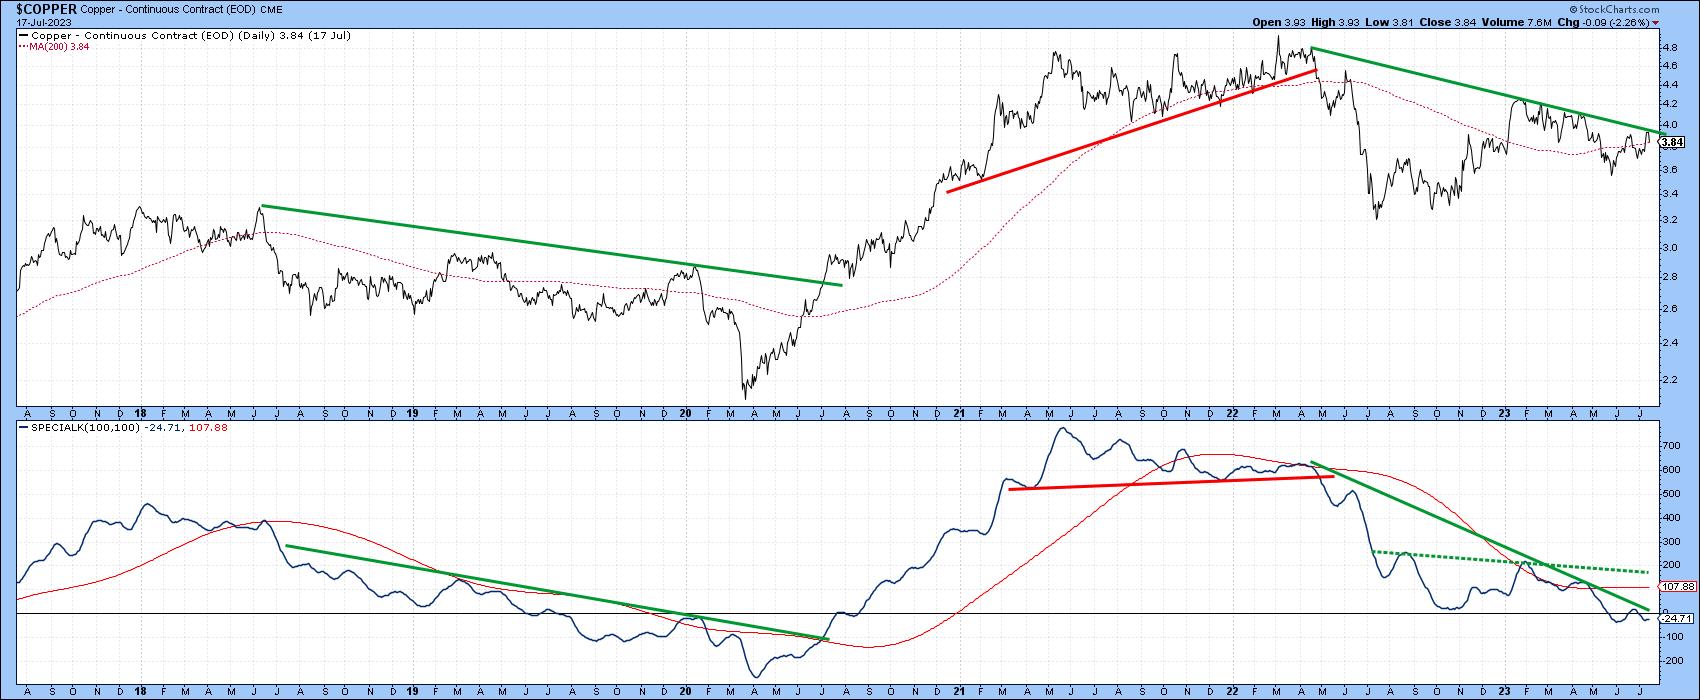
Chart 5 shows that the price could be very close to a major buy signal. That would come from a violation of the down trendlines for both the price and its Special K. Note how two previous trendline breaks for this momentum indicator were followed by an important reversal in the price itself. If you are not familiar with the Special K concept, you can read about it here.
Copper and Related Shares
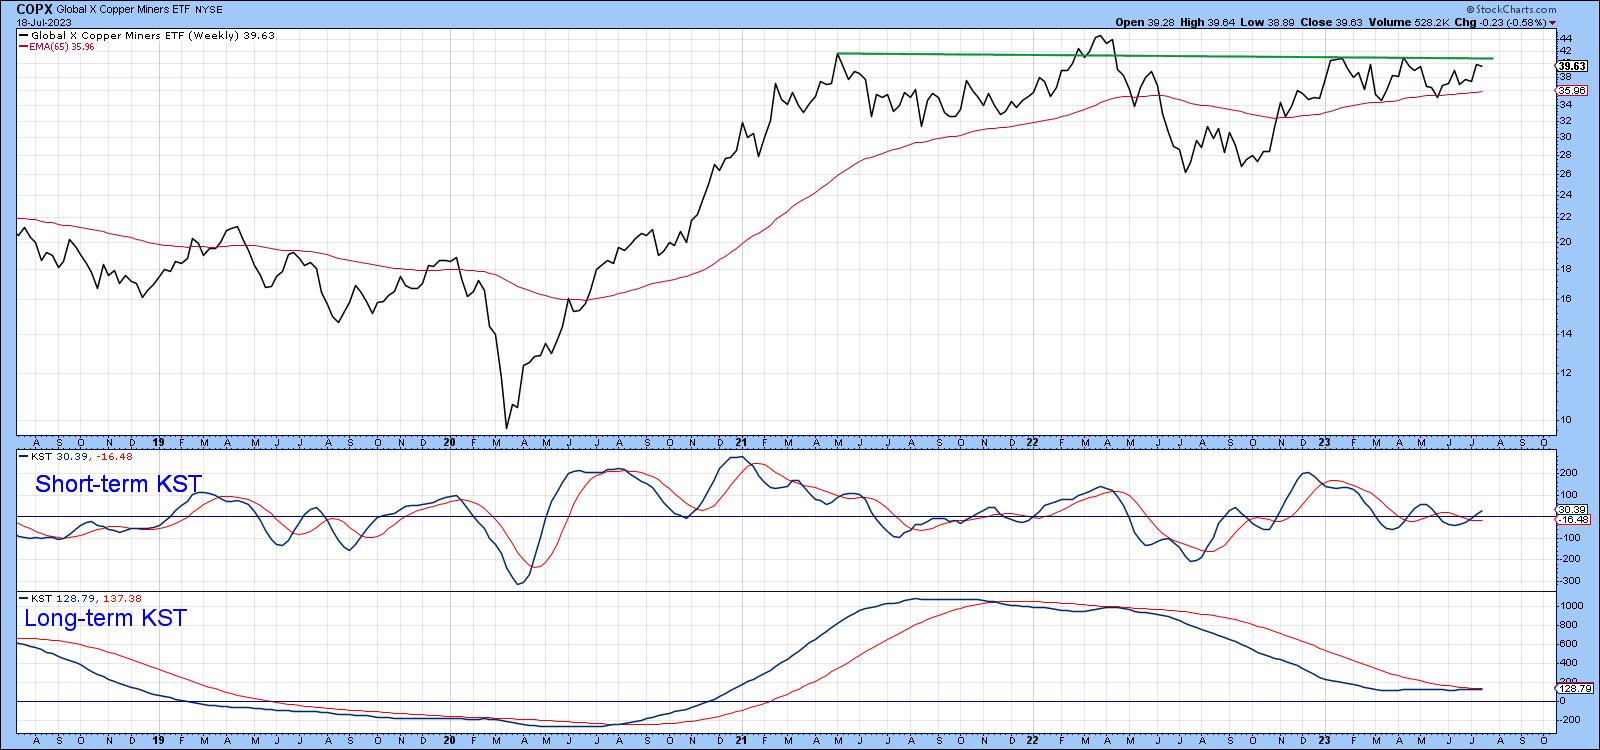
Most of the time, copper shares move closely with the copper price. Chart 6 features the Global X Copper Miners (COPX), where it is evident the price has been consolidating its 2020-21 gains for the last couple of years. If a genuine upside break materializes, that would represent a big boost in the fortunes of the metal itself. The bullish short-term KST suggests that a breakout may not be far away. If so, such action could involve the long-term KST crossing above its 26-week EMA. It's virtually there already.
Copper and Emerging Markets
A substantial number of emerging markets are sensitive to swings in commodity prices. We have already seen that copper leads or coincides with commodity prices, so it would be reasonable to suspect that there is a relationship between emerging markets and copper, other than the obvious direct connection with copper mining itself. This relationship is featured in Chart 7, where the copper price has been plotted in the upper window and the iShares Emerging Markets ETF (EEM) appears in the middle one. There may be a couple of obvious divergences between them, such as the copper double top formed between 2006 and 2008. However, pretty well every large price swing was experienced by both parties. Neither, for instance, has experienced any net gain since 2008.
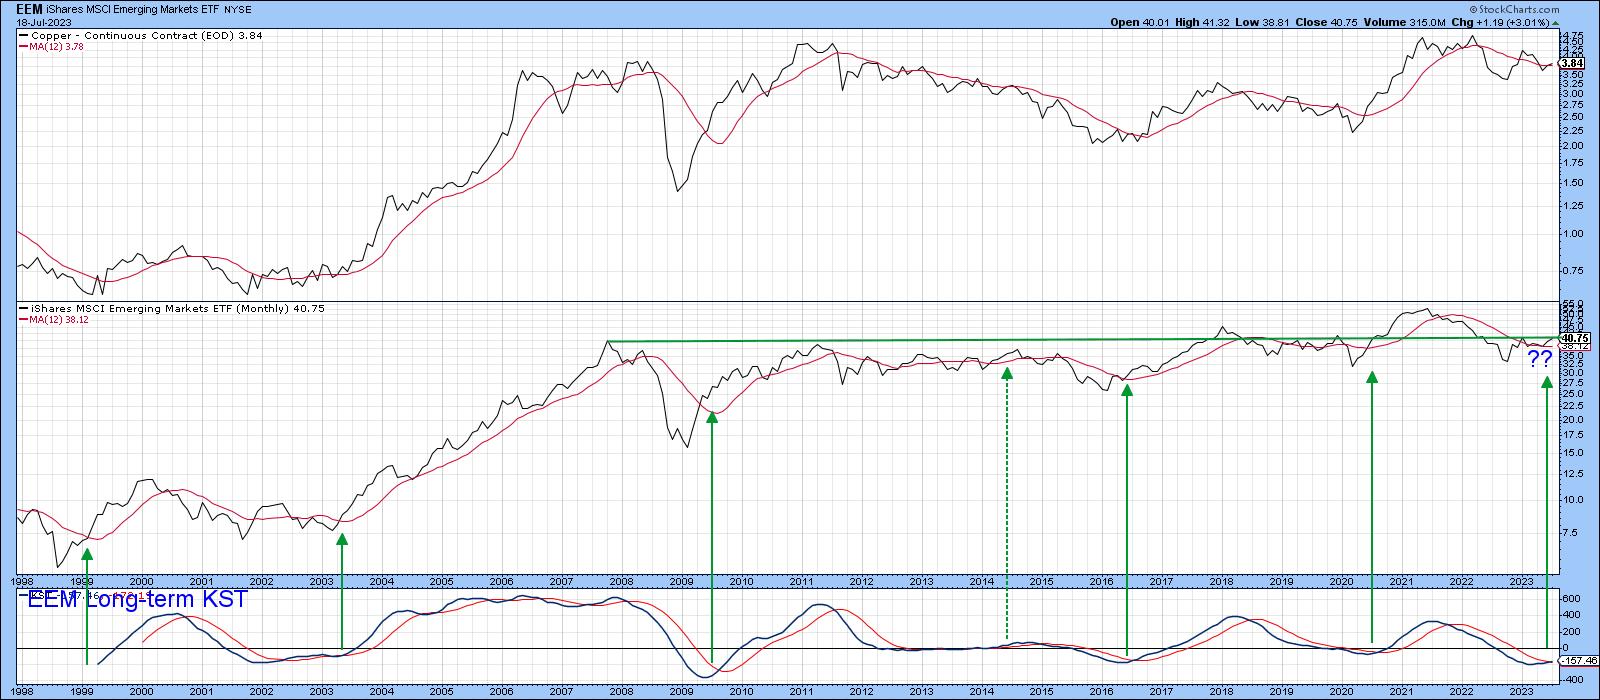
A key point here is that the EEM is poised to experience a major upside breakout, as it is above its 12-month MA and is experiencing a positive long-term KST. The green arrows indicate that such signals have usually been followed by a rally. Given the history between Dr. Copper and the EEM, is it likely that the copper price will not be far behind in the event that the EEM breaks above its multi-decade resistance trendline.
Good luck and good charting,
Martin J. Pring
The views expressed in this article are those of the author and do not necessarily reflect the position or opinion of Pring Turner Capital Groupof Walnut Creek or its affiliates.