The Banking Crisis is Over... Or Is It?
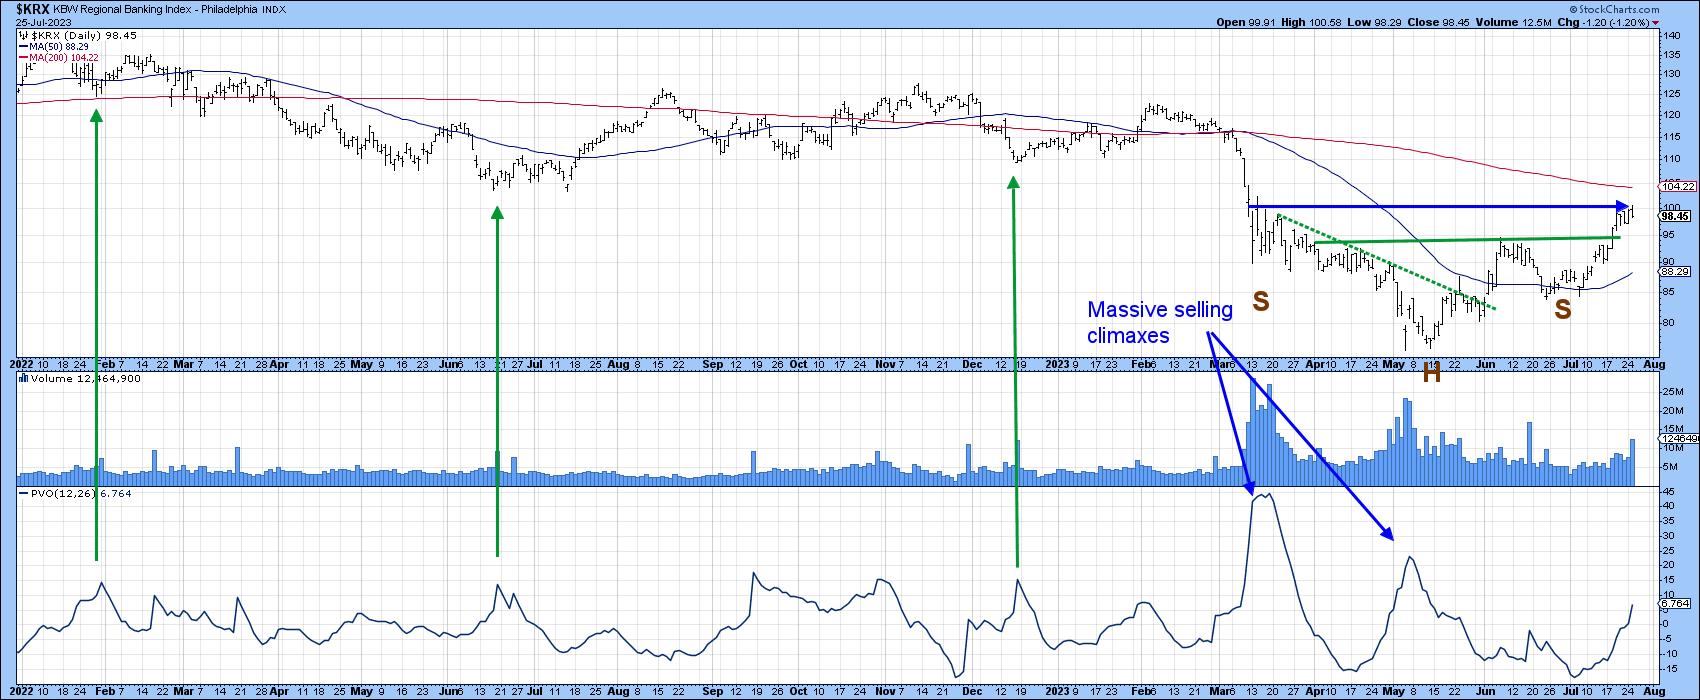
Last April, I wrote about the SVB (SVIB) banking crisis, using the KBW Regional Banking Index ($KRX) as a proxy, and suggested the price action in the right hand part of Chart 1 had the potential to be a double bottom formation. Double bottoms are characterized by heavy activity on the initial low, followed by a significant shrinkage of activity during the formation of the second one. In this instance, the extremely low level in the Price Volume Oscillator (PVO) during April was classic. "As with all things technical," I stated, "this is merely a suspicion until confirmed by some kind of trend confirmation. Ideally, that would be a break above the horizontal blue line, but an upside penetration of that smaller green down trendline would certainly help to stem any fears on my part of serious new lows being registered, and more likely lead to a spirited rally."

Chart 2 shows that it took some time until the green down trendline was successfully assaulted, as investors worried about another shoe dropping. In the meantime, a better indication of the completion of a bottom developed as the Index completed and broke out from a much larger pattern in the form of an inverse head-and-shoulders. Resistance is again apparent at that blue line, which suggests at least a temporary pause, but what are the possibilities of even higher ultimate prices?
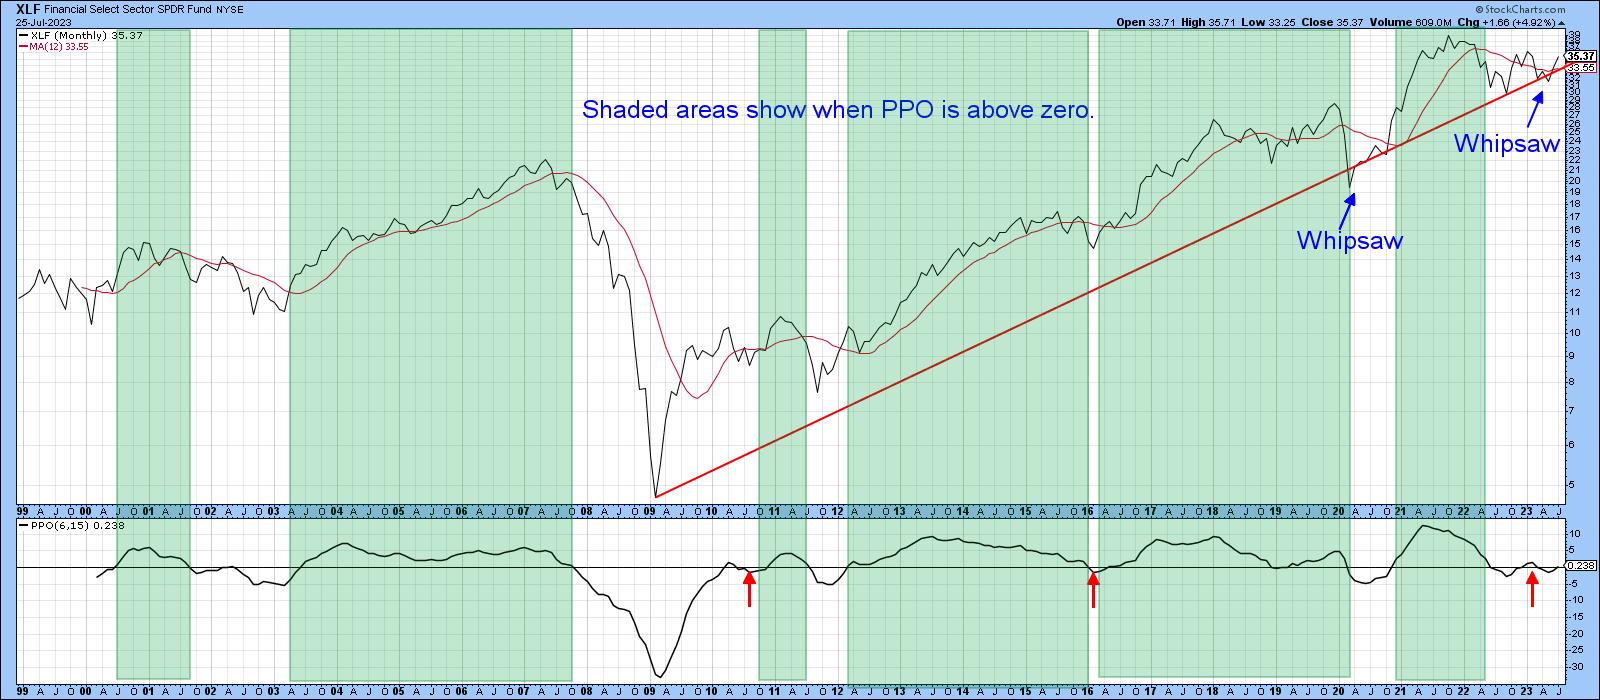
For this, we cast a wider net by taking a look at the longer-term picture for the SPDR Financial ETF itself, the XLF. One of my favorite long-term indicators for virtually any market is a monthly PPO calculated with the 6- and 15-month parameters. In that respect, the green shading in Chart 3 approximates periods where the PPO trades above its equilibrium level for an extended period. The small red arrows indicate that there have only been three false signals since the turn of the century. The latest plot indicates a very close call, as the oscillator is straddling zero. We will not know the final score until next Monday because the chart is based on monthly closes. However, with the price already trading above its 12-month MA, the odds are pretty high.
One reason for optimism comes from Chart 4, which compares the price of the XLF to its Coppock Curve. Normally, we use the Coppock to trigger buy signals when it drops below zero and turns up. In this case, though, the arrows flag positive 6-month MA crossovers. You can see that another signal was recently triggered, and it's likely to be a significant one. That's because it follows on the heels a possible false downside break of the secular up trendline. The power from the Coppock and should be enough push the price above its 2021-23 down trendline, thereby confirming the whipsaw break. I am not concluding that it will be as formidable a rally as that following the 2020 whipsaw; however, since false downside breaks are typically followed by above-average rallies, the XLF is likely to move significantly higher.
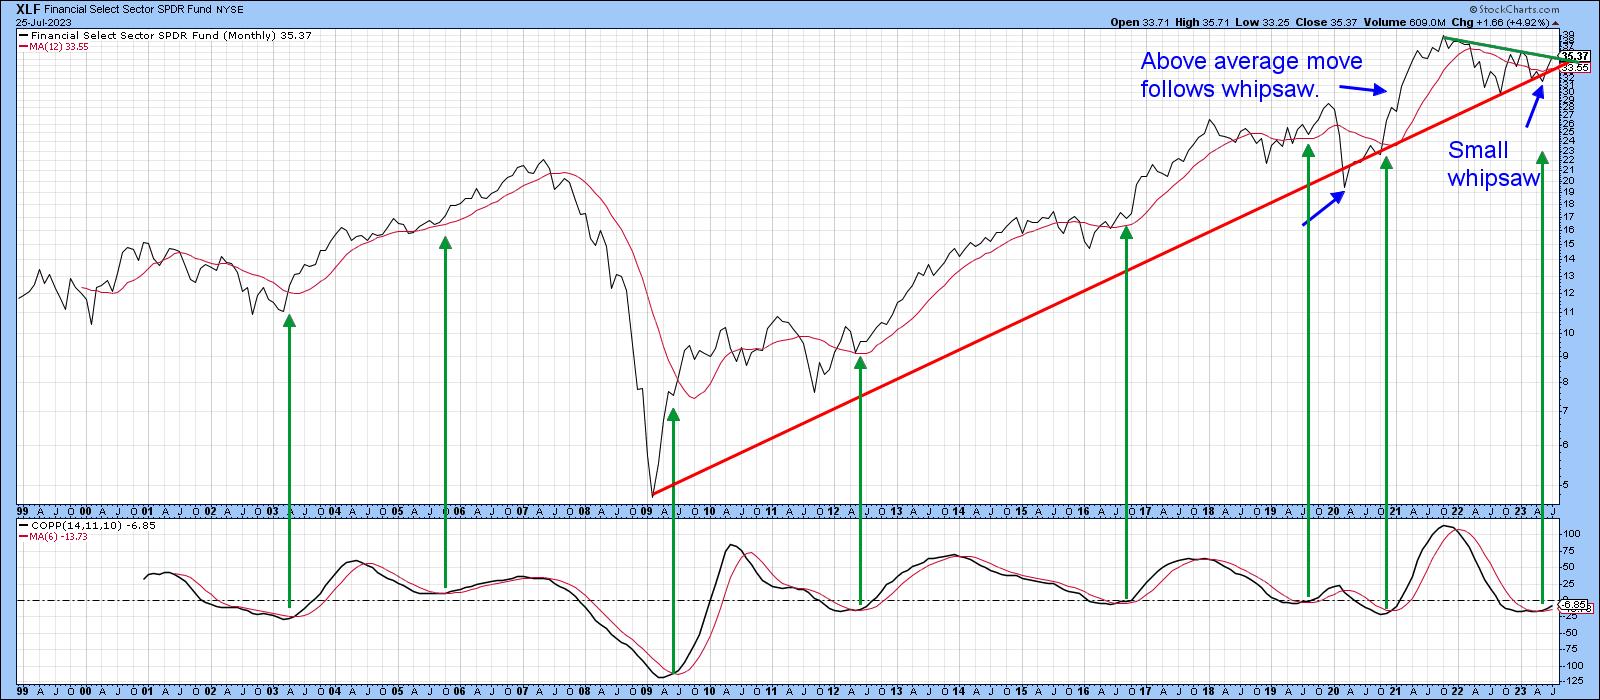
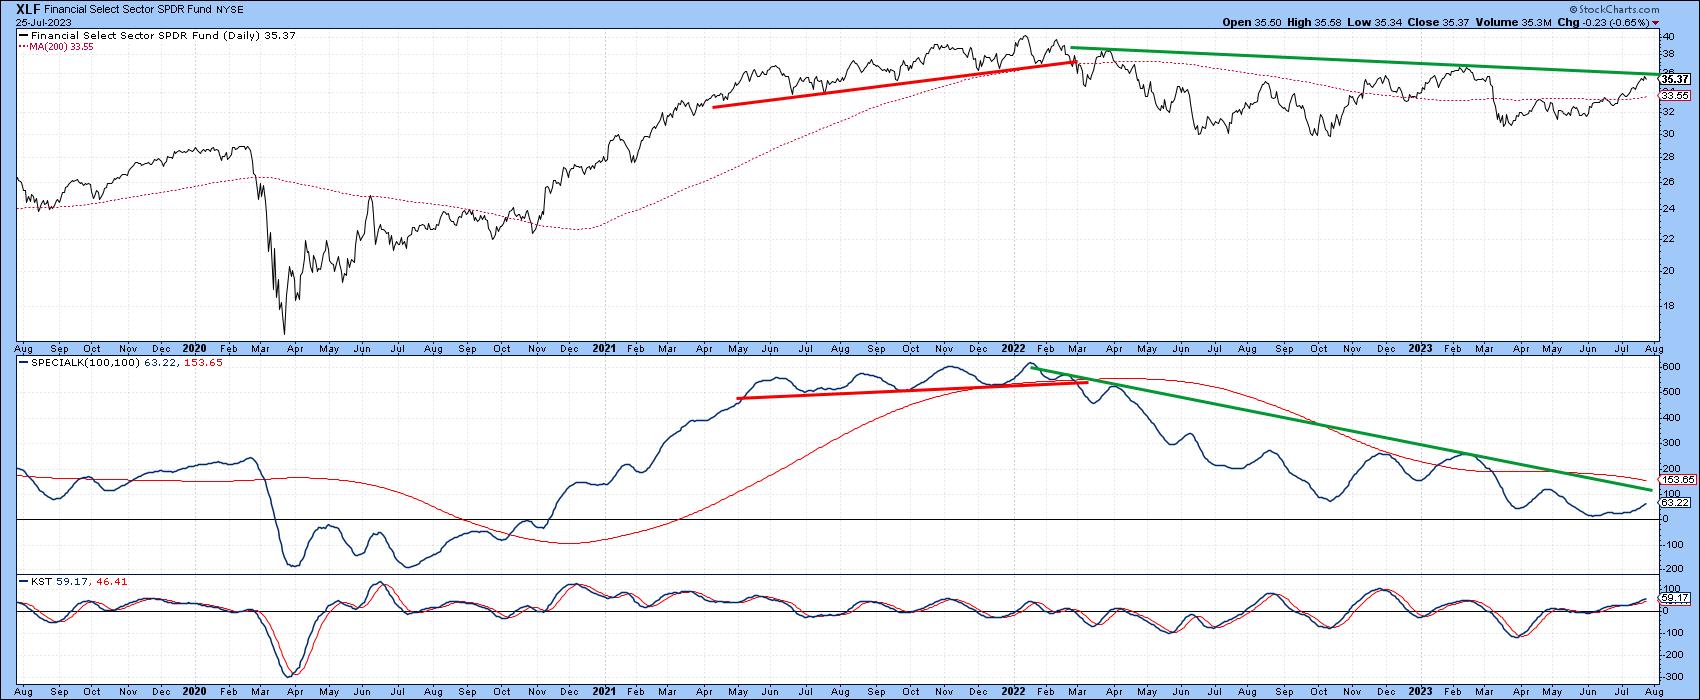
Chart 5 compares the financial ETF to its Special K indicator (SPK), which you can read about here.The SPK is still confined to a downtrend, since it is trading under its signal line and the green bear market trendline. The price itself is right at resistance in the form of the 2022-23 down trendline, so it would not take a lot of effort to go through. A rising daily KST in the bottom window says it's quite doable.
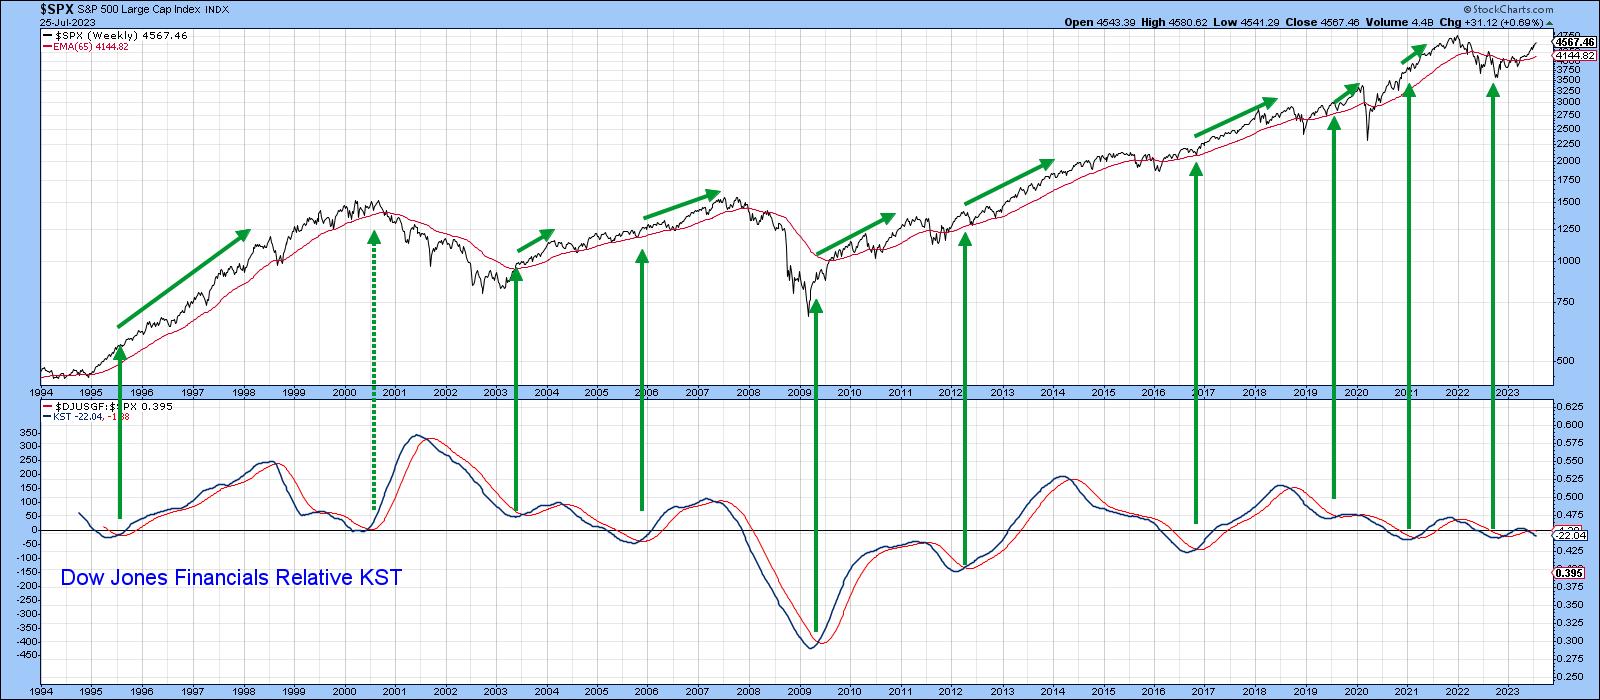
One thing I would like to see is the XLF out-perform the S&P. That's not because I have a particular affection for this sector, but the market usually rallies when financials are experiencing superior relative performance. Chart 6 demonstrates this principle. In this instance, the arrows indicate periods when the long-term KST for relative financial action is in a rising trend. The bad news is that the KST is currently in a declining mode. The good news is that it is around zero and does not require much strength to trigger an upside reversal. A declining relative KST does not mean the market will sell off, but it does take a positive technical relationship temporarily off the table.
Conclusion
The financial sector has recovered nicely from its spring malaise, but has reached a critical technical juncture. Some long-term indicators have already gone bullish, which suggests the banking crisis is over. However, a strong July close for the financial sector would go a long way to confirm that possibility.
Good luck and good charting,
Martin J. Pring


