Why Rising Short Rates Could be Bullish for Stocks
There has been a notable shift in expectations concerning rate hikes going forward, as several Fed spokesmen have floated the idea of additional hikes later in the year. Rising interest rates are generally seen as a negative factor for stocks, as they increase borrowing costs for companies, lowering their profitability and potentially dampening economic growth. In turn, this leads to a decrease in corporate earnings and valuations, resulting in an equity sell-off.
That said, there are also scenarios where rising rates could be viewed as a positive for stocks. For example, if interest rates rise due to a strong economy and improving fundamentals, it may point to a healthy business environment and higher earnings growth. Indeed, there are a number of leading economic indicators that have recently risen for several months, thereby suggesting that the coincident parts of the economy will soon follow suit.
Chart 1, for instance, compares the number of new homes sold to the S&P Composite. The housing data are too jagged to be of much use in stock market forecasting. However, when we consider KST buy signals derived from it, there are two consequences. First, new home sales have bottomed for the cycle; as this is a leading economic indicator, these reversals have implications for future economic growth. Second, since the stock market discounts the economy, timely buy signals are triggered when the long-term KST for new home sales goes bullish. These have been flagged with green arrows. This housing data bottomed around the turn of the year, suggesting that a recovery is already underway.
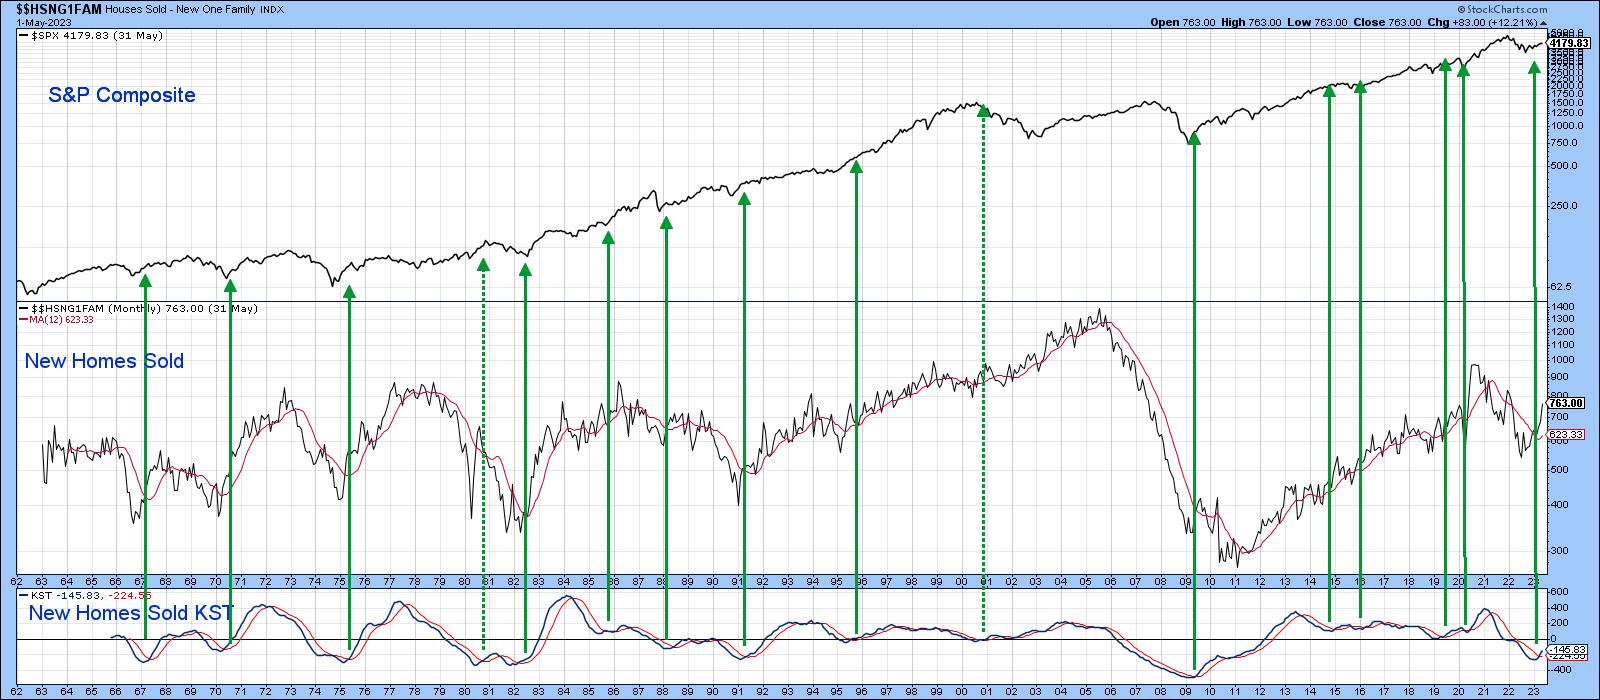
Positive stock market action since last October agrees, as stock prices have been factoring in a recovery for the last nine months. That equity rally has taken place under the backdrop of rising short-term rates. It's my expectation that as long as those rates continue to rally, and provided the S&P remains above its 12-month MA, it's safe to own stocks. When rates stop advancing, that will be a sign of a weakening economy. History shows that softening business activity, as reflected by a downward reversal in rates following a cyclical rise, has usually been bad for stocks initially.
In that respect, Charts 2 and 3 compare inflation-adjusted stocks to the Fed Funds rate between 1955 and 1983 and 1983 until the present respectively. The blue arrows demonstrate that stock prices usually, but certainly do not always, drop after rates have peaked. The worst damage appears to come when short-term rates peak and the S&P drops below its 12-month MA. Look at the 2000 and 2007 peaks in Chart 3, for example.
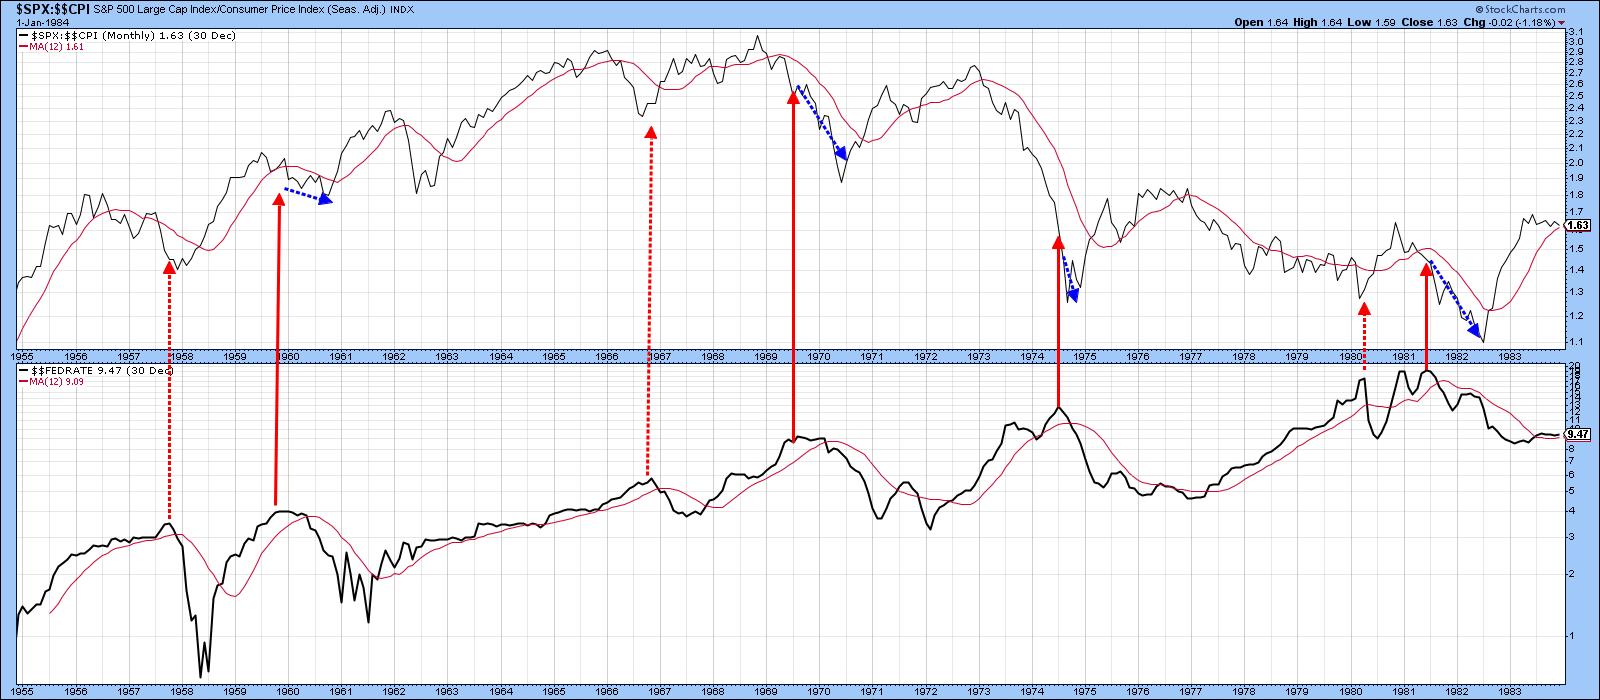
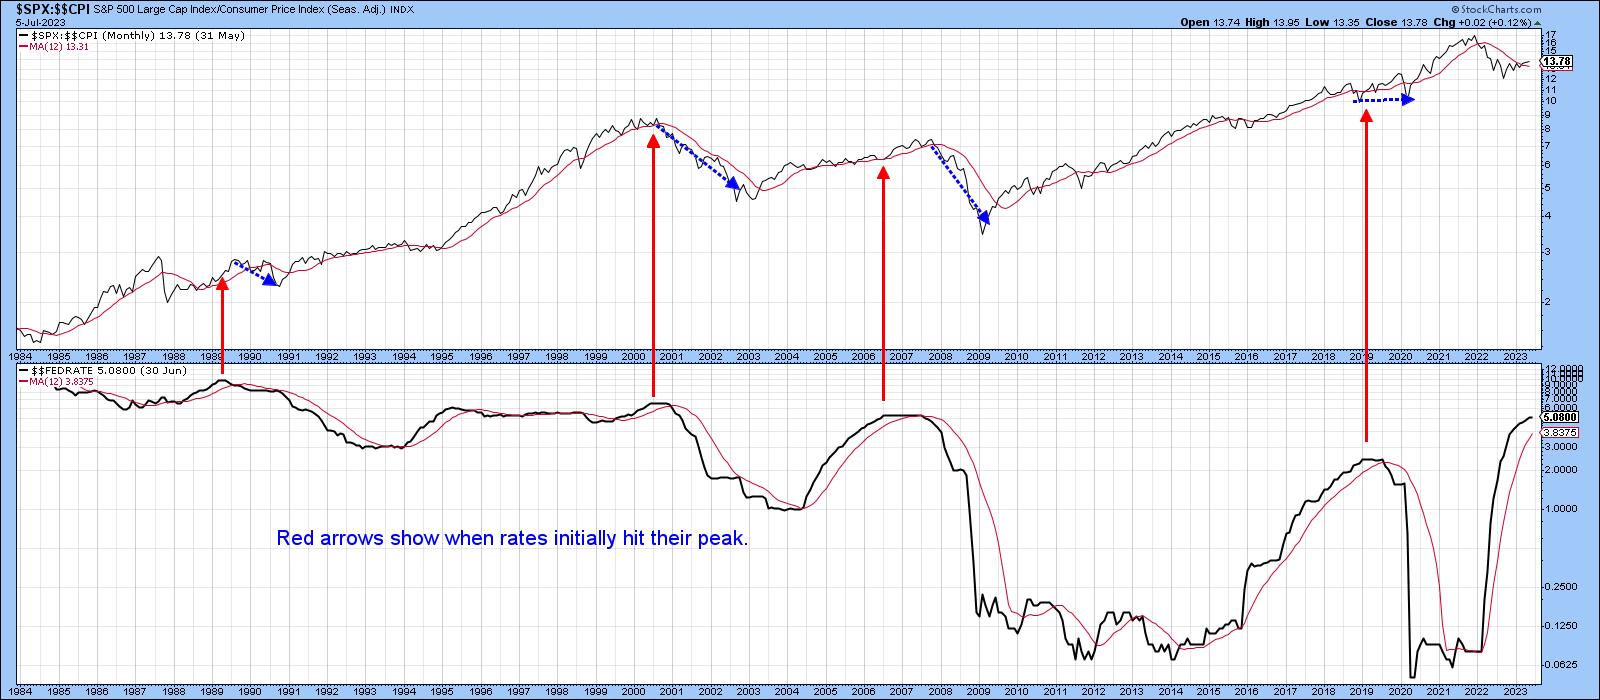
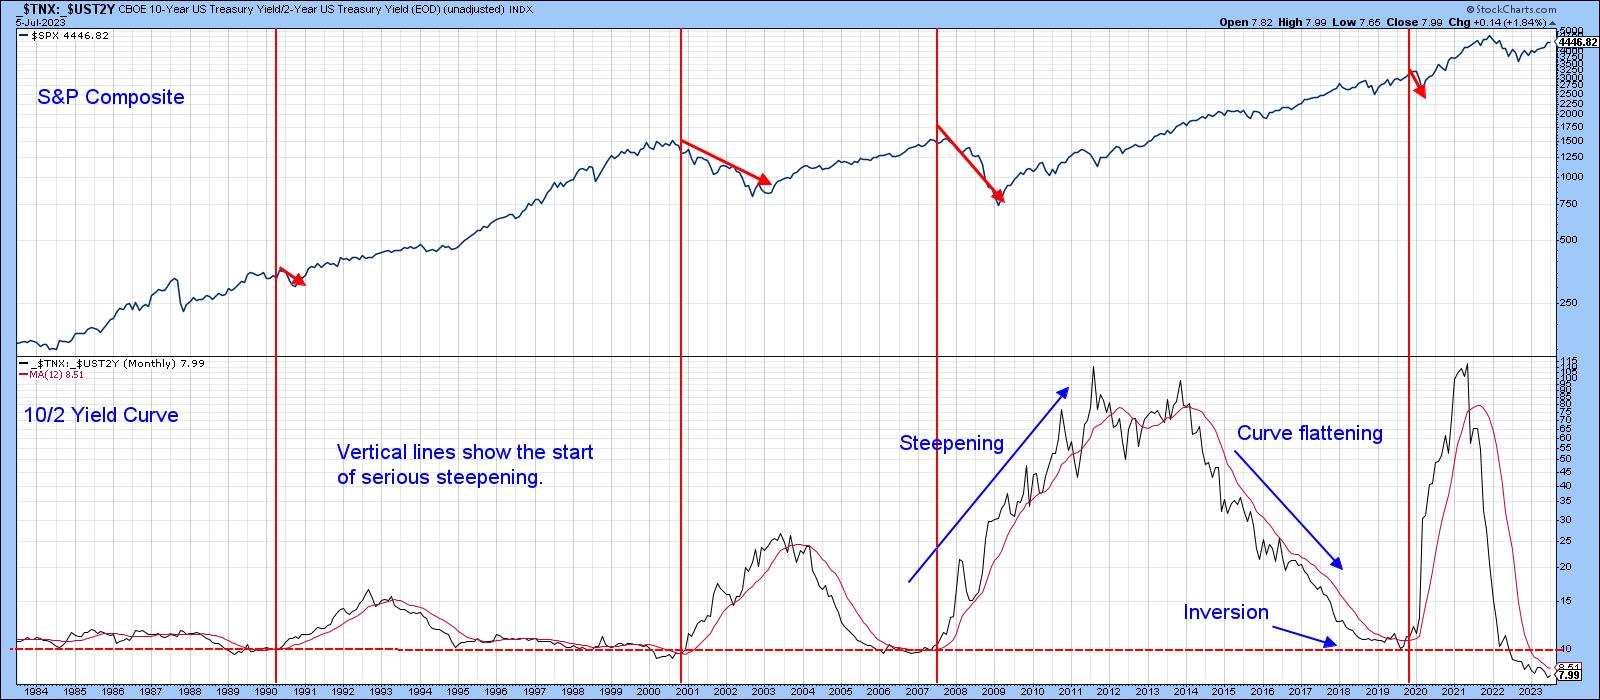
Chart 4 compares the 10/2 yield curve to the S&P Composite. The vertical lines reflect the approximate starting points of serious steepening in the curve. All are preceded by an inversion. Inversions develop when the 2-year series trades at a higher yield than its 10-year counterpart with a reading of less than 10.0. Such conditions are unusual and reflect tight money.
Reaching an inversion point. though, is not usually sufficient to trigger a bear market in equities. For that to happen. the tighter monetary policy needs to adversely affect the economy, or at least the market's perception of it. That process has shown up since 1990 by the curve starting to rise or "steepen" in a convincing manner. One way this can be objectively determined is to observe when the curve crosses above its (red) 12-month MA. At present, it is in a gentle downtrend and showing few signs of an upside reversal. History tells us that this condition is best maintained with a rising 2-year yield relative to its 10-year counterpart. In that way, rising rates, since they would be reflecting an improving economy, could still be positive for stocks.
Good luck and good trading,
Martin J. Pring
The views expressed in this article are those of the author and do not necessarily reflect the position or opinion of Pring Turner Capital Groupof Walnut Creek or its affiliates.


