The Dollar Index Goes to Missouri
The Dollar Index has experienced a nice rally since mid-July and now reached important resistance. It's time to show us whether it can push through, thereby signaling an important extension to the recent advance. Before we examine that possibility, however, let's briefly take a step backwards by way of perspective and assess the status of the secular and primary trends.
The Secular Trend
Chart 1 plots the Index on a quarterly basis, for which there are two basic takeaways. First, the quarterly Coppock Curve remains on its 2022 very long-term buy signal. The second point is the secular trend that began in 2008 is still intact, because the Index is above its up trendline and 36-quarter MA.
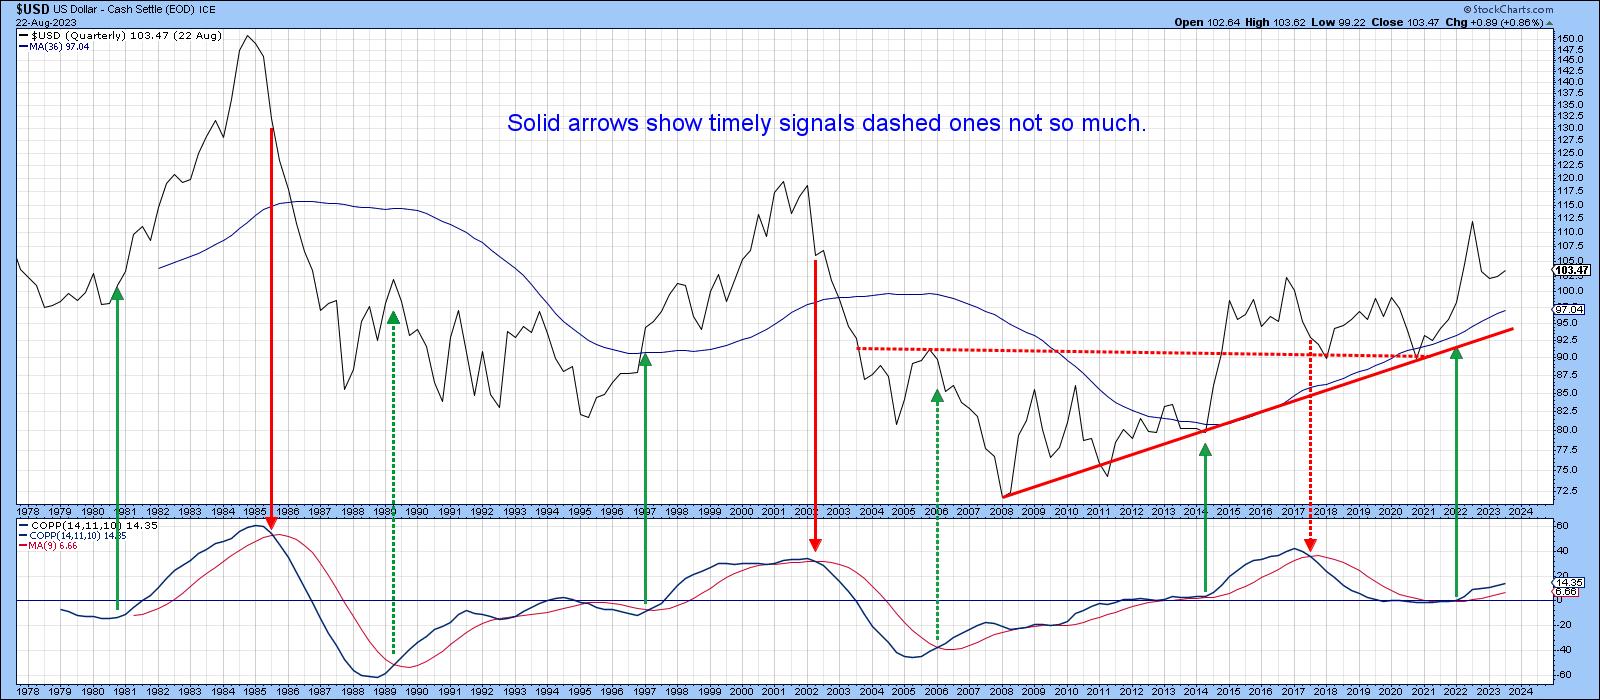
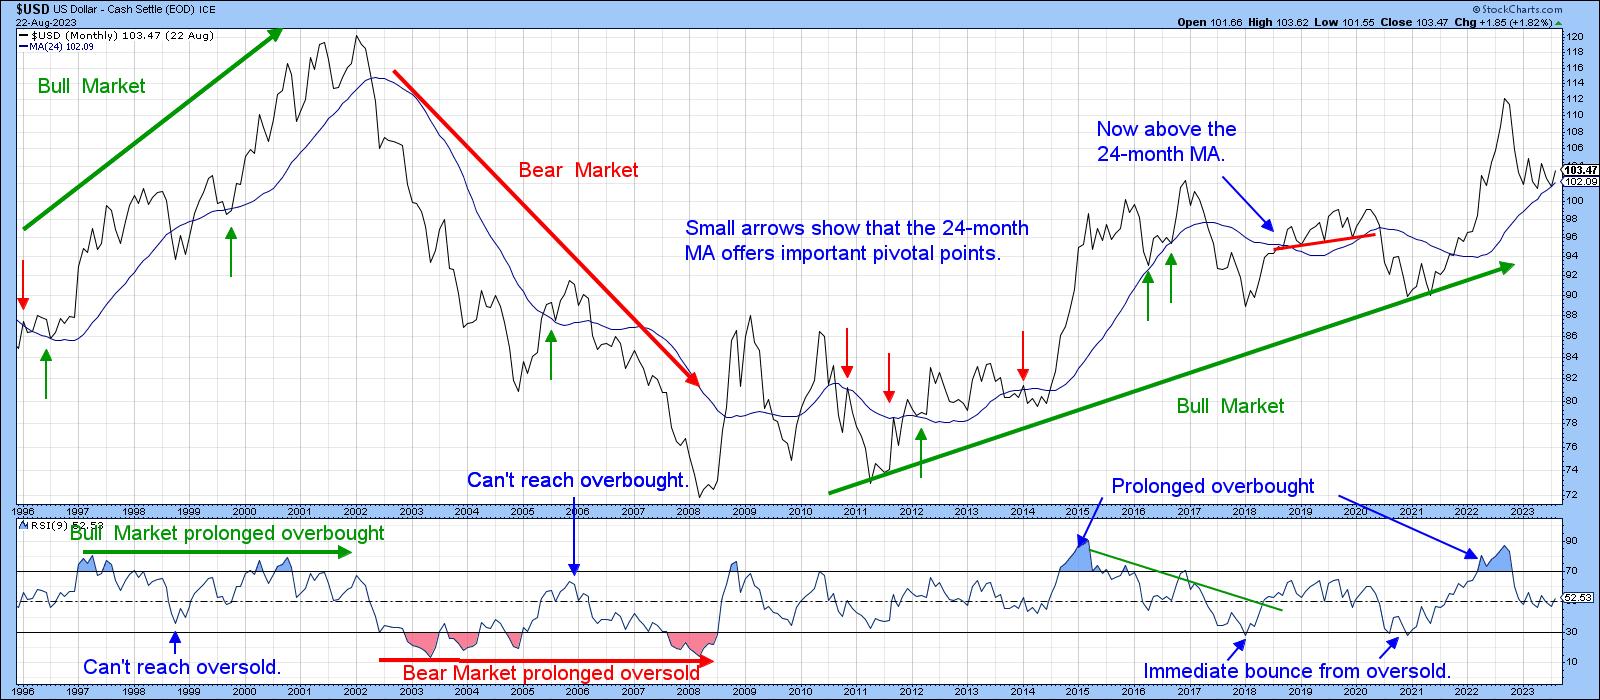
Chart 2 labels the three secular price movements that have taken place since the mid 1990s. We can see that RSI reflects the characteristics of them. For example, prolonged monthly overbought conditions are typical of a secular up trend, and long-lasting oversold readings typify the bears. By the same token, when the trend is up, prices tend to be super-sensitive to an oversold condition and, when down, to an overbought one. Those characteristics have been consistent with RSI action during the post-2008 period. Finally, the Index has managed to hold above its 24-month MA, which the small arrows show to be an important support/resistance pivot point. Not much doubt that the secular trend is up, but what of the primary one?
Primary Trend
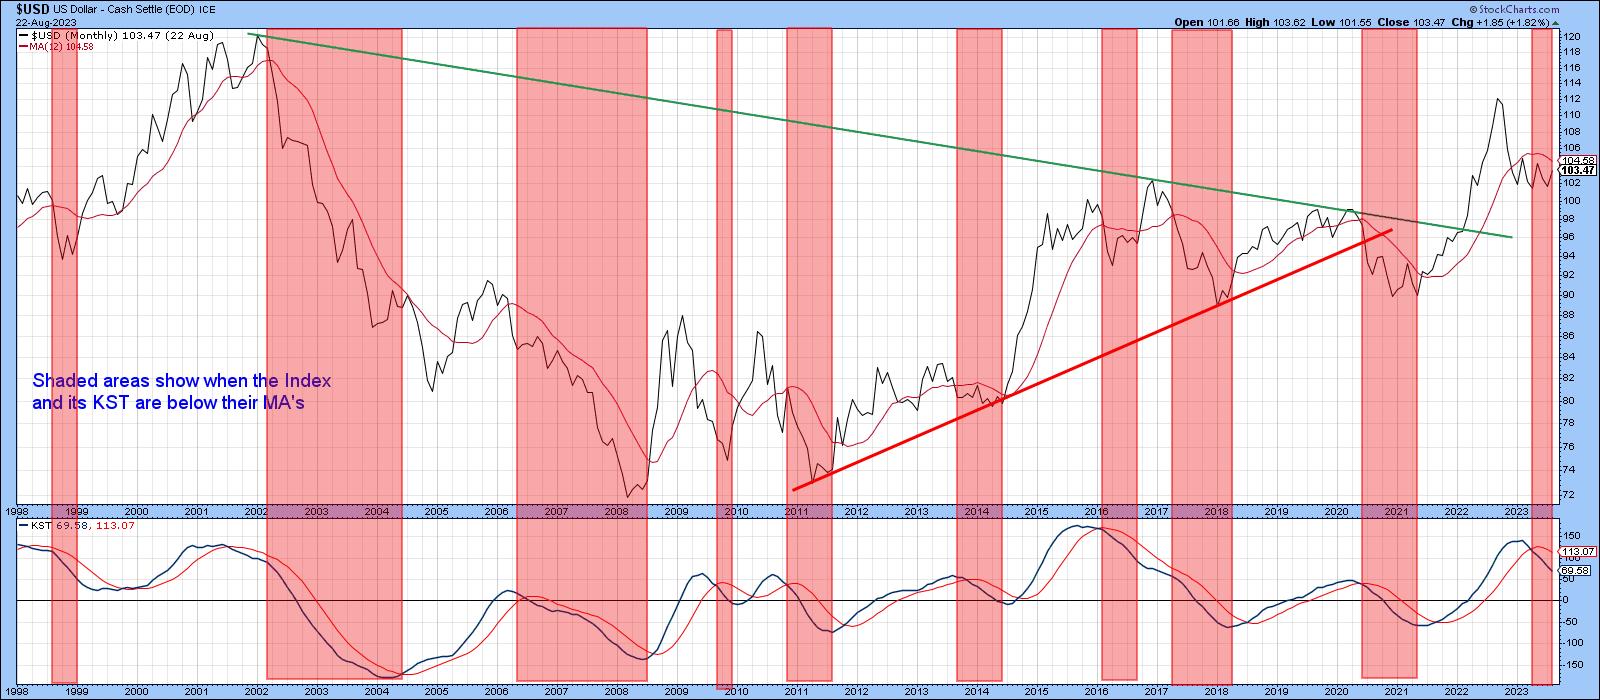
Chart 3 compares the Index to its long-term KST. Red shadings appear when both series are below their moving averages. The bad news is that this model is currently bearish. The good news is that counter-secular bear markets, which is what this one is, tend to be mild in terms of both magnitude and duration. This characteristic holds out the possibility that the worst may be over. That's not to say that prices will run away on the upside, because the long-term KST still needs to work off its overbought condition. A trading range environment could well evolve first. That's an idea I first put out in an article last May.
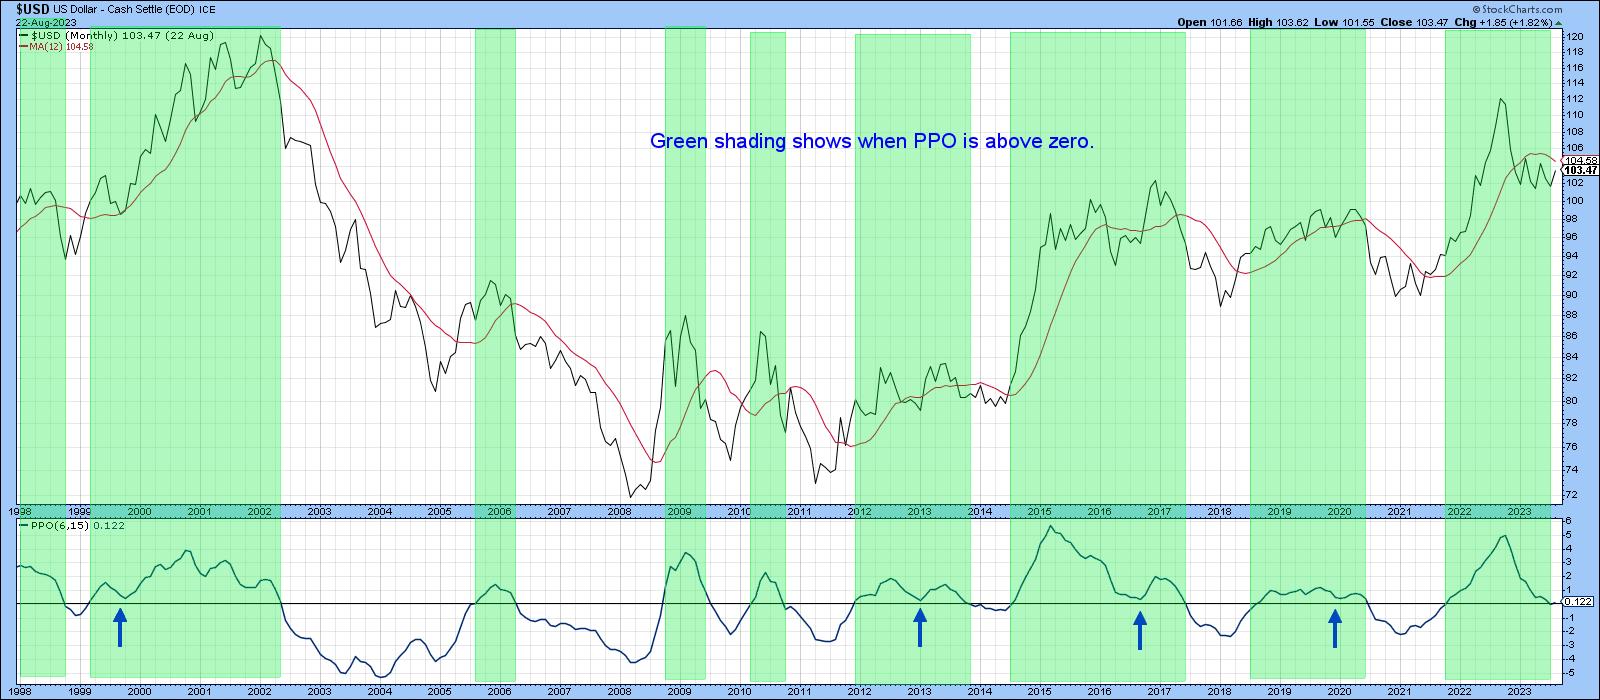
If that is going to happen, Chart 4 will need to turn more bullish. The green shadings approximate periods when the PPO is above zero, and the small blue arrows instances where the indicator reversed to the upside from a position just above zero. This approach is occasionally a bit late in triggering sell signals. However, one of its principal advantages is that it returns very few whipsaws. The preliminary August plot shows the PPO to be fractionally above zero, which makes the model bullish. However, since it could easily move in either direction, more decisive action is needed before we can say with any degree of confidence that a sell signal has been avoided.
Short-Term Position
The Index is trying hard to break above the 2022-23 resistance trend line and 200-day MA. If it can, that would be an important development, because it would confirm that the July downside break was false. False breaks are often followed by above-average moves in the opposite direction, as traders scramble to get back to the right side of the market. At the moment, the tentative upside break is being supported by a bullish currency diffusion indicator and a rising KST. The red arrows show that the KST usually leads the diffusion series. Since it is still rising and the diffusion indicator is not overextended, a penetration of the line is likely. If so, the recent violation of the diffusion indicator down trendline would add to the positive evidence.
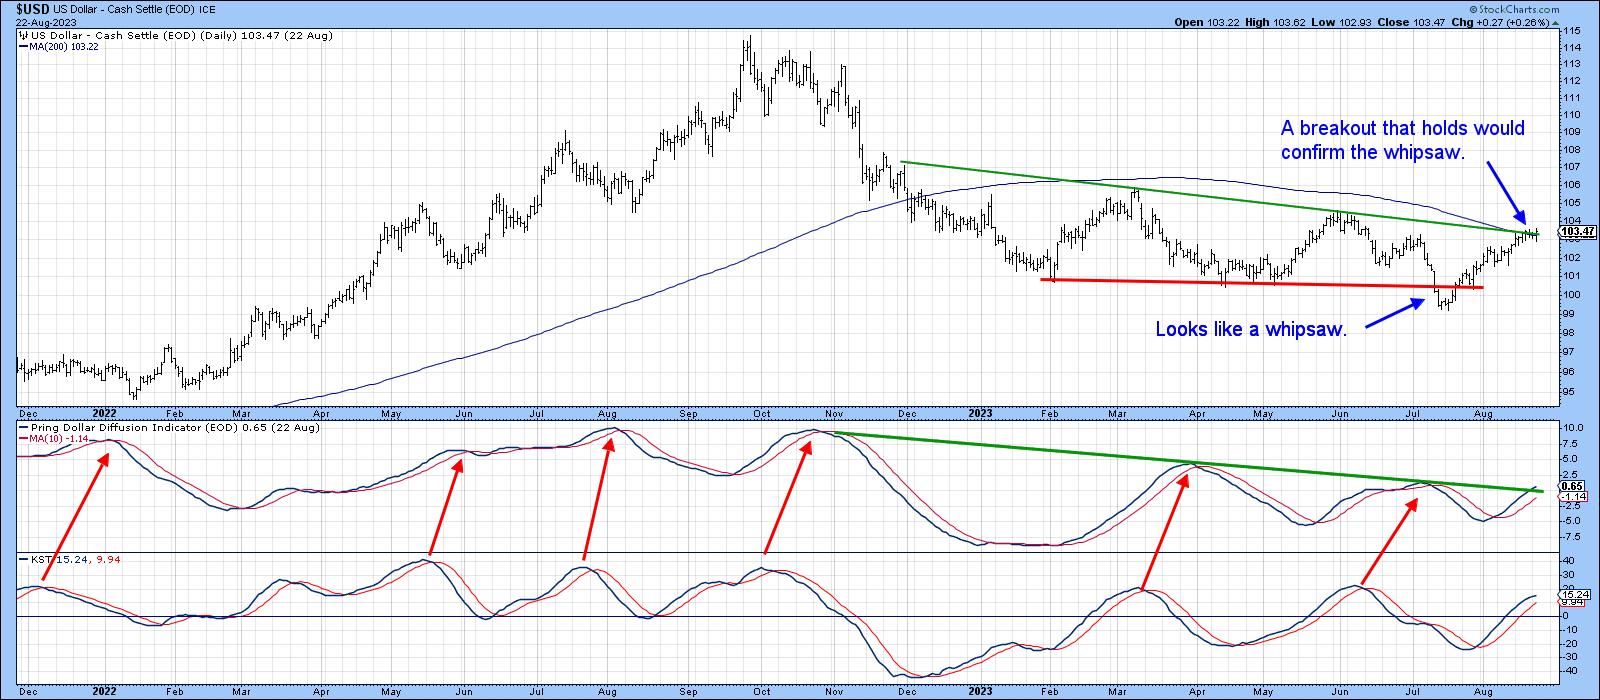
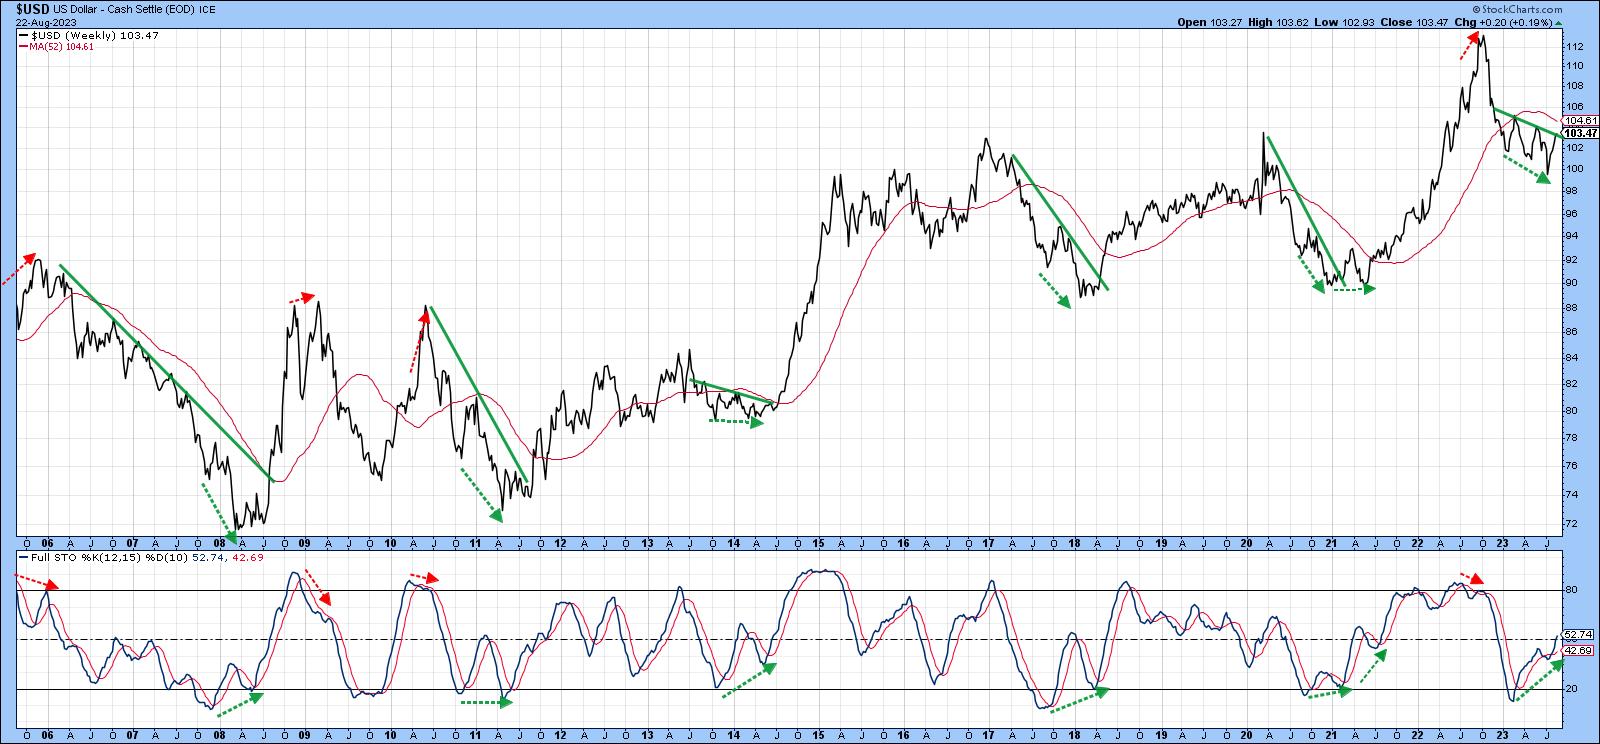
Chart 6 also offers a bullish undertow, as the stochastic indicator has once again experienced a positive divergence, its sixth one since 2008. Once the others were confirmed with a successful down trendline violation, a nice dollar rally followed.
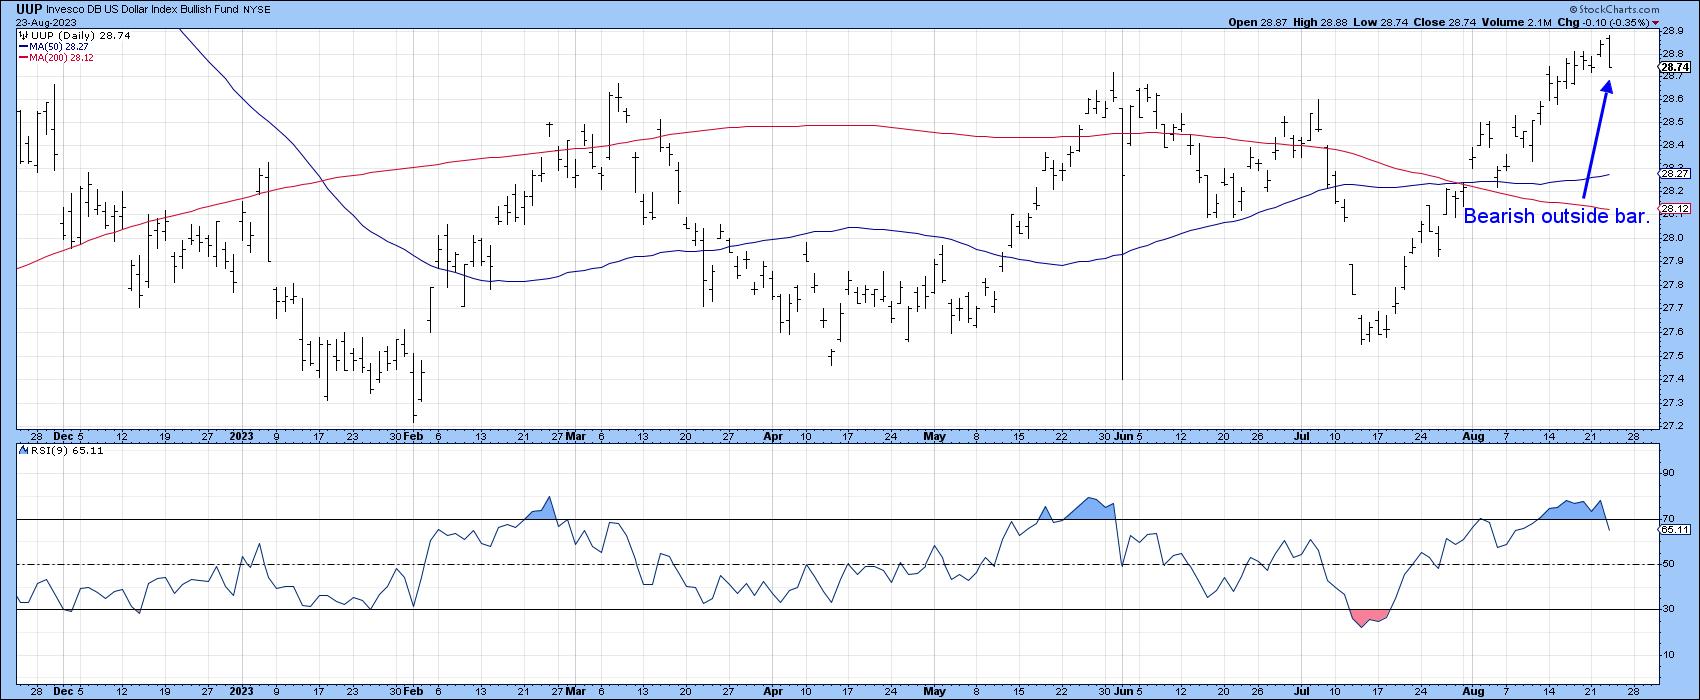
Will it happen again with the current setup? Probably so, once the Index has experienced a near-term digestion of post July gains. That seems likely, as the Invesco US Dollar Bullish Fund (UUP) experienced a short-term bearish outside bar on Wednesday. In the meantime, show me, I am from Missouri!
Good luck and good charting,
Martin J. Pring
The views expressed in this article are those of the author and do not necessarily reflect the position or opinion of Pring Turner Capital Groupof Walnut Creek or its affiliates.


