Some Investment Implications for Stage 3 of the Business Cycle
The business cycle has been with us for as long as reliable financial records have been available, and that's at least 200 years. It may seem to be a mysterious force, but it is nothing more than a set sequence of chronological events that just keeps repeating. The most prominent recognition of the sequence comes from the Conference Board, which publishes composite indicators reflecting sectors that lead, coincide, or lag "the" economy.
Fortunately for investors, the primary turning points for bonds, stocks, and commodities fall into this sequential approach, making it possible to construct a map which can be used for the purpose of improving the asset allocation process. In that respect, the bell curve in Figure 1 represents the growth path of the economy, and the letters B, S, and C the idealized turning points of bonds, stocks and commodities.
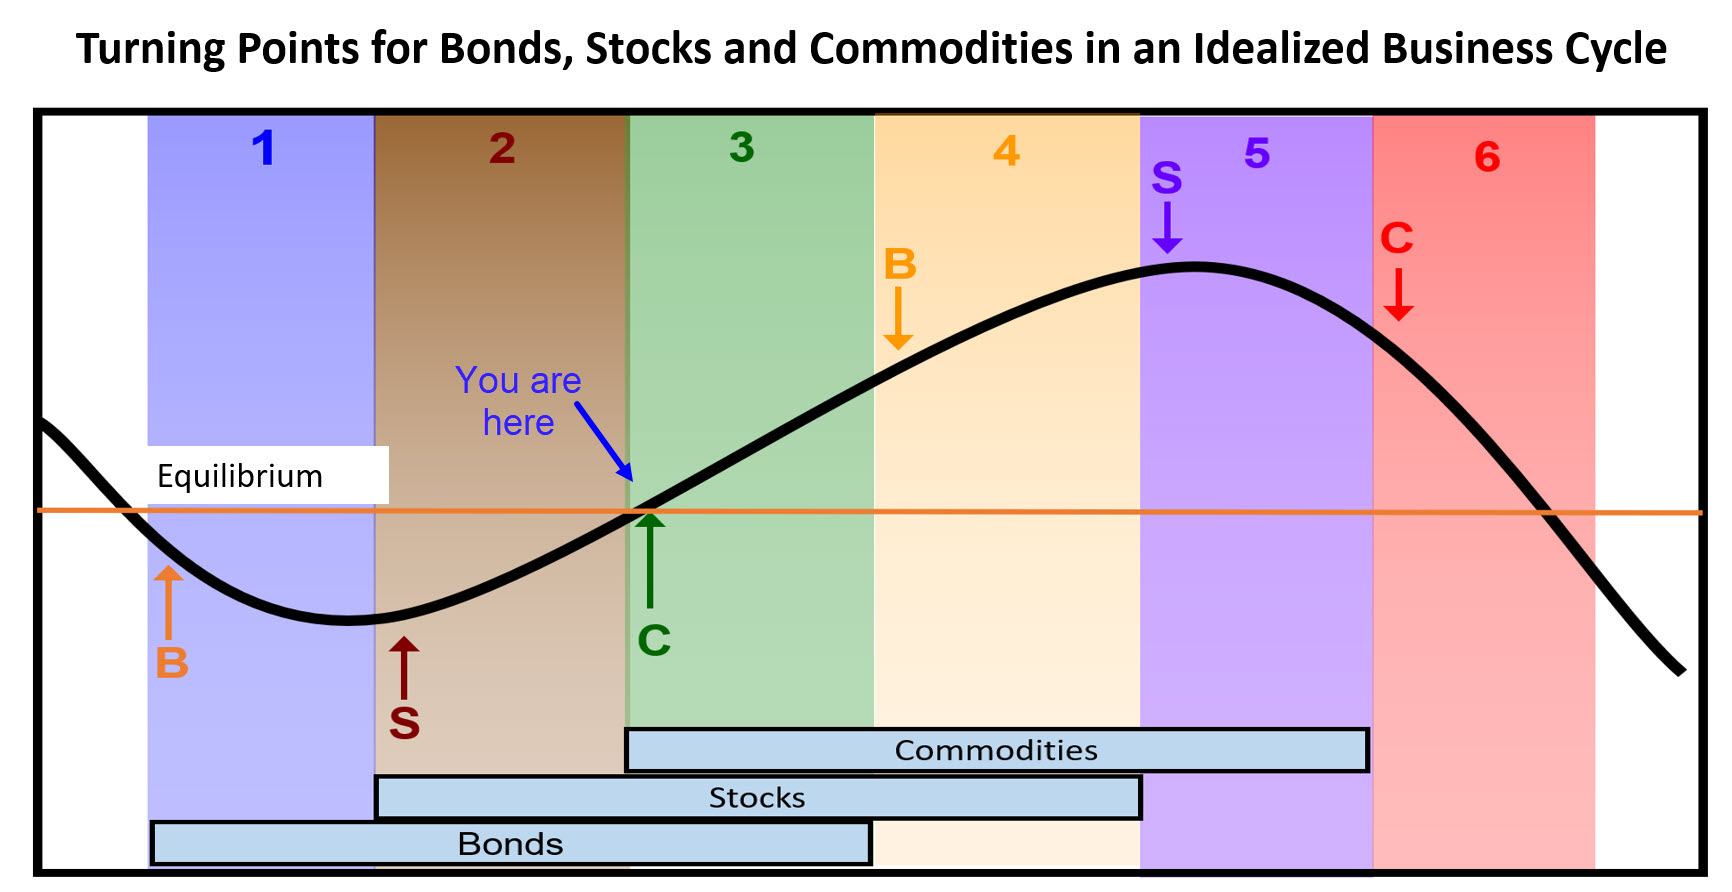
The three rectangles in the lower part of the figure tell us when each asset class is in a bull market. In the real world, these turning points are not equally spaced and occasionally fall out of sequence, which makes this approach, which you can read about here, far more an art than a science. The phases or stages of the cycle are represented by the numbers 1-6 at the top of the figure. The various stages are identified by three models or barometers which are published in my monthlyIntermarket Review. July saw the commodity model join bonds and stocks in the bullish camp placing the cycle in a Stage 3.
Since the 1950s, the average annualized monthly return in this phase of the cycle has been 11% for stocks and 7% for commodities. Favored sectors have been semiconductors and financials, in the form of insurance companies and brokers. They are not the best performers inevery cycle, so a policy of "trust and verify" is very much called for. In other words, trust that semiconductors are a favored Stage 3 performer, but verify that their technical position in the current cycle is also positive.
Copper Could Hold the Key
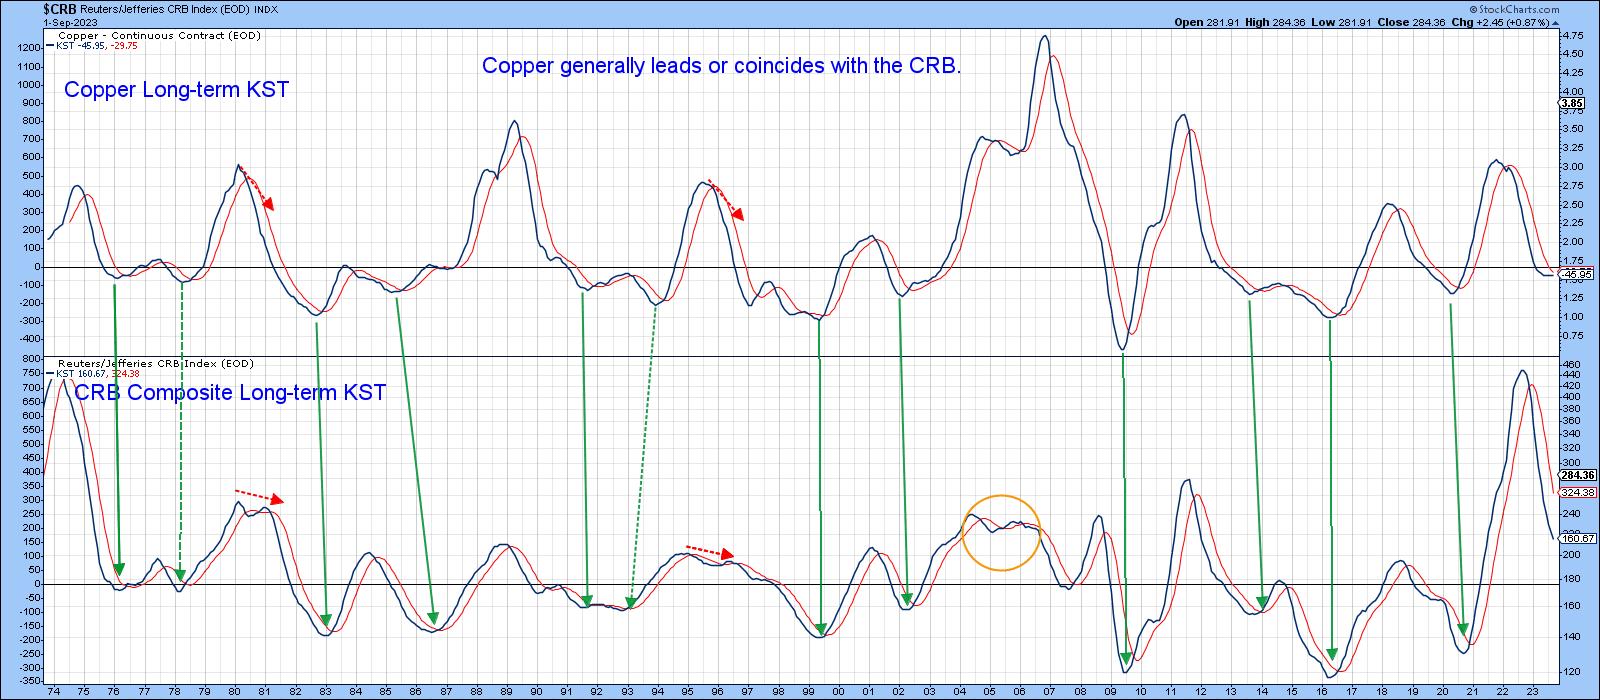
Stage 3 favors silver (9%) and crude (15%), but I am going to focus on copper (9%), which has a tendency to lead the CRB Composite. This can be appreciated from Chart 1, where the long-term KST for the red metal tends to bottom ahead of that for the CRB. The chart also shows that the copper KST looks as if it is just about to cross its MA for a primary trend momentum buy signal.
That's important because copper closely tracks major movements in the Dow Jones World Basic Industry Index. That series looks as if it may be close to experiencing a major upside breakout above a 15-year resistance trendline. The implication would be for significant new all-time highs in global basic industry or materials stocks. It's also possible that the next primary rally in copper itself might achieve a similar objective. Note how the World Index KST could be about to go bullish, just like the copper KST in the previous chart.
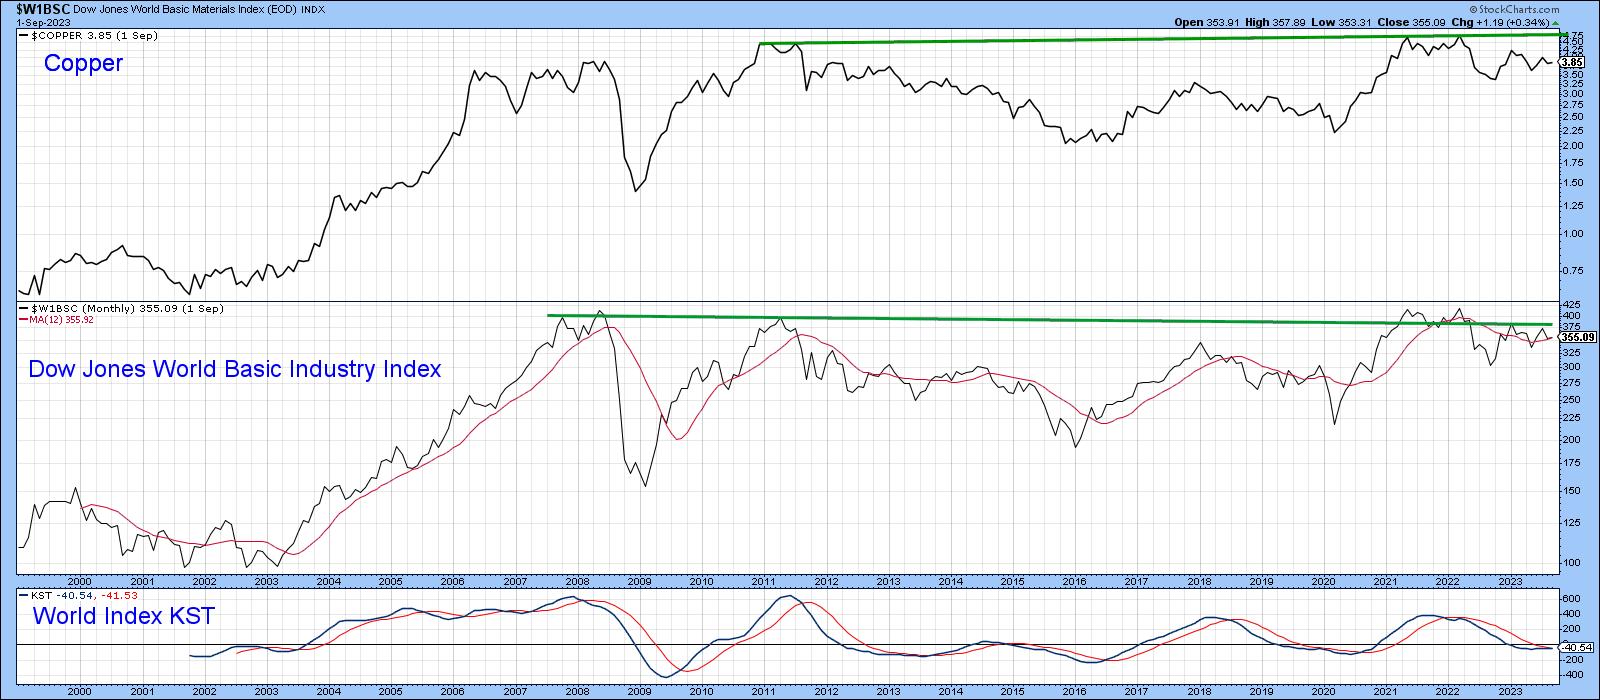
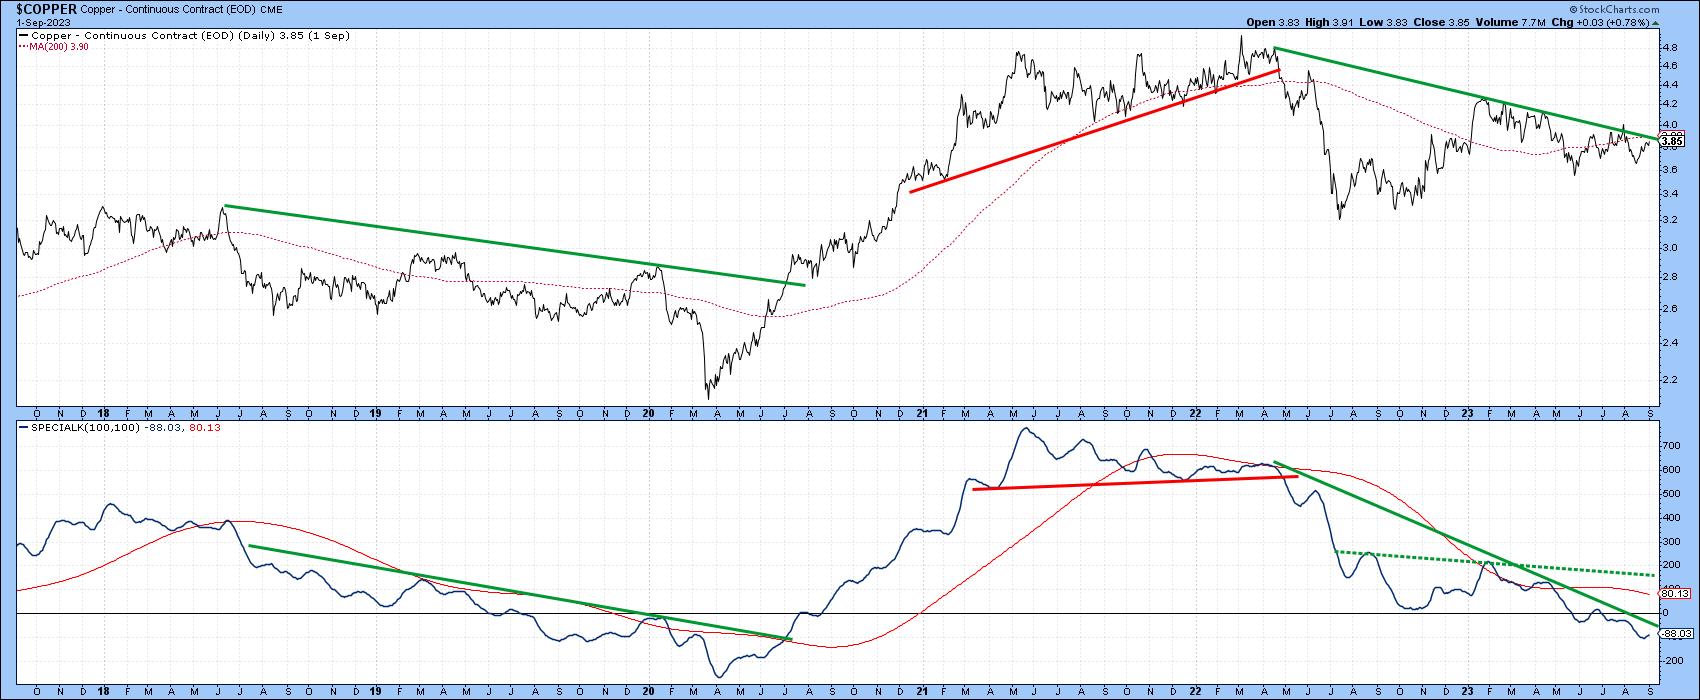
Chart 3 shows how close copper is to an important buy signal, as it is right at its 2022-23 bear trendline. The Special K is also in a similar position. Two examples of a similar setups are featured in the chart; both were followed by important moves.
Two Beneficiaries of Higher Copper Prices
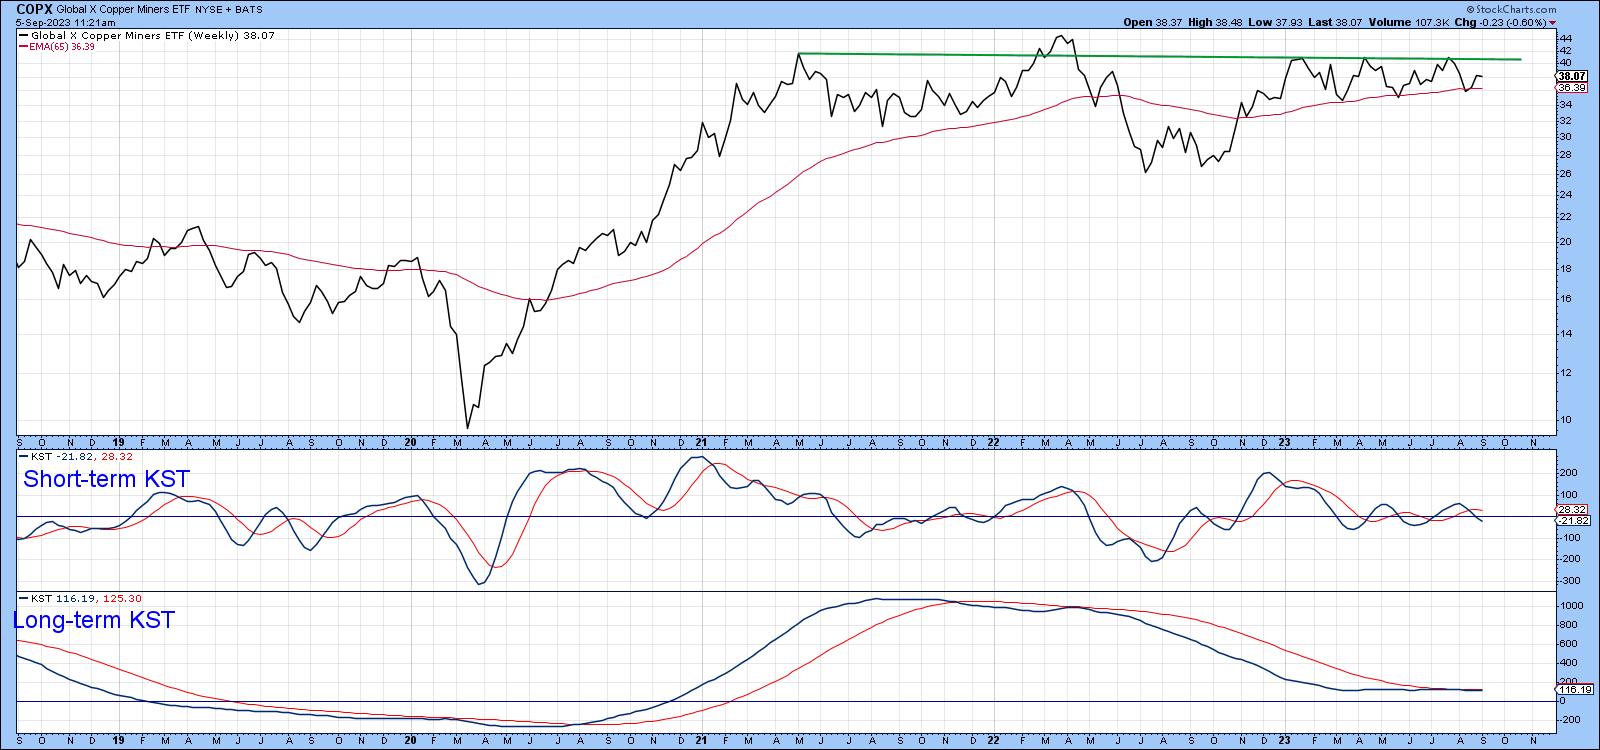
One obvious beneficiary of firming prices would be copper miners. In that respect, Chart 4 demonstrates that the Global X Copper Miners ETF (COPX) has been rangebound since 2021. It has held up much better than the price, which is a positive sign. However, it is experiencing a negative short-term KST at the moment, a factor that is likely to delay any breakout. That said, an upside breakout from the recent trading range would likely push the finely balanced long-term KST into a bullish mode.
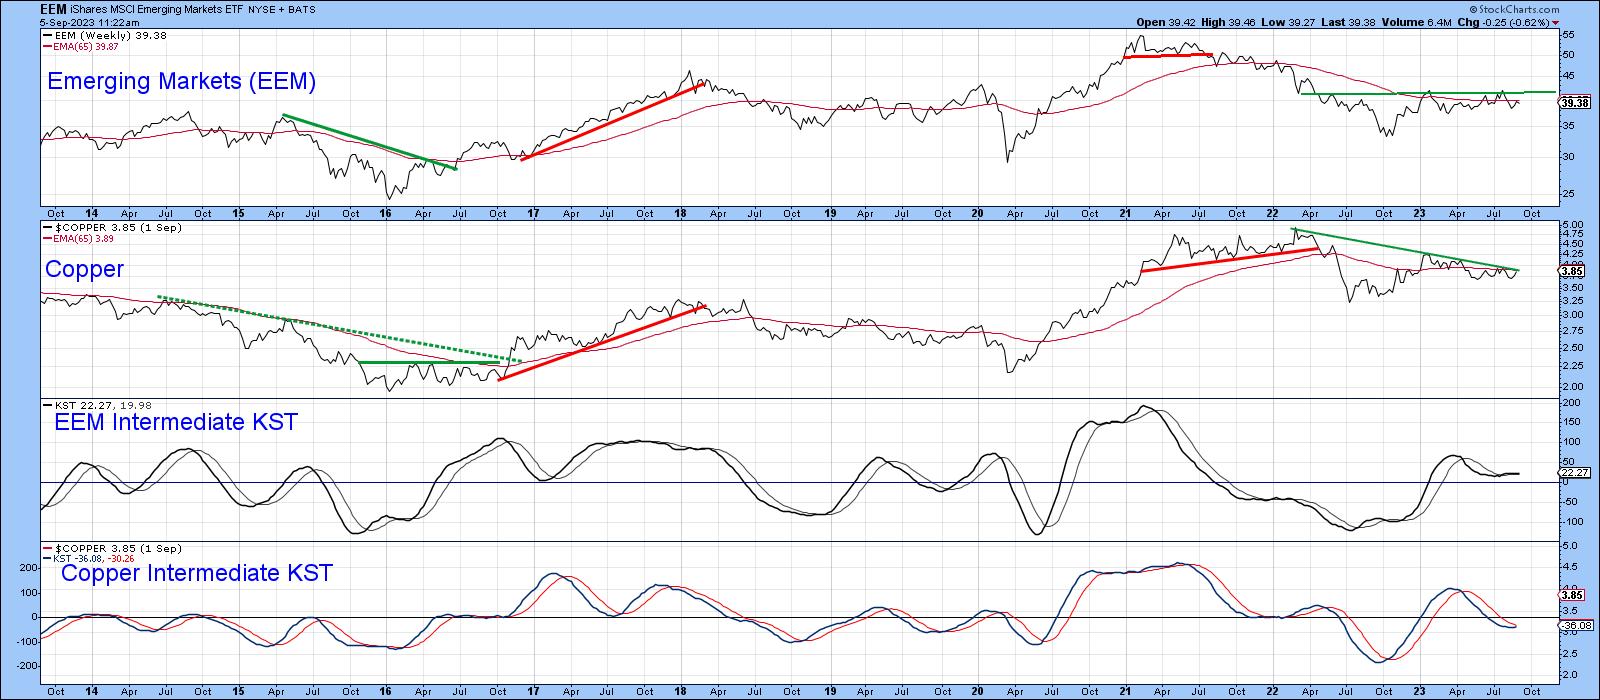
Finally, Chart 5 shows that the fortunes of emerging markets are tied in with the copper price, or more accurately with commodities in general, copper being a proxy in this case. To be sure, there are times when the two intermediate KSTs for the EEM and $COPPER diverge, but, since 2018, they have been remarkably close. Once again, we have the possibility of a bullish setup facing us, as both series are very close to important down trendlines.
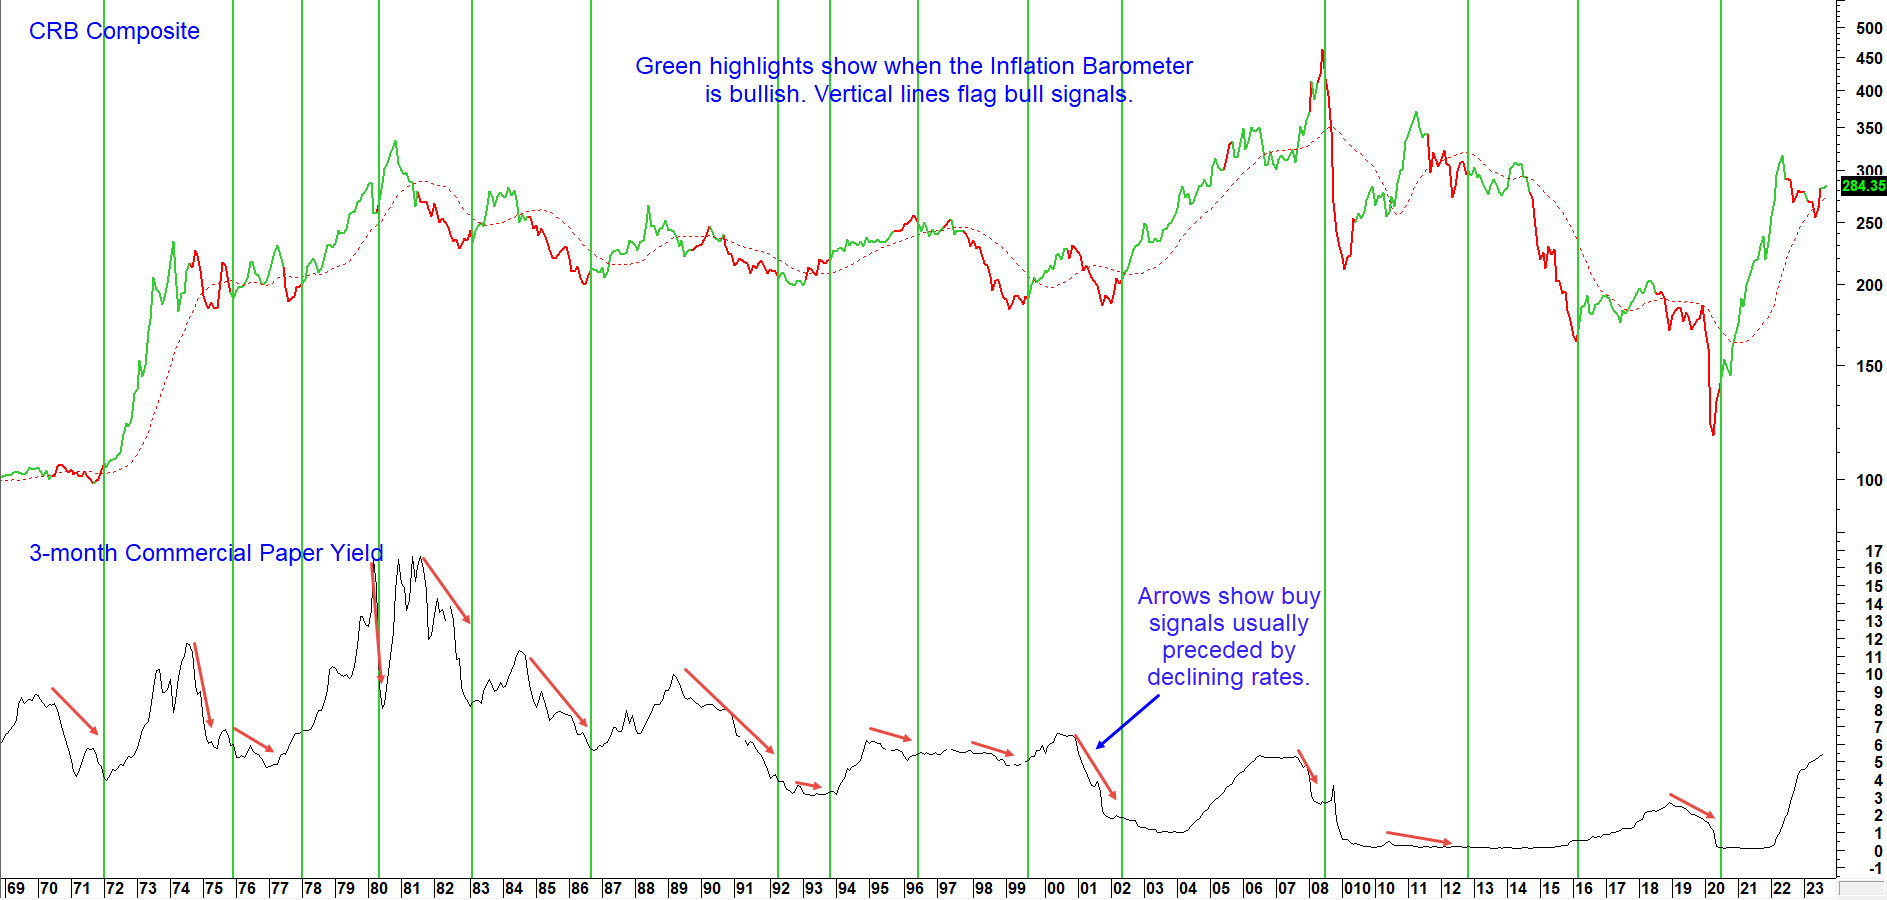
It's important to wait for the breakout, because Chart 6 shows that the current Barometer buy signal has not been preceded by the usual stimulating drop in interest rates, but by a rising trend instead. That, along with the possibility of a rising dollar,could limit any Stage 3 commodity gains.
Good luck and good charting,
Martin J. Pring
The views expressed in this article are those of the author and do not necessarily reflect the position or opinion of Pring Turner Capital Groupof Walnut Creek or its affiliates.


