Two Charts I'm Watching Closely for Potential Breakouts
The title of this article should really be more in the vein of two technical situations I am watching, because the long-term forces look as if they may be converging with short-term ones to form a kind of potential bullish reverse domino effect. Let's consider our first candidate, the Japanese yen.
Japanese Yen
Chart 1 offers us a long-term perspective, in that the currency broke down from a multi-year top some time ago. The event was marked by the penetration of the 1990-2022 dashed up trendline. This break was followed by a nasty extension to the very long-term bear market. I am assuming that secular downtrend is still in force. However, prices do not generally move in a straight line, which opens up the possibility of a contra-secular primary uptrend developing over the next 1-2 years. In that respect, the chart hints at the possibility that the currency is in the process of tracing out the second bottom of a double bottom formation. The long-term KST continues to rally, which is an encouraging factor.
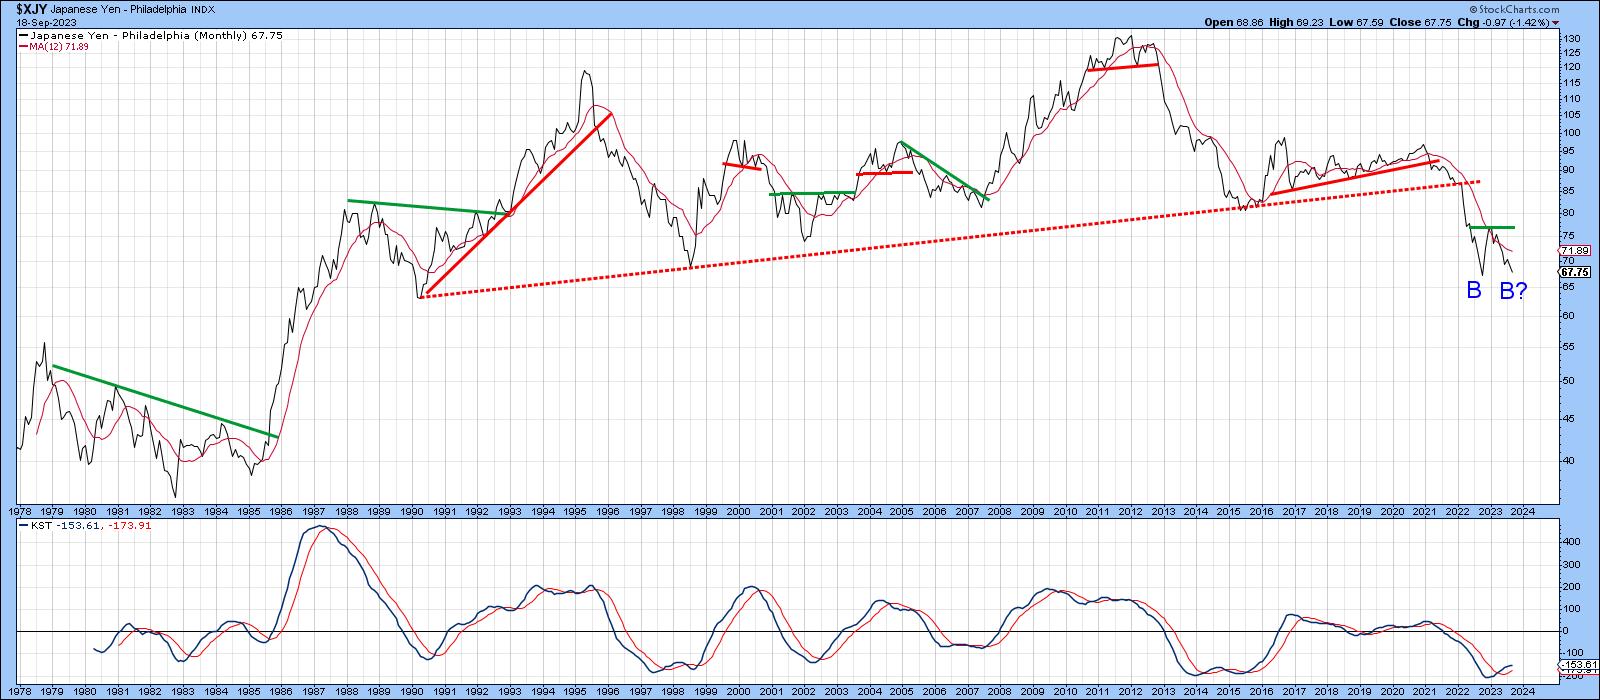
Chart 2 features recent action in greater detail, but this time on a daily basis. The yen rallied sharply at the turn of the year and has been selling off ever since. It is now within striking distance of last year's low, which throws up the possibility that a double bottom formation is being created. For that to happen, it would first be necessary for the currency to hold around the October 2023 low, before then clearing the February 2023 high. The first sign that something is stirring would be a break above the dashed 2023 down trendline, which is currently around 70.

Chart 3 features two ROCs with a 12- and a 45-day time span.
A couple of things are worth noting. For one, a positive divergence is forming between the 12-day ROC and the yen itself. However, in order to mean anything, this constructive action needs to be confirmed by a penetration of the down trend line. The 45-day series is also interesting since it has, apart from the period in the ellipse, been trading below zero since March. The last time it remained below this equilibrium level for an extended period and then crossed above it, a rally off the first potential bottom was triggered. A move above that 70 zone would most likely result in a similar bullish outcome.

Finally, Chart 4 features the daily bars together with a 9-day RSI and the daily KST. Note that the RSI has diverged positively with the currency, and the KST has just triggered a buy signal. Both represent constructive developments but mean little without confirmation by the price. That would come with a decisive break that can hold above the July/September down trendline, which is currently around the 68 level.

My conclusion on the yen, is that it is in a secular and primary bear market. However, if it is going to rally and reverse the primary trend, the currency should find support somewhere close to last October's bottom. With momentum diverging positively, an initial break above the 68 level would start the ball rolling. A stronger signal would come with a subsequent penetration of the down trendline at 70 (Chart 3). That would set in motion a test of the January high, the surpassing of which would confirm the completion of a double bottom completion.
Tesla
Chart 5 shows that, since 2011, Tesla (TSLA) has experienced three breakouts following a lengthy period of consolidation. Each time, the price has punched through a resistance trendline, crossed above its 12-month MA and experienced a long-term KST buy signal. The same action appears to have played out in 2023, except the resistance trendline has been a down trendline instead of a horizontal one and the KST at -102 has not yet crossed below its 9-month MA at -52. That's one of the reasons I am watching the stock.

Chart 6 indicates how close the price is to a breakout, as the more sensitive long-term KST (-146), using weekly data, is above its 26-week EMA at -164. The price itself is already above its 65-week EMA, but has yet to clear its resistance trendline. Meanwhile, the third window tells us that the TSLA RS line is also trading very close to its resistance line, with the relative long-term KST, in the bottom window, set to follow suit if indeed the RS line does break to the upside.

Finally, Chart 7 hints that the post-2022 consolidation will turn out to be an inverse head-and-shoulders consolidation pattern, if completed with an upside breakout. The pattern can be constructed in two different ways, as flagged by the solid and dashed trendlines. Either qualifies as a potential neckline. The potential formation indicated with the solid neckline would require a daily close above $290, whereas the dashed, more horizontal formation would be completed with a decisive close that can hold north of the previous high of $291, so, let's say, a round $300. The two positive KSTs suggest that if it is going to happen, the next few weeks would be as good a time to expect it as any.

Good luck and good charting,
Martin J. Pring
The views expressed in this article are those of the author and do not necessarily reflect the position or opinion of Pring Turner Capital Groupof Walnut Creek or its affiliates.


