If War in the Middle East Won't Push this Market Down, What Will?
I must say, I was surprised that the outbreak of war in the Middle East and a 4% rise in oil sent the market higher, not lower by the close of business last Monday. Typically, a market that does not respond to bad news in a negative way is one that's in very good technical shape. Adding to that, with uncertainty over the speakership, rising interest rates and the real possibility the Israeli/Hamas war could expand, you have a wall of worry perfectly formed to support a rally. Oh yes, we can add an oversold market and a positive seasonal going into year end to the list.
The Long-Term Picture
Before we get too carried away, Chart 1 sets the scene, comparing the S&P Composite to its long-term KST. Right now, the setup is bullish because the Index is above its 12-month MA, and the KST is also rising and above its average. For me, that's a quick test that a bull market is underway. Usually, the Index maintains this bullish combination for many months at a time, so it's more of a background factor. In this case, though, the KST is barely above the zero level, which means a weak rally from here could quickly translate to a couple of bearish signals. That's not a forecast, but is something that should be watched very carefully going forward.
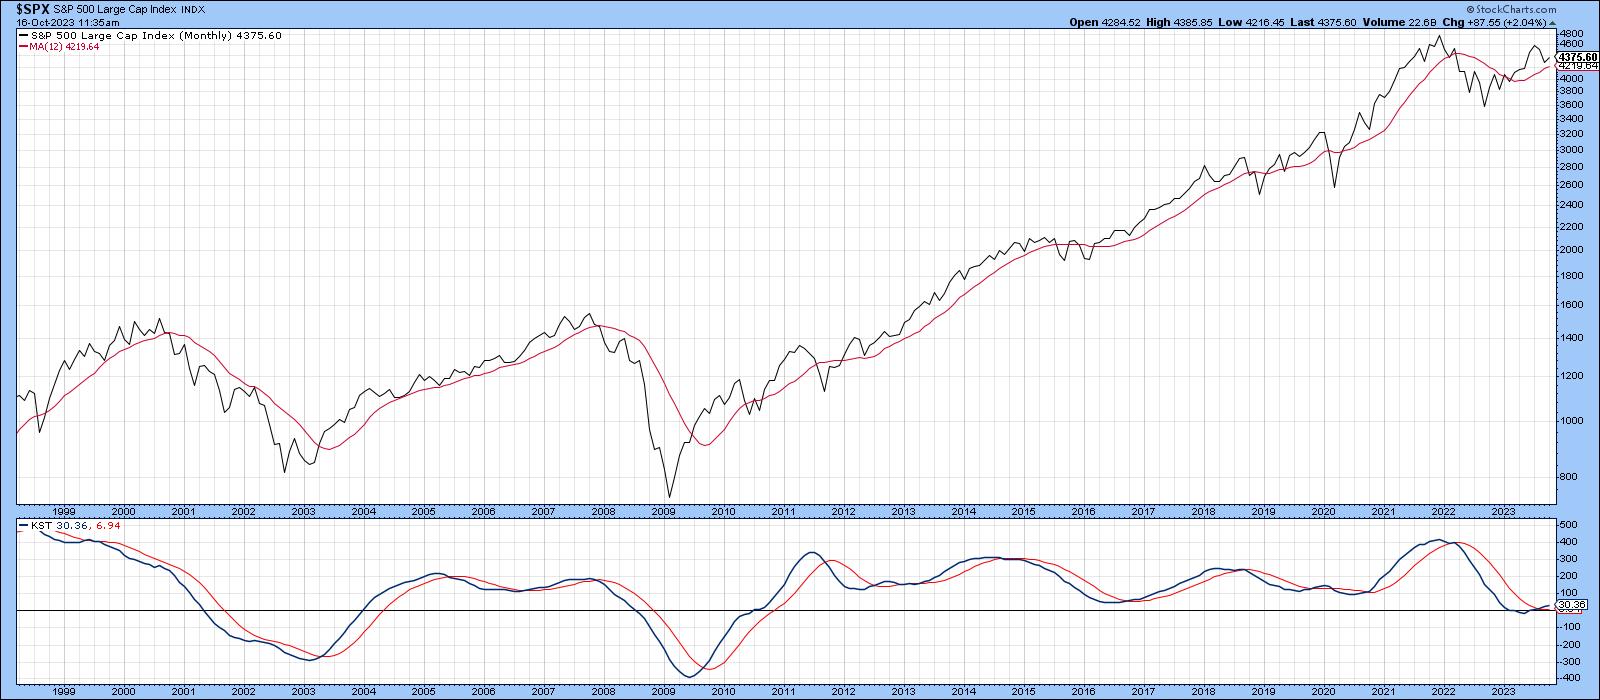
The reason lies in the fact that a momentum indicator that is barely able to cross zero at a time when the price it is monitoring registers, or comes close to touching a new high, indicates a very weak technical picture when confirmed by the price. In this case, the confirmation would be a drop by the S&P below its 12-month MA, which is currently at 4,220. As I said earlier, I do not expect such a scenario, especially as the market has shrugged off some bad news. That's enough concerning the long-term, so let's see what some of the intermediate indicators are saying.
Intermediate Oscillators
Sentiment is a key ingredient, and Chart 2 features the 30-day MA of the CBOE Options Total Put Call Ratio. It currently reflects an extreme number of bearish bets being placed through the purchase of puts relative to calls. It is when this indicator starts to reverse from an extreme level that positive signals are generated for stocks. It has not started to reverse in any meaningful way yet, but is clearly at an extreme.
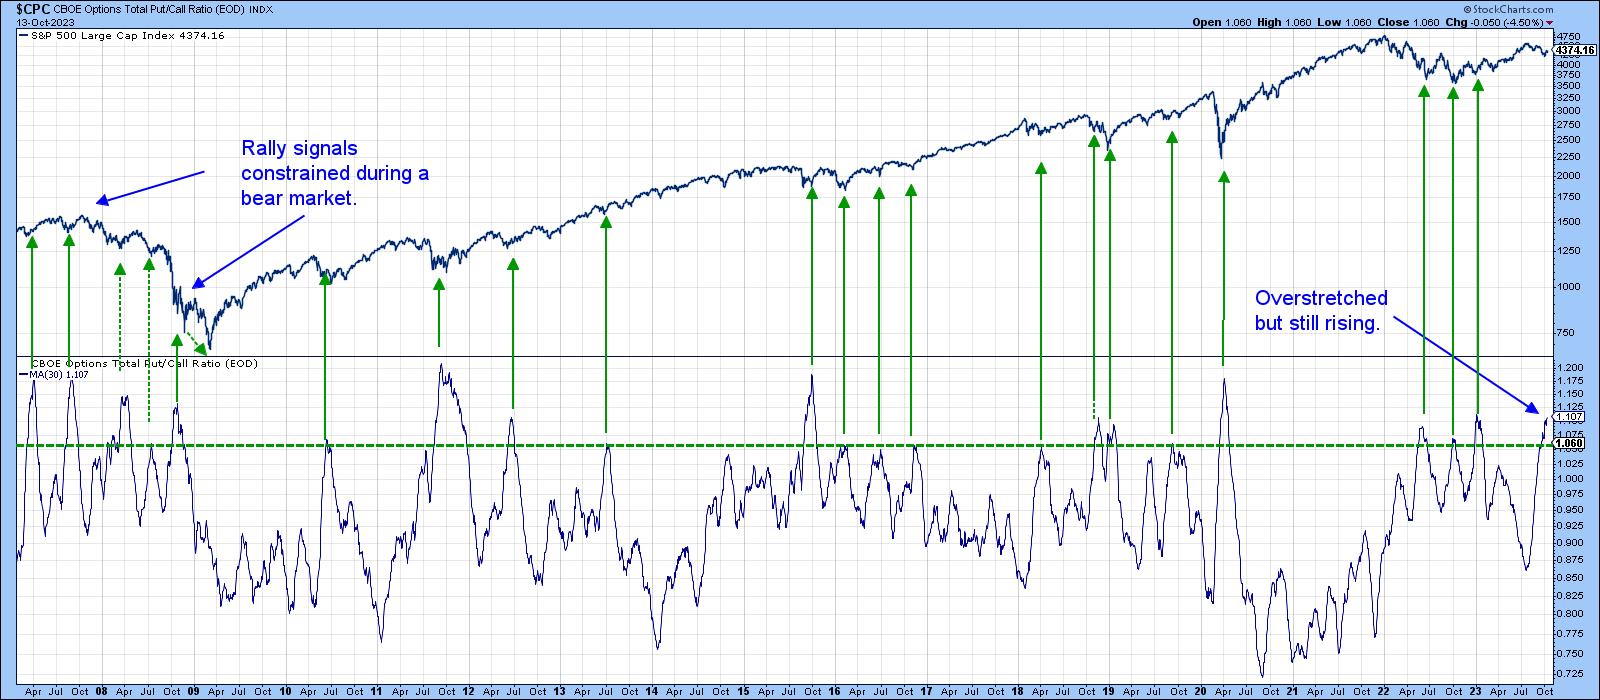
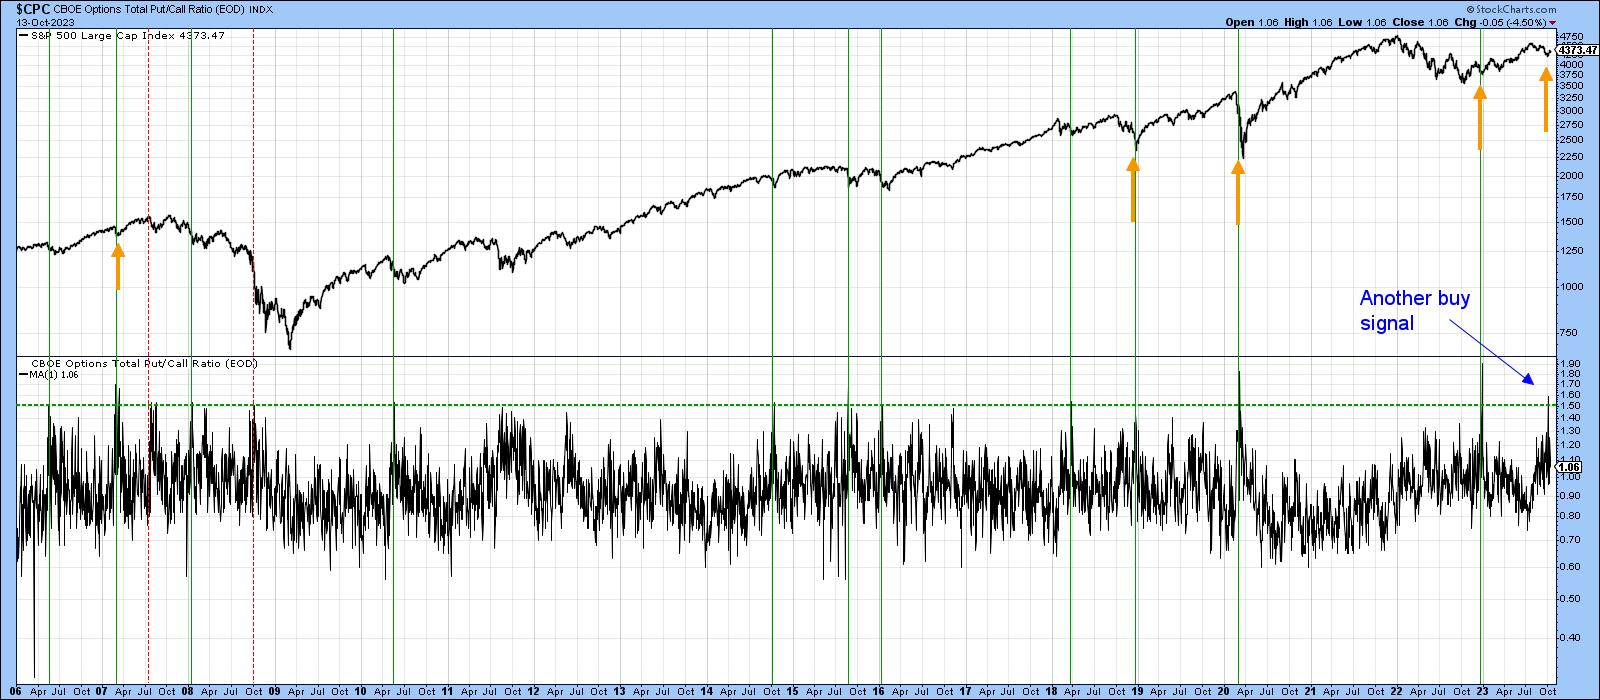
Chart 3, which features a daily close for the same indicator, recently pierced the 1.5 level. The vertical lines flag instances when it reached that level, and the orange arrows flag when it was exceeded. Pretty well all of those extreme readings represented great buying opportunities. The early October swing above 1.5 reflects an encouraging sign of fear, which is a typical characteristic of an important low.
The McClellan Cumulative Oscillator cumulates the readings from the McClellan Oscillator itself. It is helpful when it sinks to its oversold zone, as flagged by the green horizontal line, and subsequently reverses to the upside. The solid vertical lines indicate that this setup is typically followed by a nice rally. However, the two dashed ones remind us that this is no holy grail! It very much looks as if this indicator is in the process of turning, though it would increase the odds of a positive outcome should the NYA cross above its 200-day MA, around 1569. That would then distinguish the current signal from the two failed ones, which were never followed by a positive MA crossover.
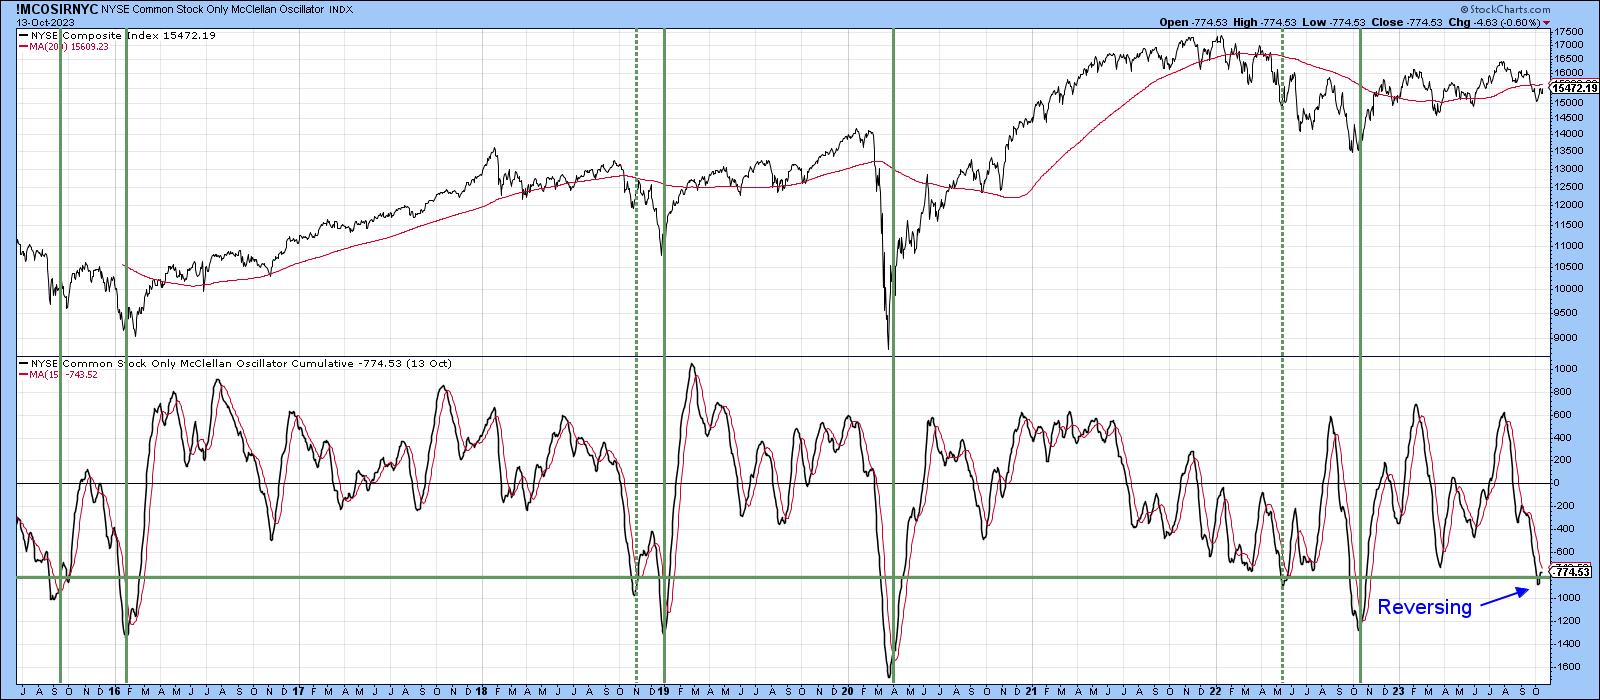
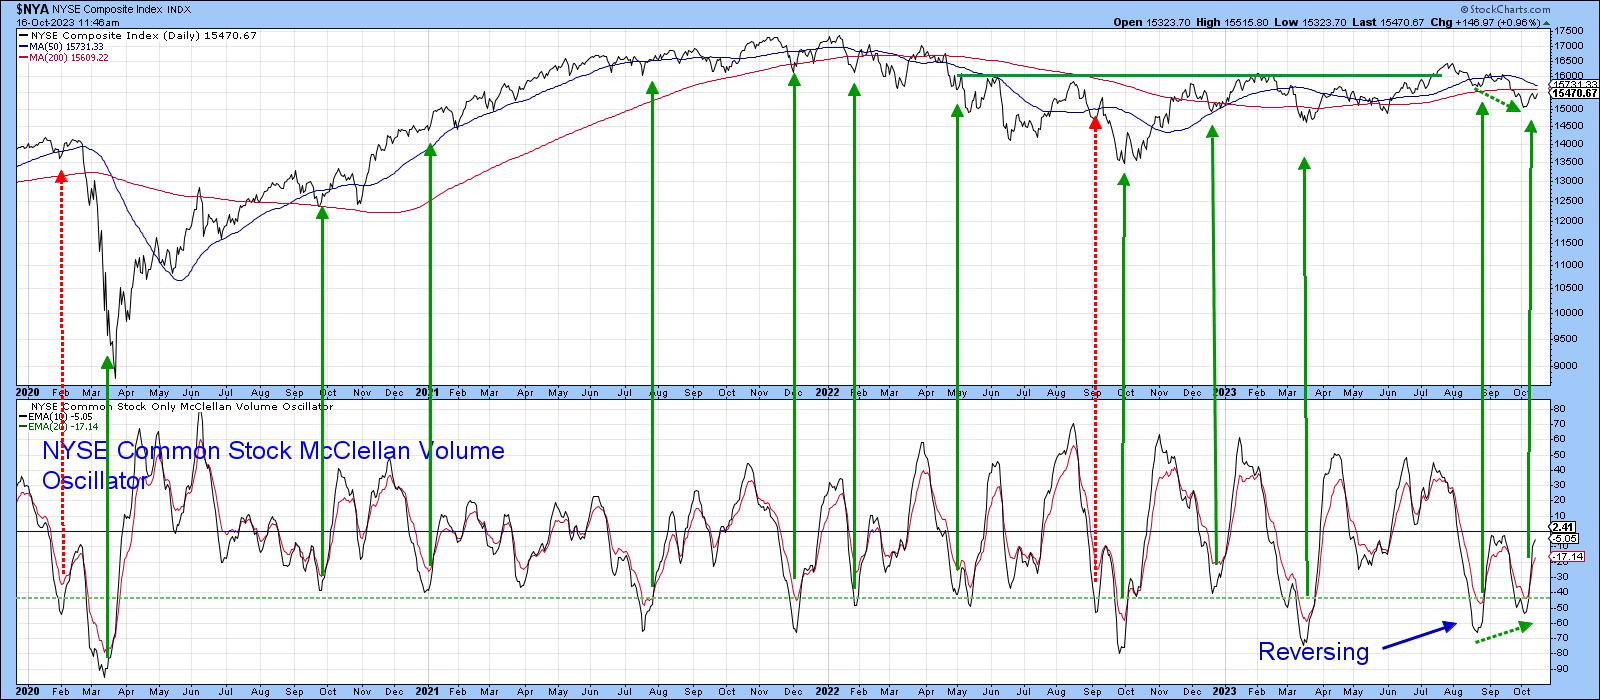
Chart 5 displays a 10-day MA of the McClellan Volume Oscillator, which is more of a short-term indicator. This series recently reversed from an overstretched reading below the dashed green horizontal line, thereby generating another buy signal. It has the possibility of generating a strong rally because the setup includes a positive divergence. Since a trend reversal signal is required as confirmation, once again, it's important to wait for a positive NYA 200-day MA crossover that can hold.
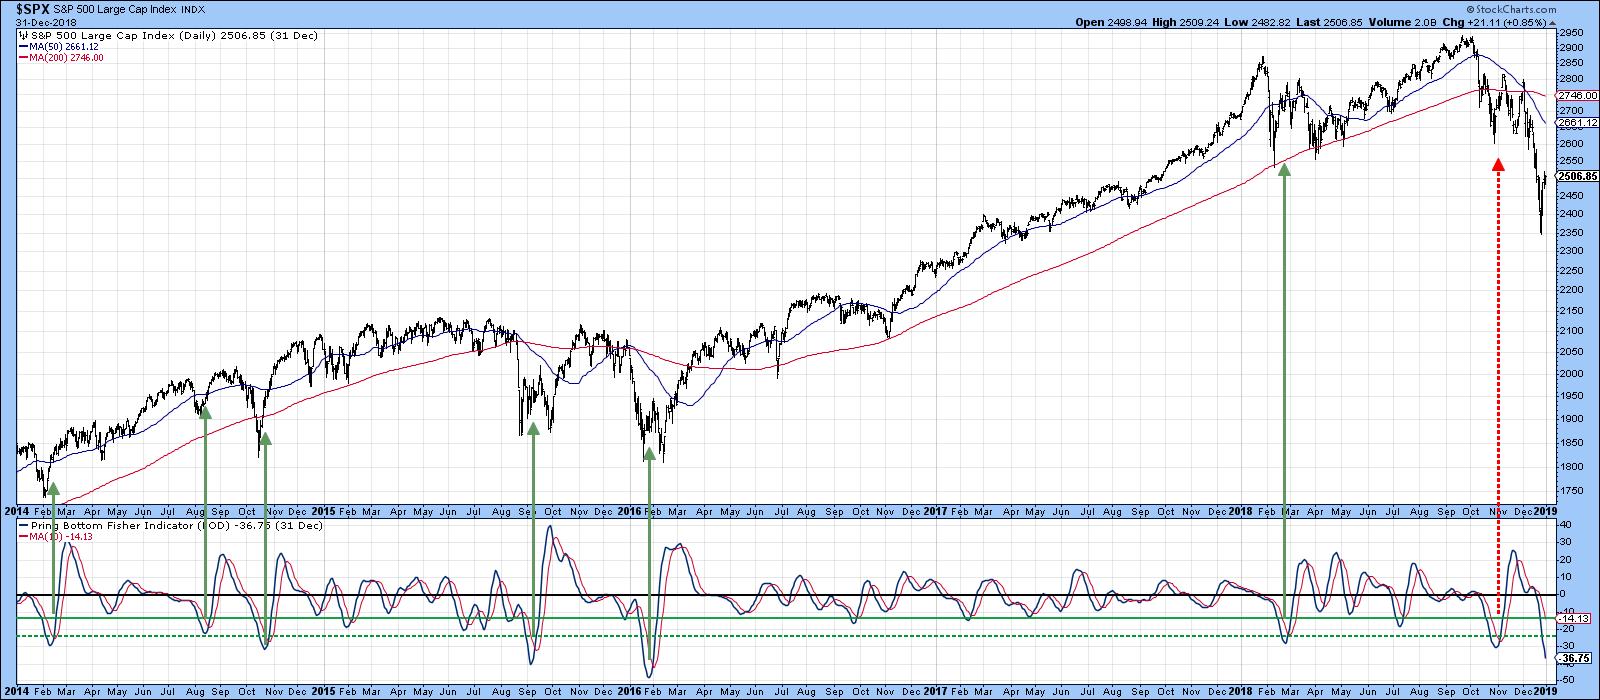
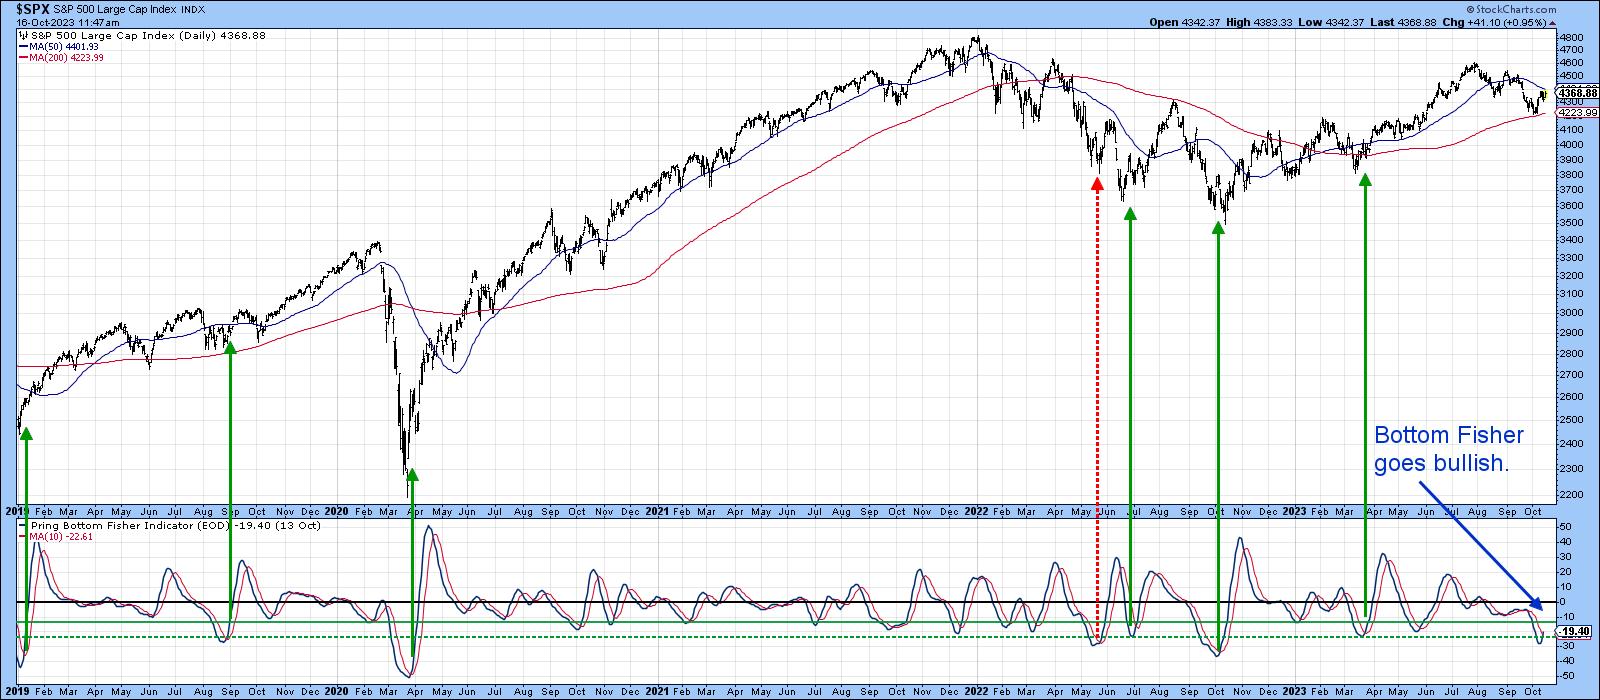
Charts 6 and 7 feature my "Bottom Fisher". Chart 6 covers the 2014-2019 period and Chart 7 brings us up to date. I call it that because its one purpose in life is to flag short- and intermediate-term market bottoms. You can read about its construction here, but its interpretation is straightforward. Important buy signals are generated when it drops to the dashed horizontal line and reverses to the upside; a setup of that nature happened last Friday. That does not mean the market will go straight up, as 2015, 2016, and 2018 signals testify. What it does imply, though, is that US equities are in an important buy zone going into a bullish end-of-year seasonal.
Good luck and good charting,
Martin J. Pring
The views expressed in this article are those of the author and do not necessarily reflect the position or opinion of Pring Turner Capital Groupof Walnut Creek or its affiliates.


