REITS Getting Ready to Rally, But What Happens After That?
Several short-term charts suggest the SPDR Real Estate ETF (XLRE) is getting ready to rock and roll, thereby indicating an extension to this week's rebound is in the cards. It's possible that the expected rally could result in shifting some of the longer-term indicators towards a positive mode; however, that's going to be a tall order because of extensive technical damage done in the last couple of years. Let's start with the near-term picture and work our way higher.
Short-Term Picture
The upper window in Chart 1 shows that the XLRE is currently below its 50-day MA and the July/October down trendline. A challenge is underway, as we can see from the reversing action of the daily KST in the second window. Relative action in the third clip has been even worse, with 2023 reflecting a clear-cut downtrend. It would not take much, though, to result in a penetration of that line.
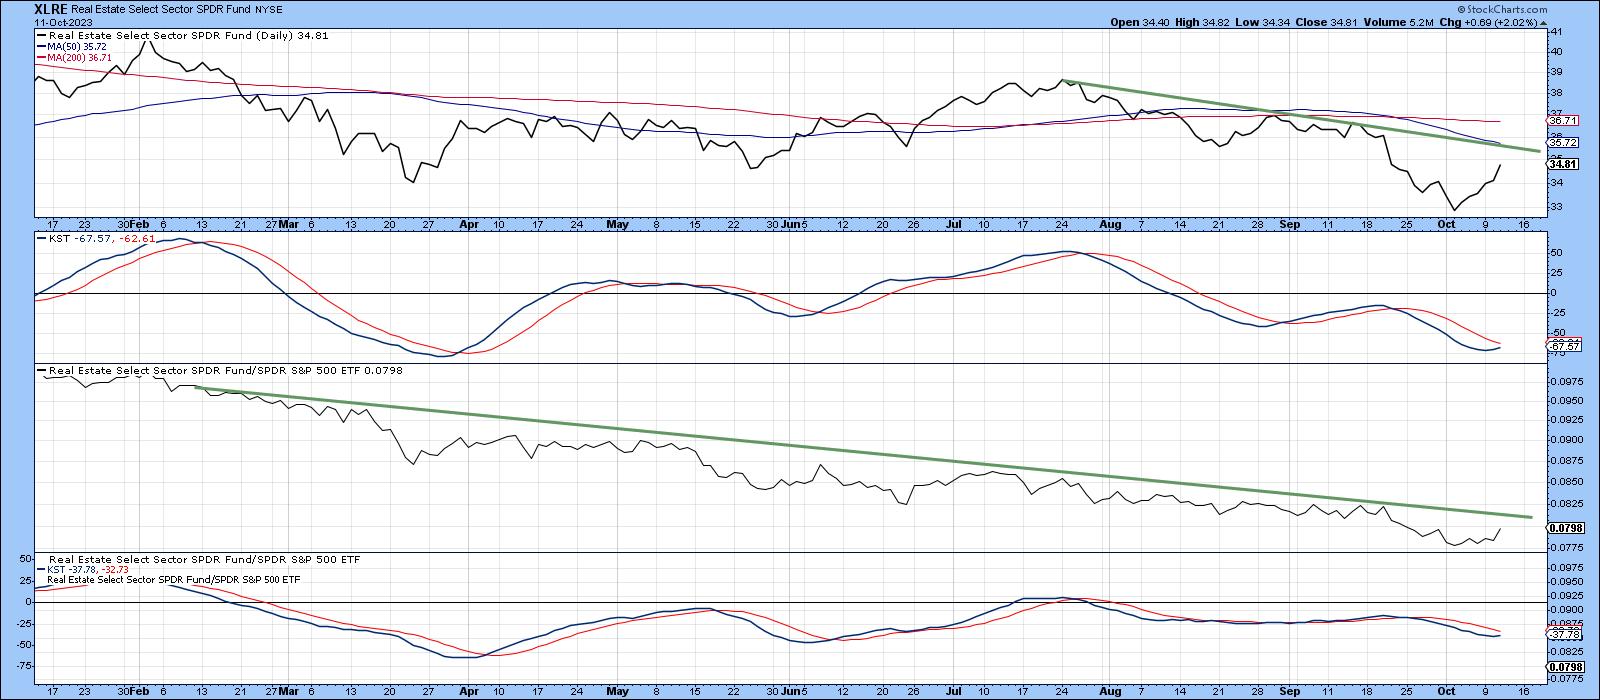
Some encouragement is being given by the percentage off REITS above their 20-day EMA, which has already begun to turn up. The solid arrows tell us that such action has usually been followed by a short-term rally of some kind. The dashed ones in Chart 2 also remind us that this is far from a perfect approach.
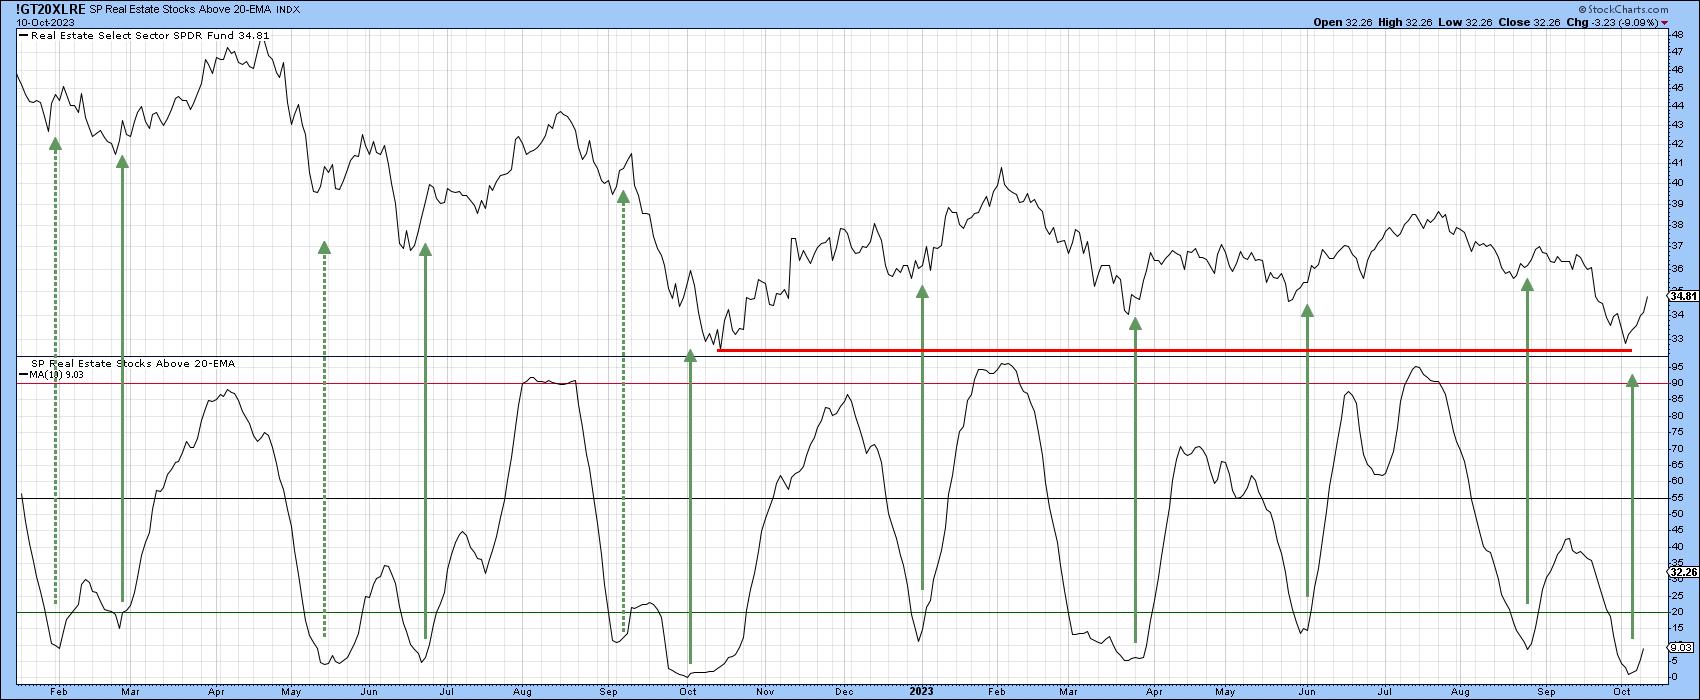
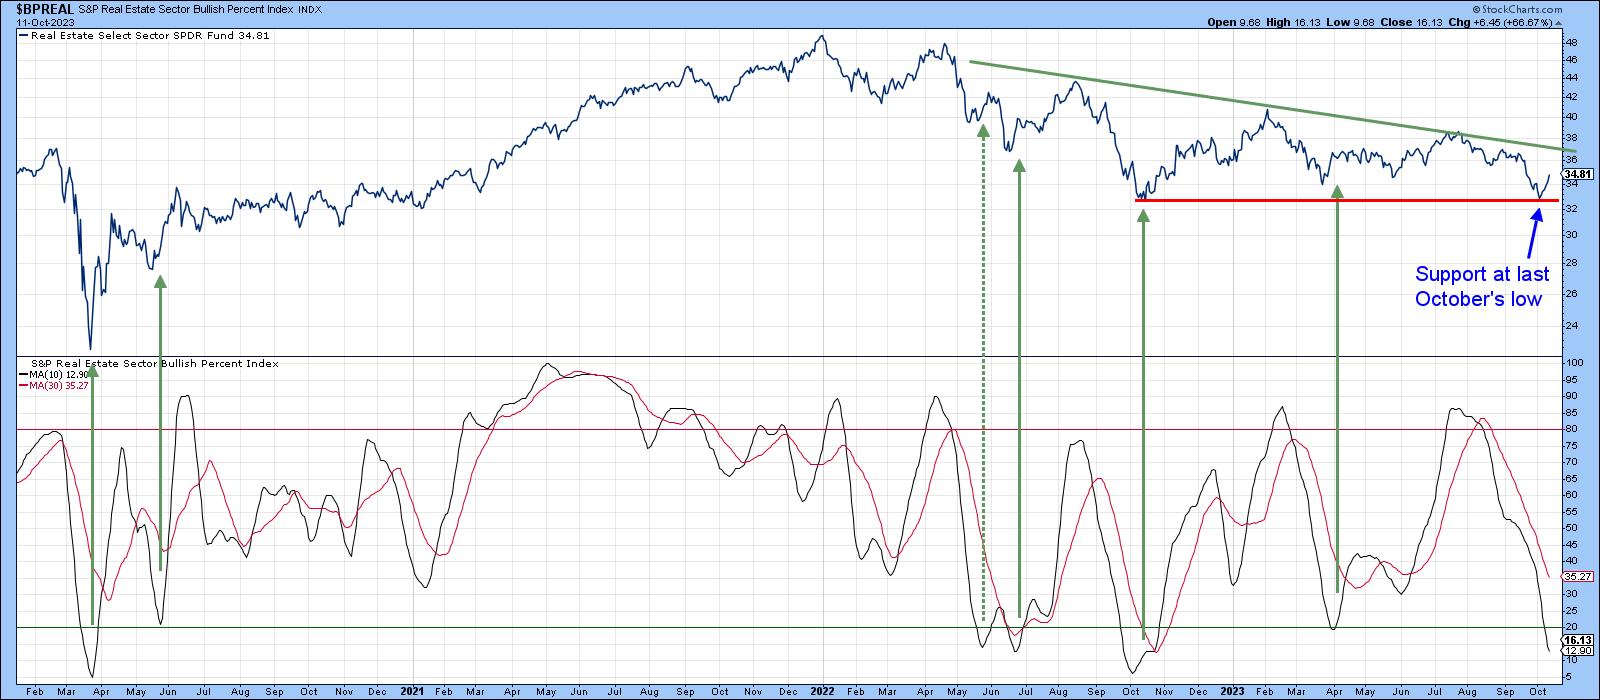
Chart 3 draws our attention to the deeply oversold condition this sector currently finds itself in, because the 10-day MA of the bullish percentage is very close to its maximum downside extreme. The arrows flag oversold upside reversals. Only the mid-May signal failed to result in a worthwhile short-term rally. It's important to note that an upside reversal has not yet been triggered, though the reversal in Chart 2 says it will likely happen soon.
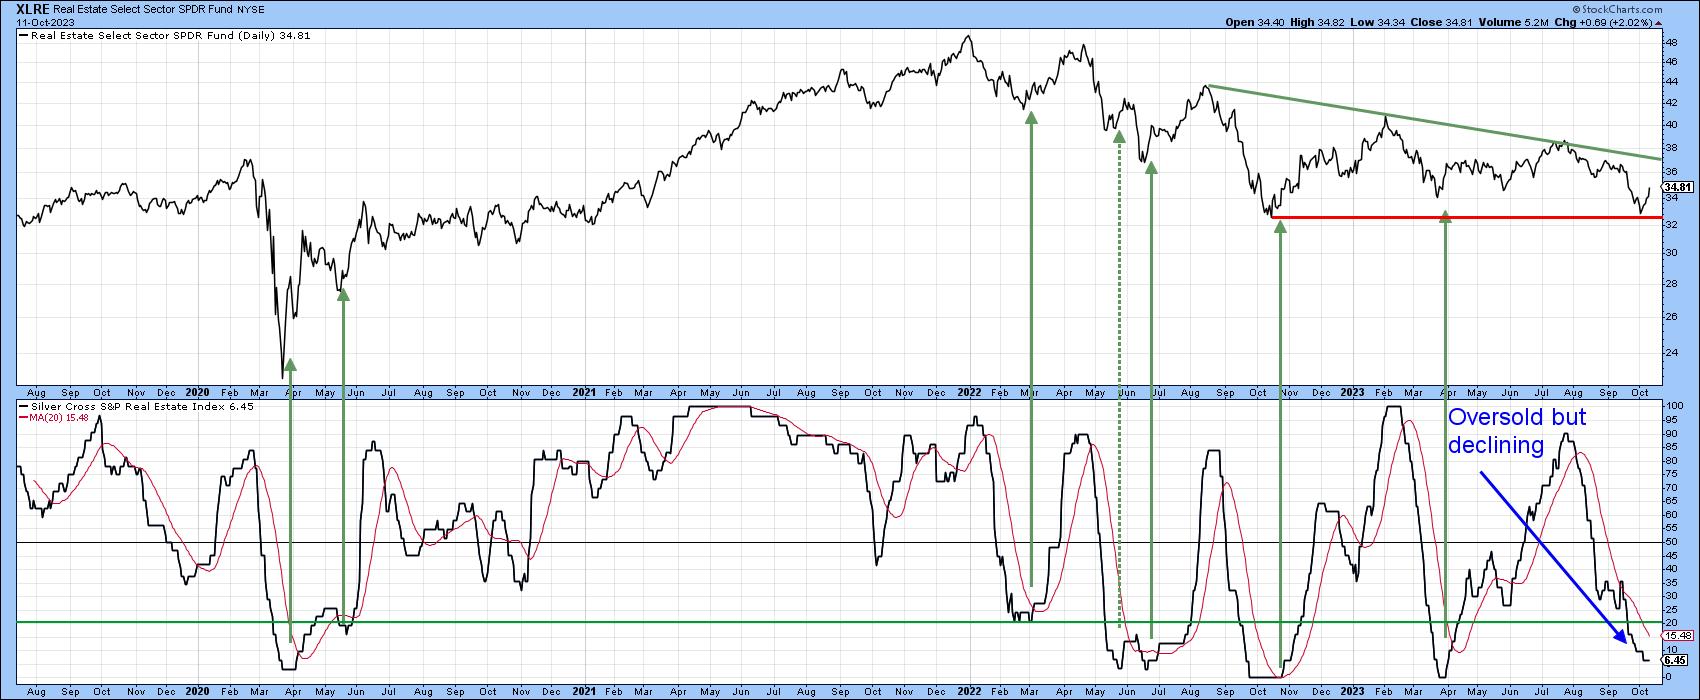
Finally, Chart 4 represents another breadth indicator, the percentage of REITS experiencing a positive silver cross. A positive silver cross takes place when the 20-day EMA of the price of one of the components crosses above its 50-day counterpart. This indicator has also reached an extreme oversold reading and is waiting for an upside reversal to earn another green arrow.
The Longer-Term Picture and Relative Performance
The indicators suggest the odds of a short-term rally in this beaten-down sector are good. However, I am wondering what happens after that, as REITS have been a really great performer so far this century. Chart 5 shows the XLRE rose from $1.30 in 2002 to its December 2021 monthly closing high of $48.86. The chart also shows that the price completed a massive head-and-shoulders top during the recent market correction. Both the price and its KST remain below their respective MAs.
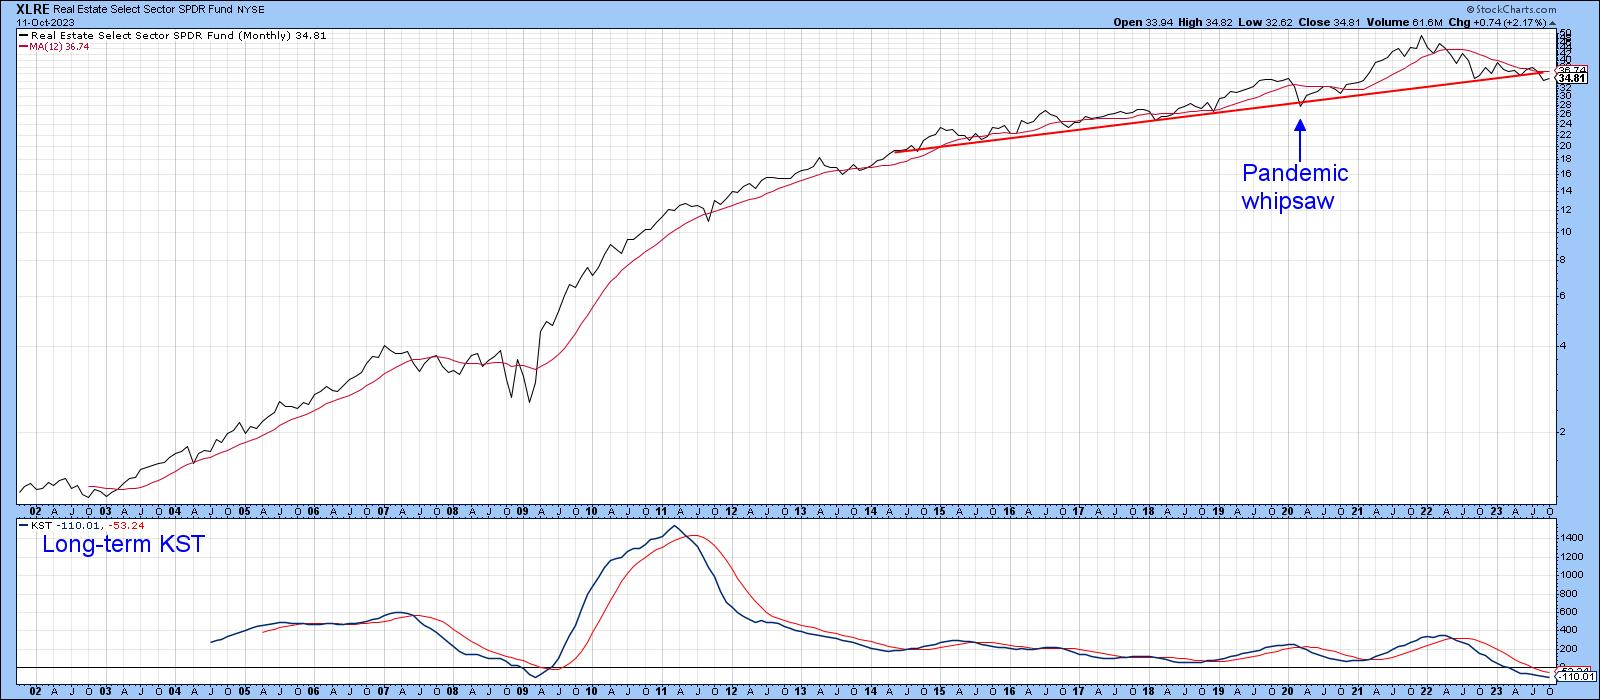
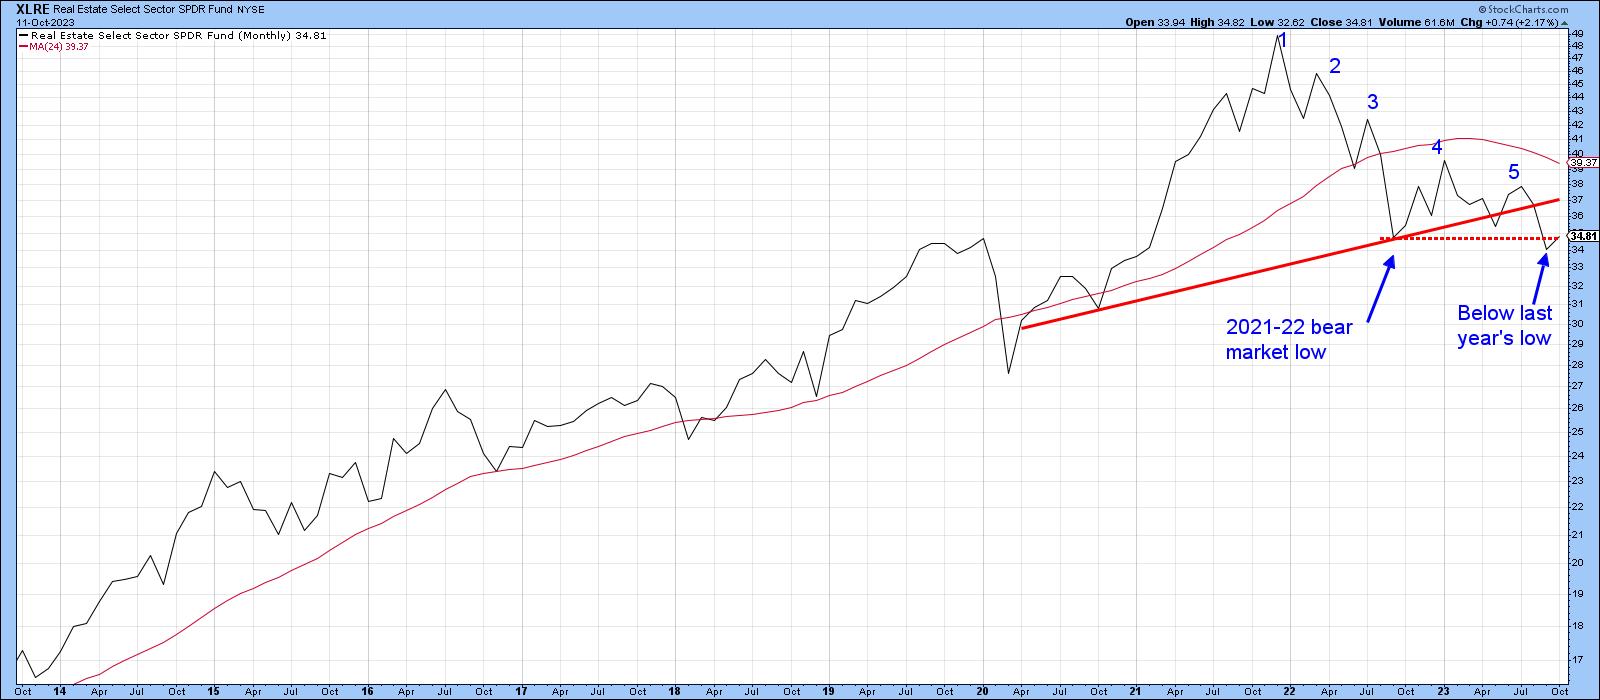
Chart 6 also reveals a series of consecutively lower highs. Arguably more important is the fact that September saw the XLRE register a post-2022 monthly closing low, thereby indicating that the 2021-present bear market is intact.
The completion of a 7-year top is no mean feat, but the technical damage already done also extends to its relative performance. For this, we turn to Chart 7, which compares the price to its relative line. The relative performance of REITS peaked in 2016, five years ahead of the absolute top. Since then, the RS line has seen two consecutive lower highs as the XLRE itself has been working its way higher. This negative divergence was confirmed at the turn of the year, when the RS line completed a 12-year top. That alone suggests this sector will be under pressure for many years to come.
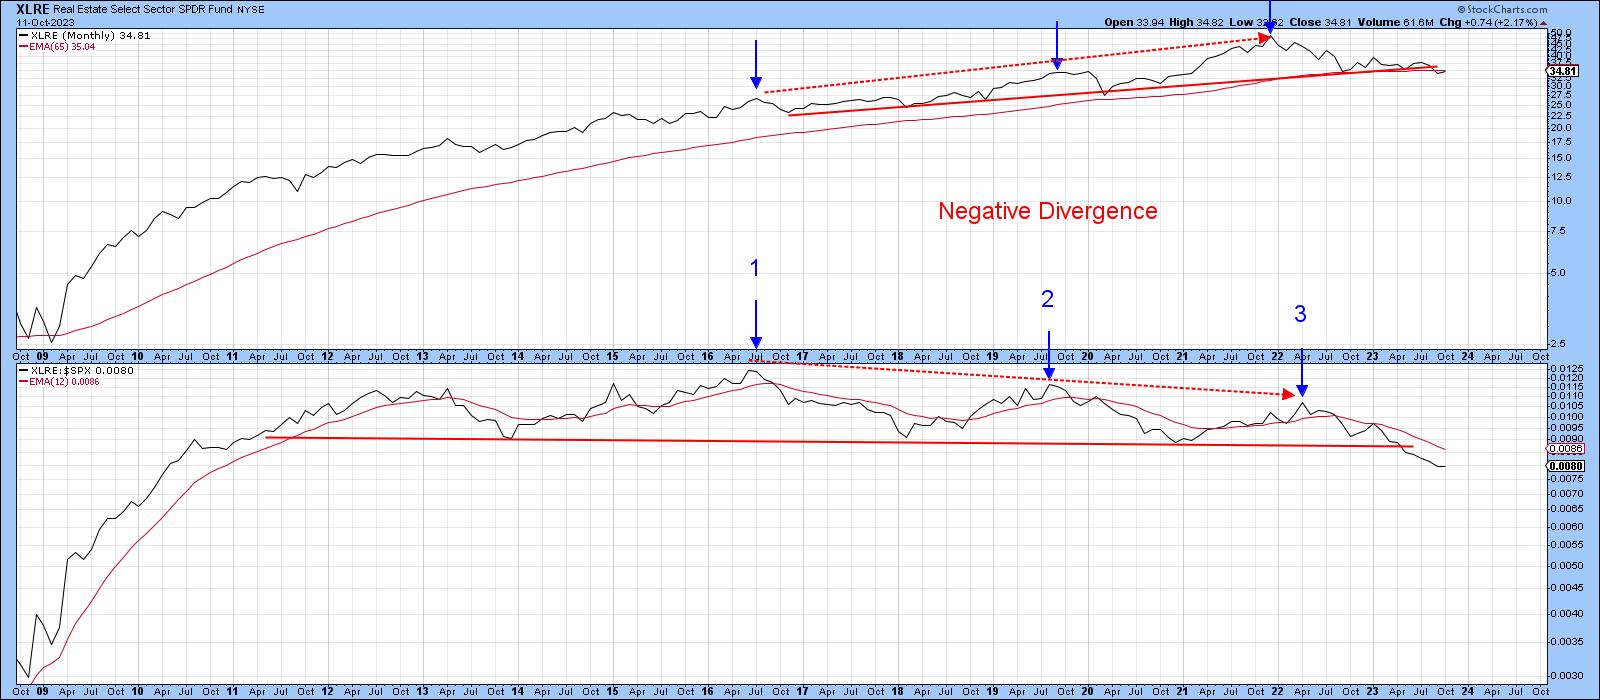
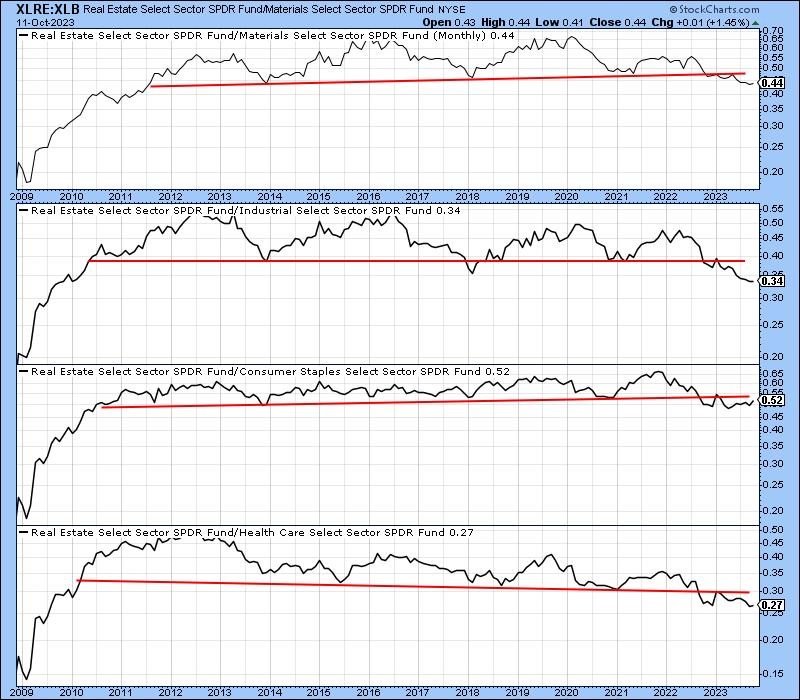
Chart 7, as well as Charts 8 and 9, round out the picture by comparing the XLRE to many other sectors, the vast majority of which are in relative bear markets.

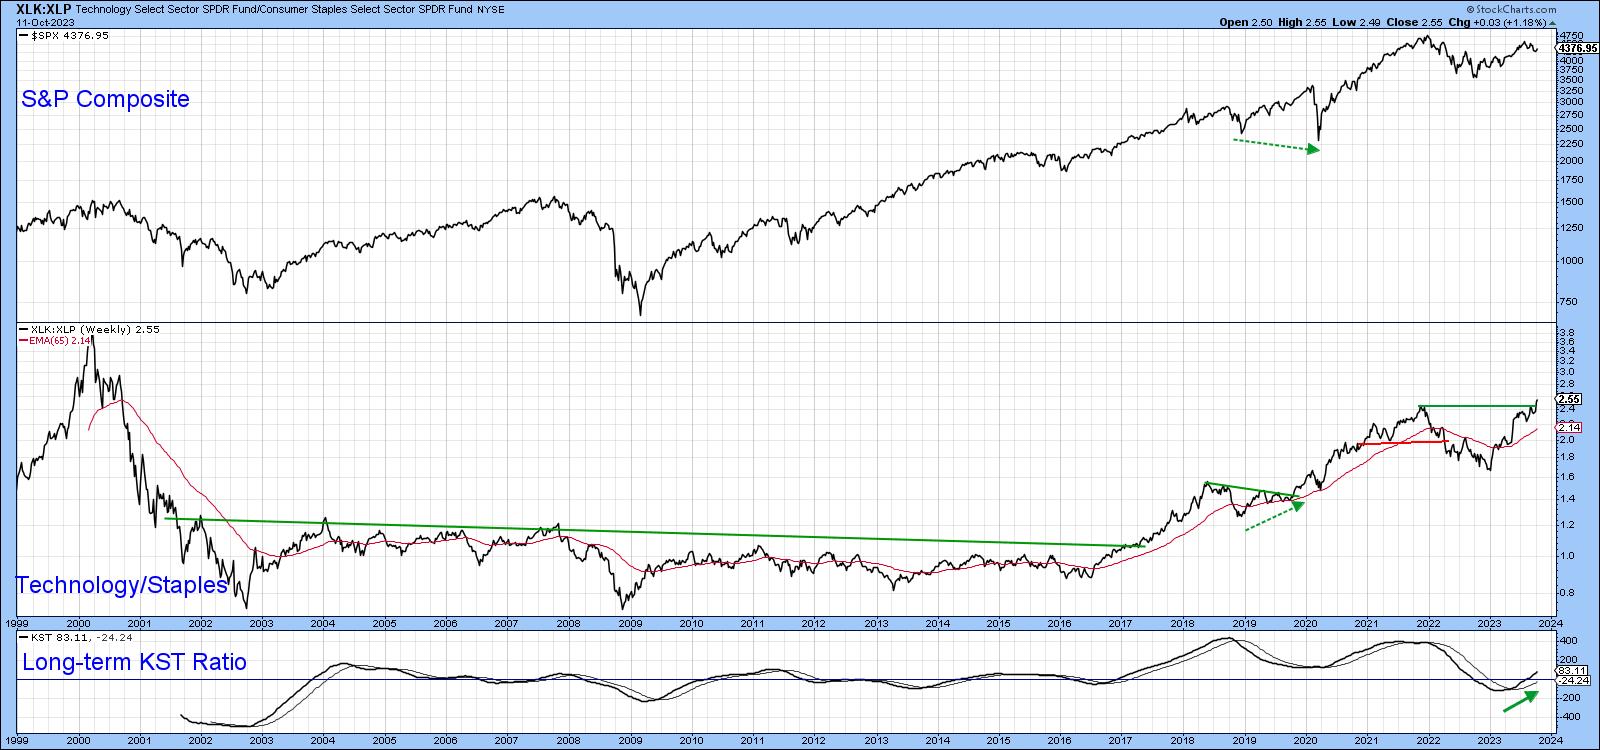
On a happier note, Chart 10 compares the XLK to the XLP. When this relationship is in a rising mode, it's usually bullish for the market. This week's break to a new high is therefore very encouraging.
Good luck and good charting,
Martin J. Pring
The views expressed in this article are those of the author and do not necessarily reflect the position or opinion of Pring Turner Capital Groupof Walnut Creek or its affiliates.


