When the Dollar Stops Going Up, Will These Markets Stop Going Down?
The Dollar Index
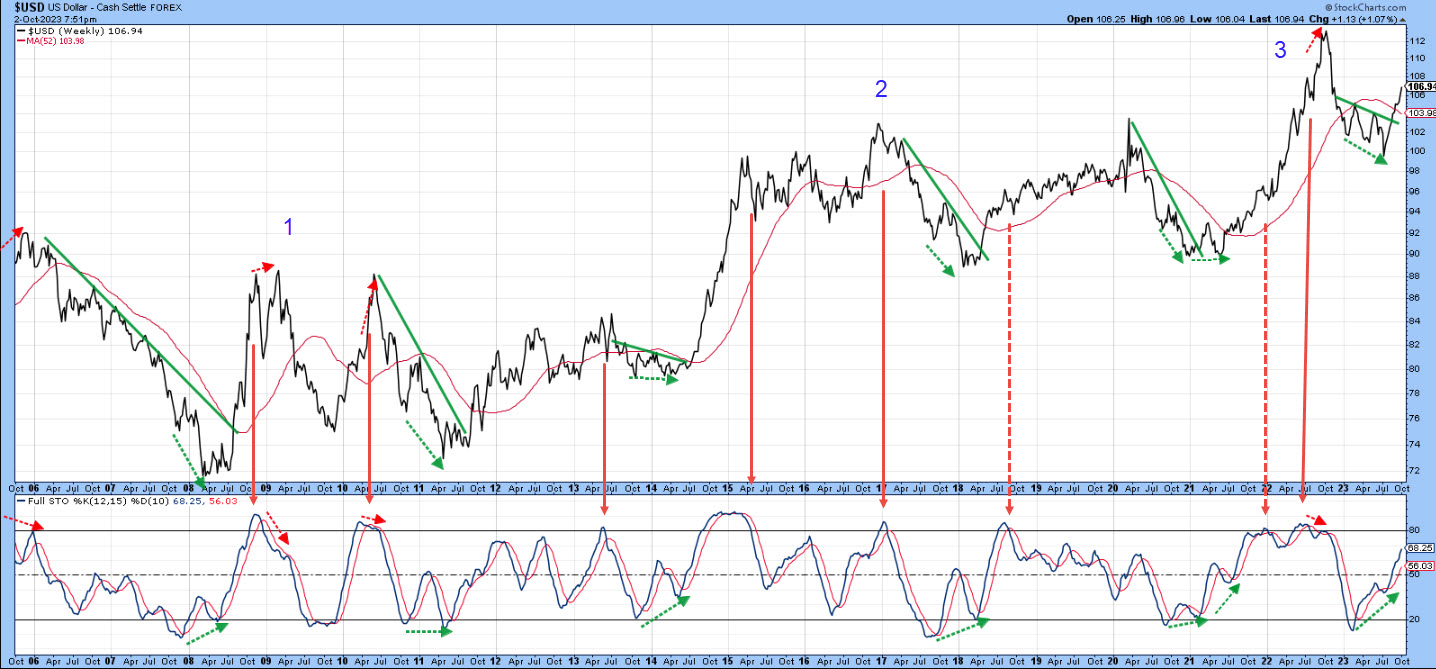
I last wrote an article on the dollar in August, The Dollar Index Goes to Missouri. In it, I pointed out that the Index had reached crucial resistance, which, if surpassed, would signal a new primary bull market and a likely fourth up leg to the secular or very long-term trend emanating in 2008. In that respect, Chart 1 flags the three previous primary peaks in that post-2008 secular advance. Several positive divergences between the Index and the stochastic indicator are also labeled. At the time, I thought there was a pretty good chance the 2023 rally would be interrupted by a short-term correction, following which a successful challenge of the resistance would take place. However, the Dollar Index thumbed its nose at my expectations. It continued to move higher, which is a sign of a very strong bull market.
The red arrows in Chart 1 flag major overbought reversals in the oscillator. The solid ones were followed by a decline, while the dashed ones turned out to be false negatives. The oscillator is now well on its way to an extreme reading, but has some way to go before it can get there and reverse to the downside. Bottom line, the currency is headed higher over the long haul.
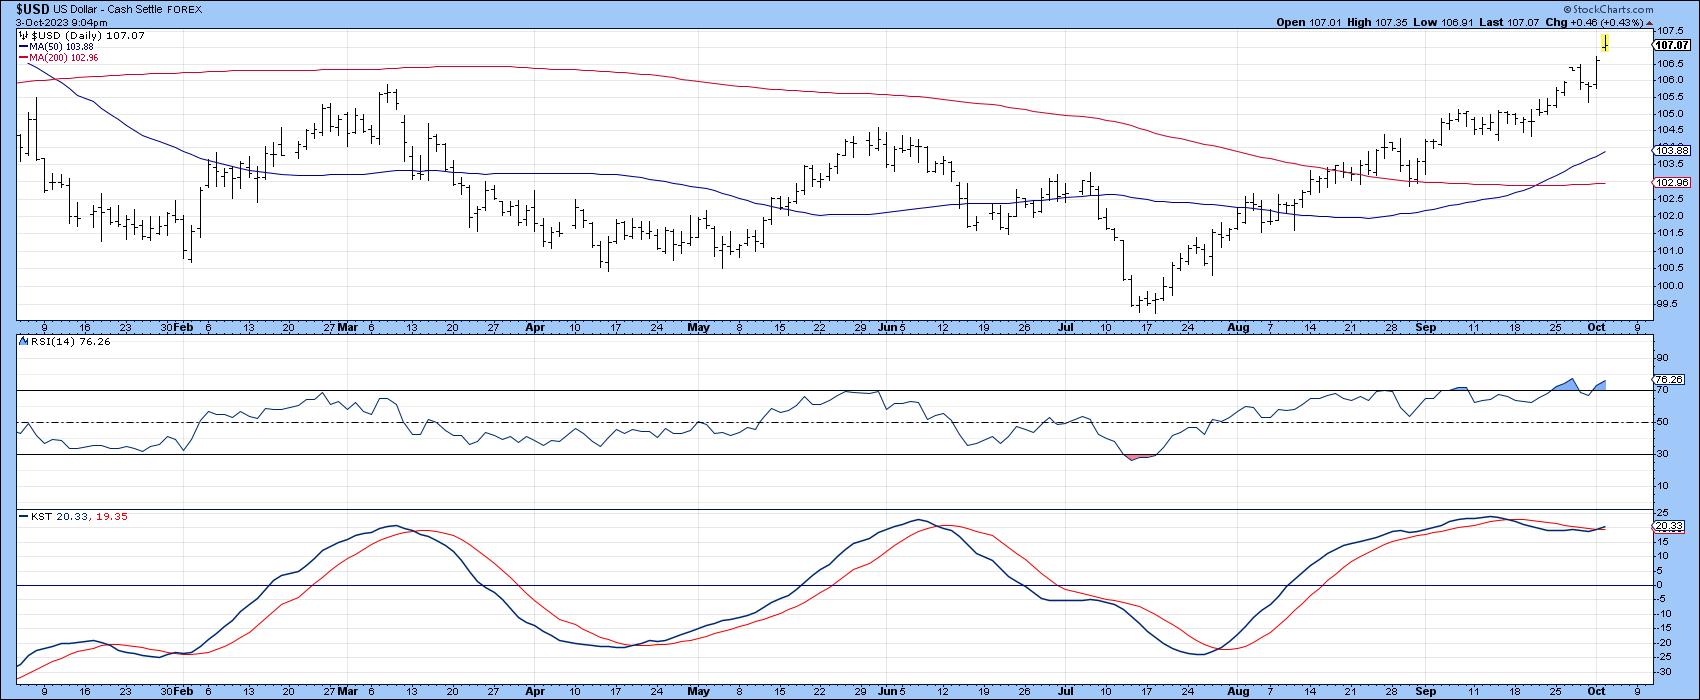
That said, Chart 2 features a couple of shorter-term indicators, the 14-day RSI and the daily KST, both overstretched. They suggest a short-term reversal is likely, though this is a tough call in a strong bull market. Since several markets have been selling off after the dollar began surging in mid-July, the question naturally arises as to whether they are in a position to reverse their declining trends, should the dollar start to weaken.
U.S. Equities
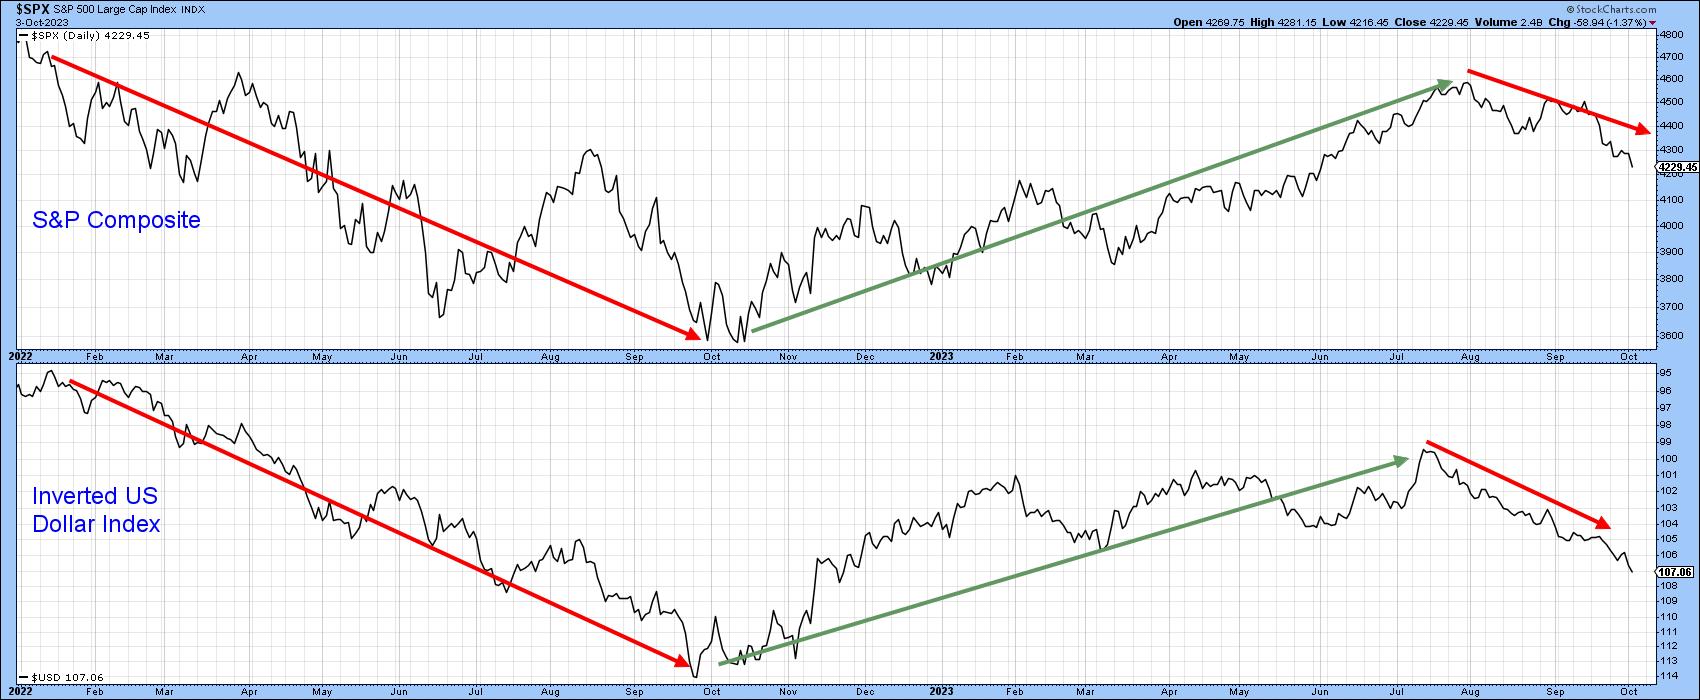
Chart 3 compares price action of the S&P Composite to that of the Invesco Dollar ETF (UUP) for most of 2023. The red and green arrows attempt to demonstrate these two series move inversely to each other. We need to stress that this relationship is not always that close, and changes along with financial conditions and sentiment. There can be little doubt, though, that, so far this year, a rising dollar has been bearish for stocks and a falling one bullish.
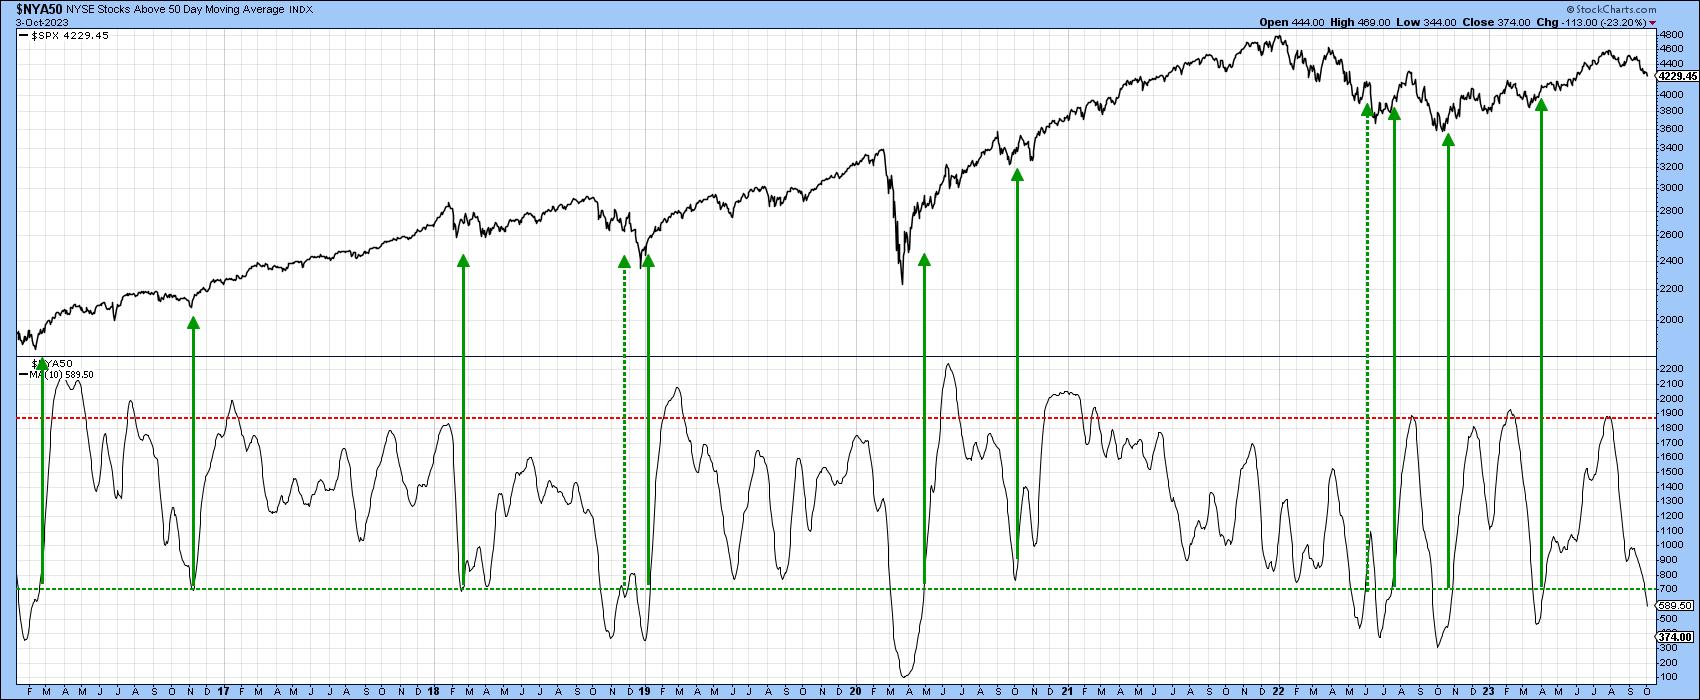
Last week, I pointed out that most short-term stock market indicators were declining, but their readings were in the vicinity of previous bull market correction lows. One of those indicators is calculated from the number of NYSE stocks above their 50-day MA; it is featured in Chart 4. This oscillator is still declining, but has dropped to an even more attractive level in the last few days. Given the recent inverse relationship between US equities and the Dollar, it seems the indicator, and therefore the market, is primed to respond positively should a dollar reversal take place.
Gold
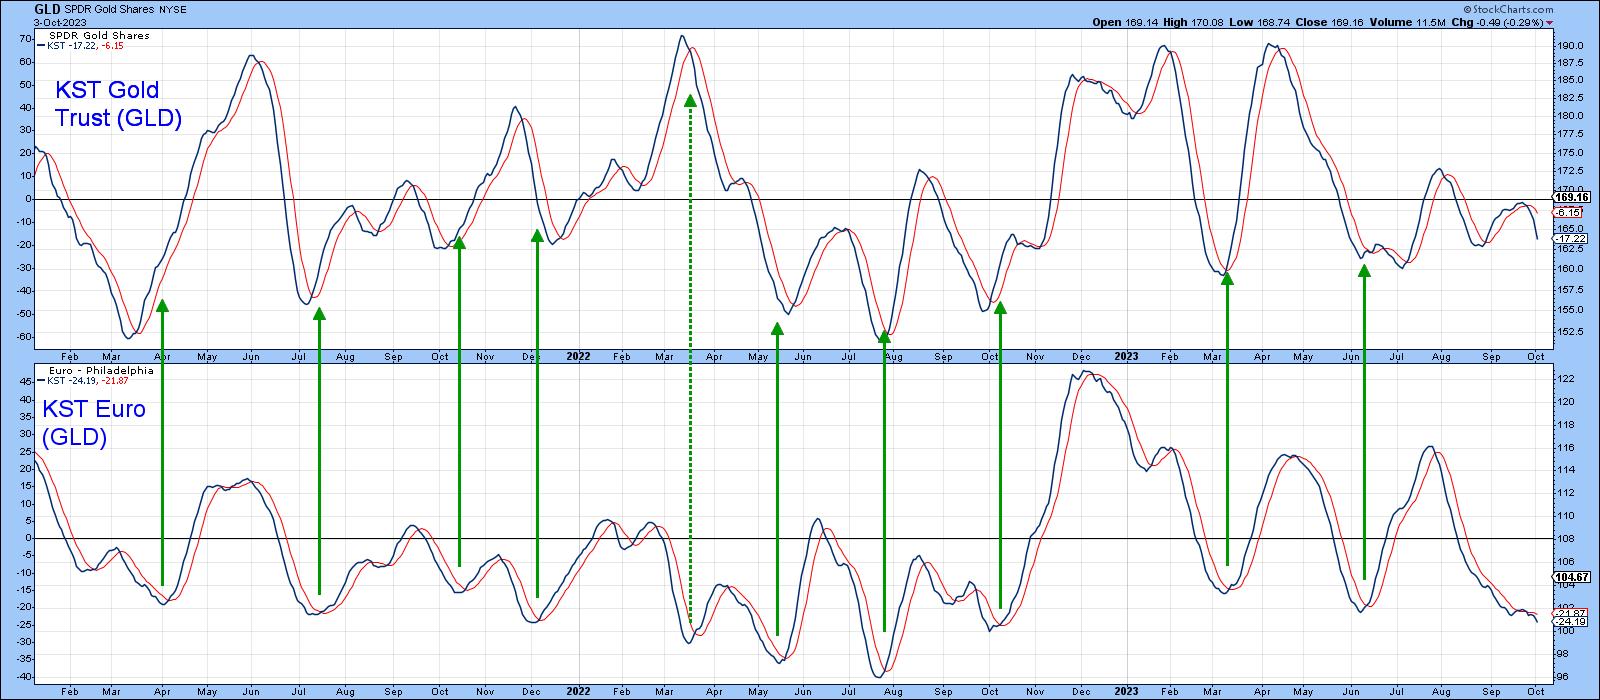
Most of the time, gold and the dollar move inversely, though when gold is particularly strong or weak, these two markets can move in the same direction. Chart 5 compares the daily KST of gold to that for the euro, the arrows indicating low points for the currency. Most of the time, they line up with the corresponding momentum bottoms for gold. The March 2022 bottom has been flagged by a dashed arrow, as it was juxtaposed with a gold high. This underscores the point that the two are not always in sync. Fast forward to the present, we can see the euro KST is deeply oversold. However, it has yet to trigger a buy signal, as is also the case with the gold KST. The yellow metal is nonetheless positioned for a reversal should it get a signal from the currency.
Copper
Copper and other commodities also tend to move inversely with the dollar. This is certainly true for the recent price action in Chart 6, as flagged by the solid green and red arrows. The two dashed ones between May 2022 and April 2023 reflect a decline for the inverse dollar, but a rangebound copper price. This again underscores the fact that the inverse relationship is not universal.
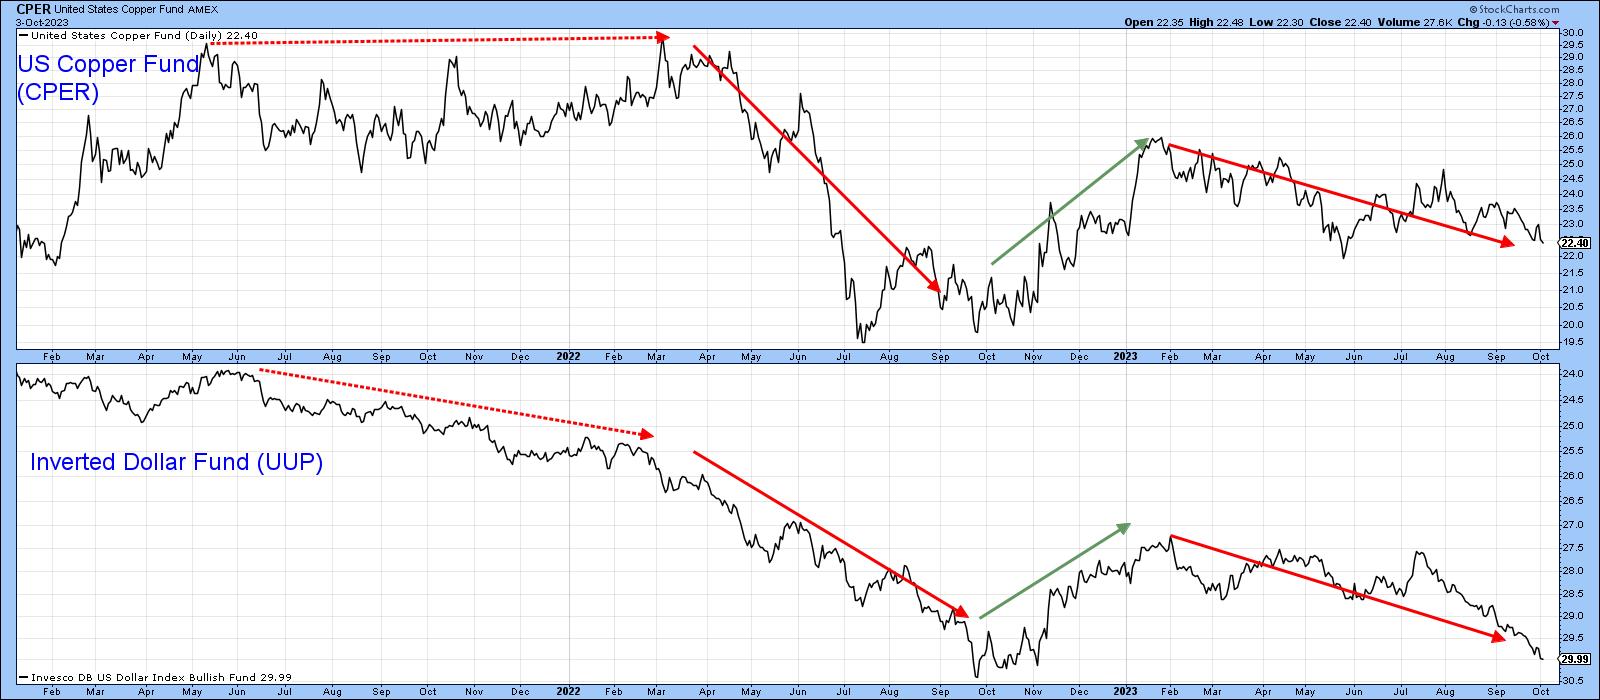
Chart 7 tells us that both copper and its Special K (SPK) are very close to significant down trendlines. The price trend is still negative, but would probably reverse on a dime if the two lines are violated on the upside. A reversal in the dollar's fortunes, even for a short period, could well be the catalyst for such a major trend reversal.

Conclusion
The strong dollar has been adversely affecting stocks, gold, and copper since mid-May. All three markets are to some degree oversold and the dollar is overstretched on the upside. It seems like a good idea to look for a dollar reversal, since these markets would likely respond with a rally.
Good luck and good charting,
Martin J. Pring
The views expressed in this article are those of the author and do not necessarily reflect the position or opinion of Pring Turner Capital Groupof Walnut Creek or its affiliates.


