This Country ETF Rallies Sharply After War Breaks Out
Understandably, most Middle Eastern country ETFs have performed poorly since the war broke out, but there is one noticeable exception, which I will get to later.
Israel
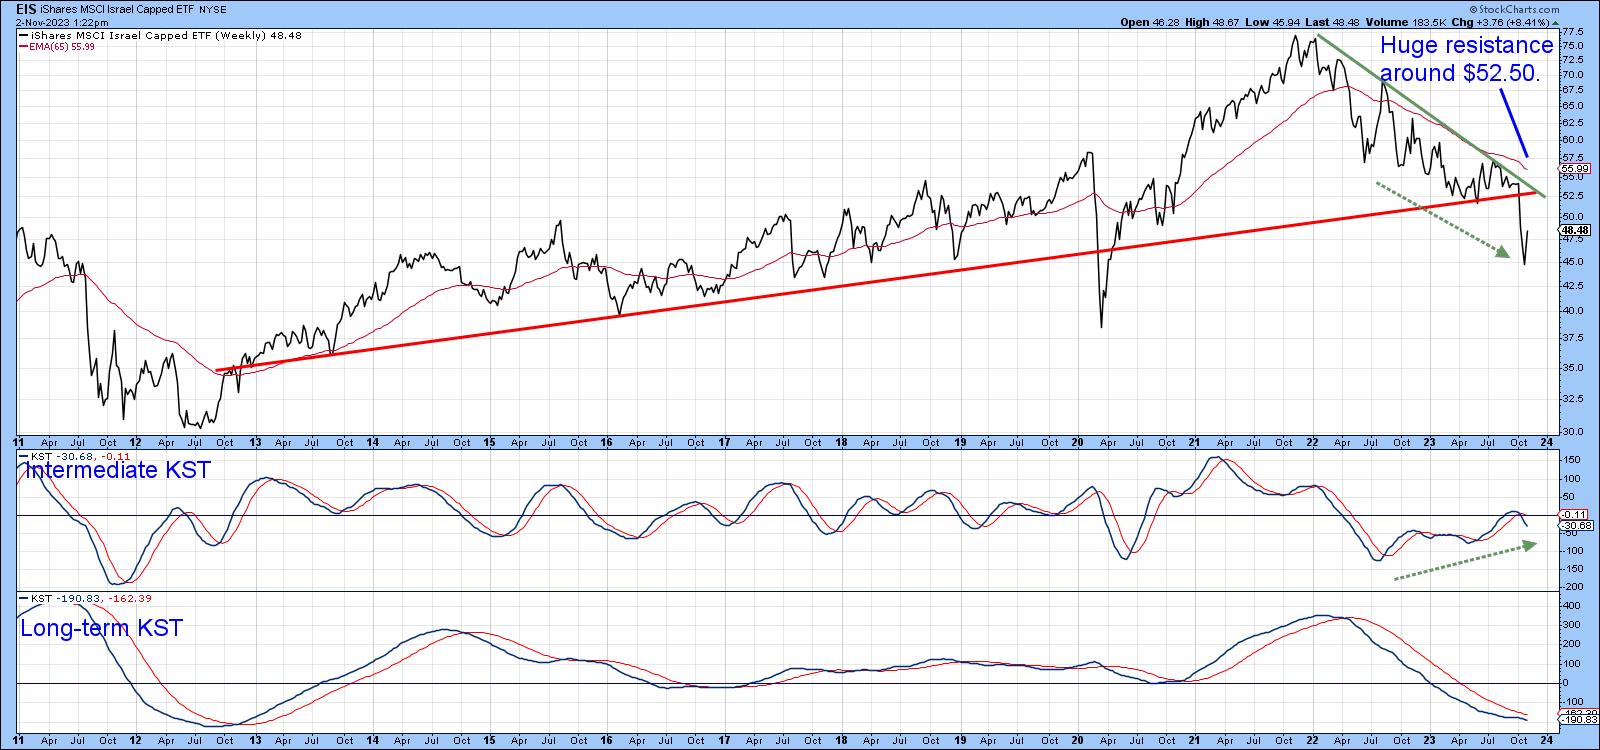
First, as might be expected, the iShares Israel ETF (EIS) has moved lower and completed what looks to be a massive top. The same thing happened in 2020, so it's not impossible that we will see another whipsaw, as the long-term KST is more oversold now than it was then. We do not know where the intermediate momentum will bottom out, but, so far, it is on track to experience a positive divergence with the price. However, until it can rally above the converging trendlines at $52.50, it seems wise to assume that the break is valid.
The Gulf States
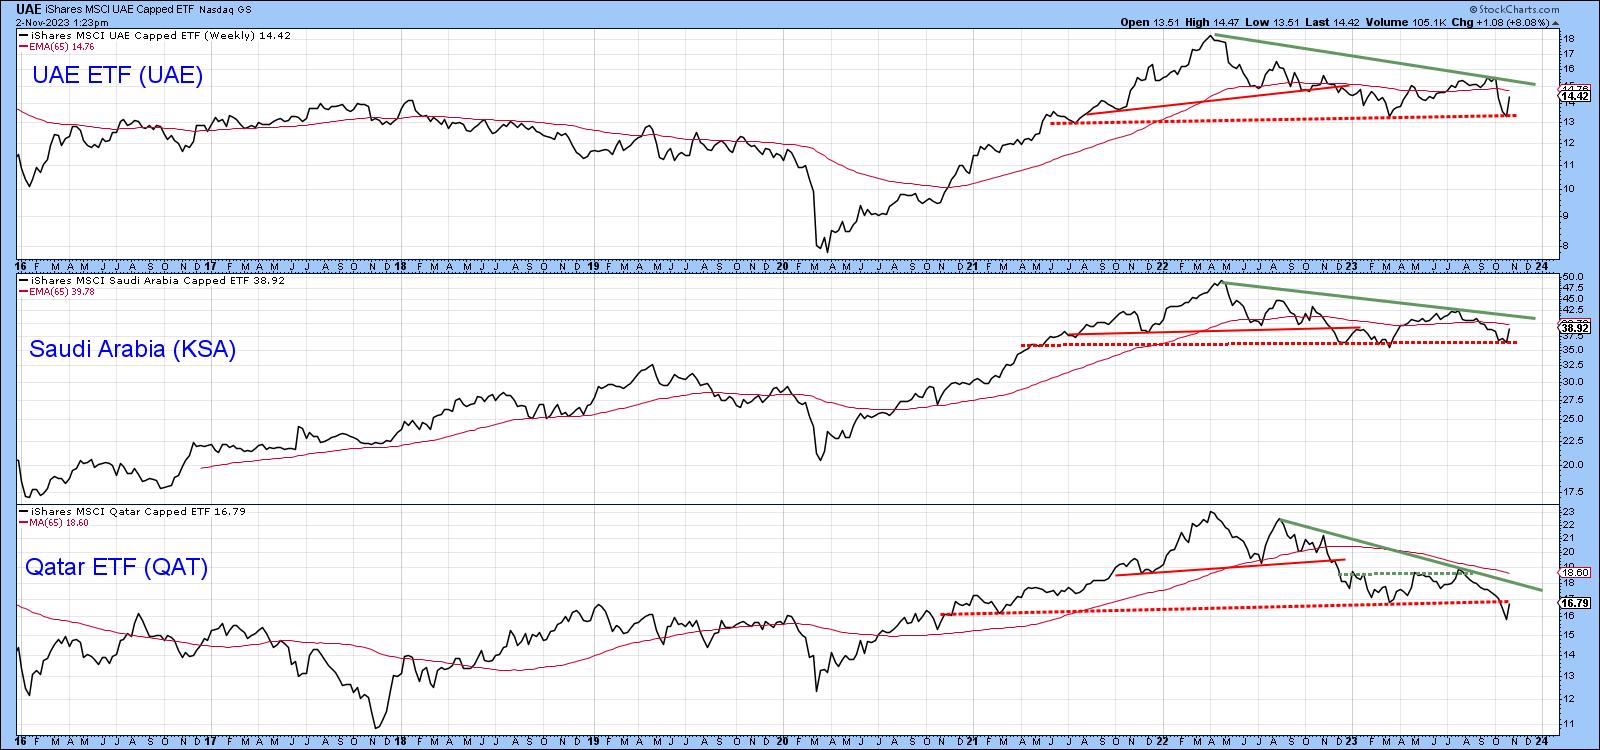
Chart 2 features the UAE, Saudi Arabia and Qatar. What is encouraging is the fact that all three broke down from tops in late 2022. However, none have followed through on the downside except Qatar. Even in its case, though, the price has rebounded and is right at its extended breakdown trendline. We are left with the possibility that all three will break down from what would be a 3-year top.
However, if the bad news of the last three weeks is not sufficient to cause a widespread breakdown, then we cannot rule out the possibility that these markets will rally above the three green down trendlines on expectations of an end to hostilities and a genuine peace. It's worth monitoring, since a failure of these tops would likely be followed by a significant bull market.
Egypt
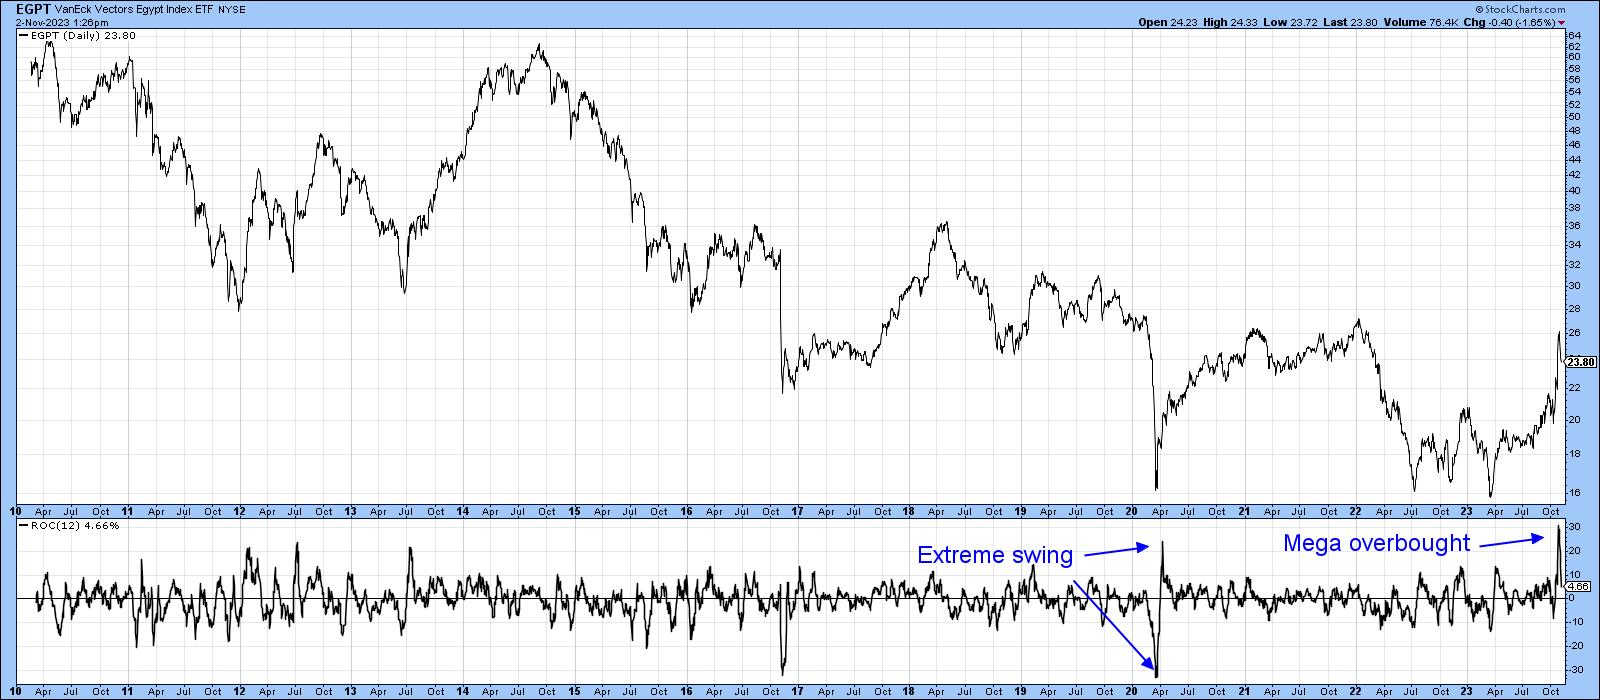
The real surprise is to see the much-maligned Egyptian ETF (EGPT) break explosively to the upside. According to the financial press, locally-based investors have started to view Egyptian stocks as a hedge against high inflation and a weakening Egyptian pound. Confidence has waned because the Central Bank of Egypt has devalued the Egyptian pound on three occasions since March 2022, and speculation of another one before the upcoming presidential elections has become widespread. A wall of worry if ever I saw one!
What we have seen is a 9-year down trendline violation and breakout from a 1-year base. This move has also been supported by all three KSTs, and that means it is likely to stick.
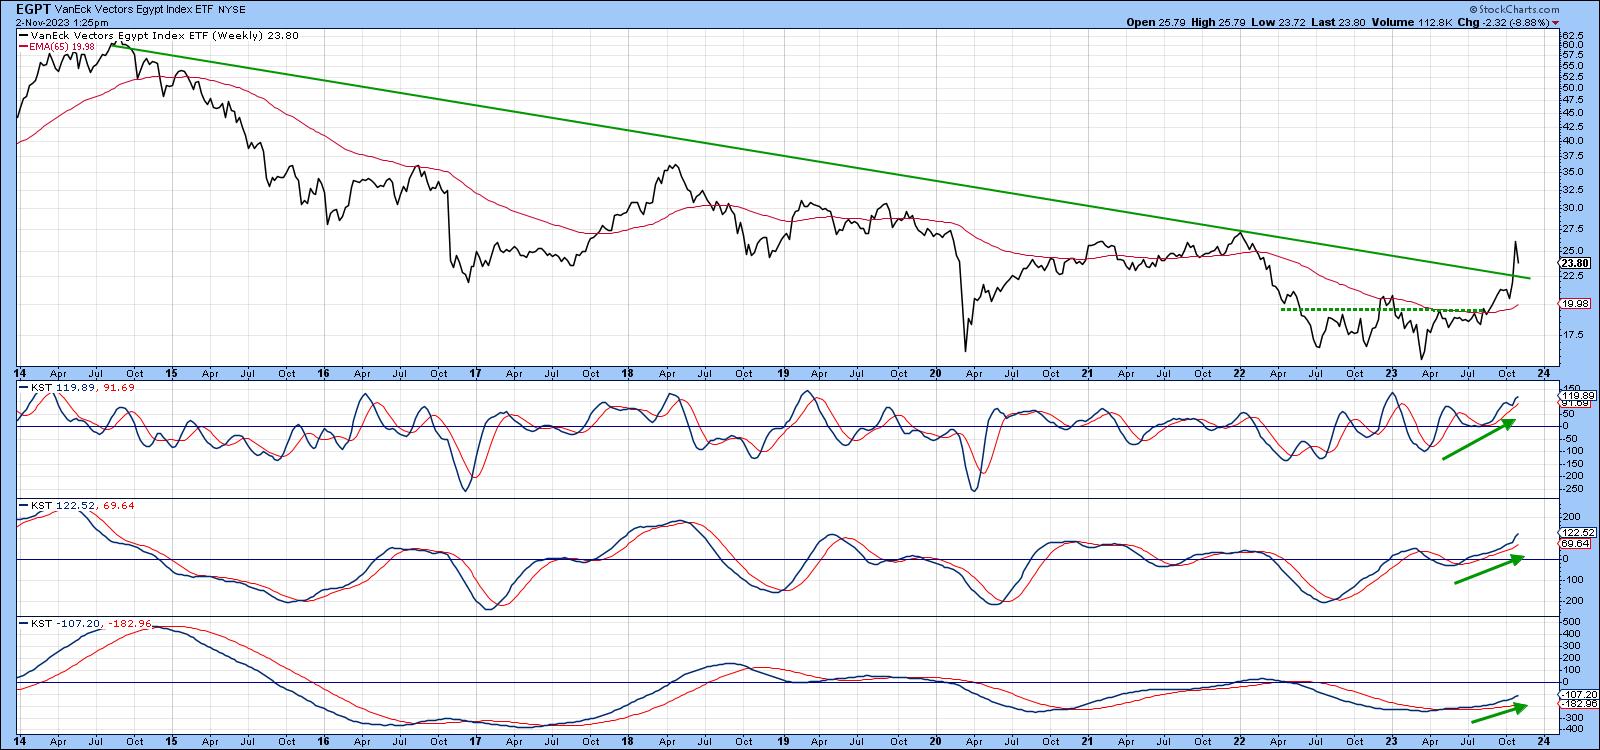
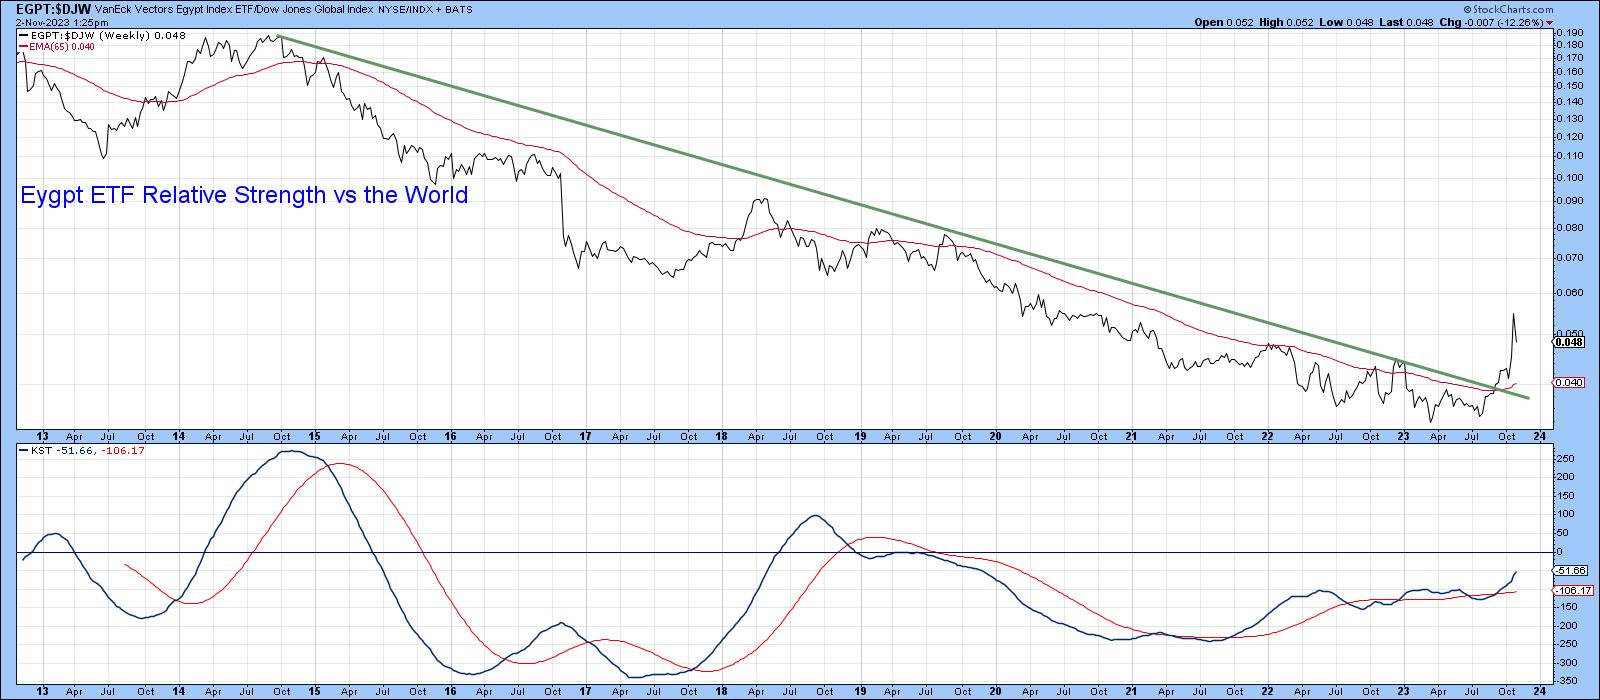
Chart 4 features the RS line against the Dow Jones World Index ($DJW). It, too, has violated a multi-year down trendline and crossed decisively above its 65-week EMA.
The most positive sign of all comes from Chart 5, which shows that the 12-day ROC experienced a mega-overbought condition as it reached a record high, surpassing the extreme swing high of 2020. For the record, a mega-overbought reflects a strong momentum (as opposed to breadth) thrust and is a reliable sign of a primary trend reversal. Mega-overboughts also need to be confirmed by price, and that's already happened with the trendline violation in Chart 3.
Message from Moscow
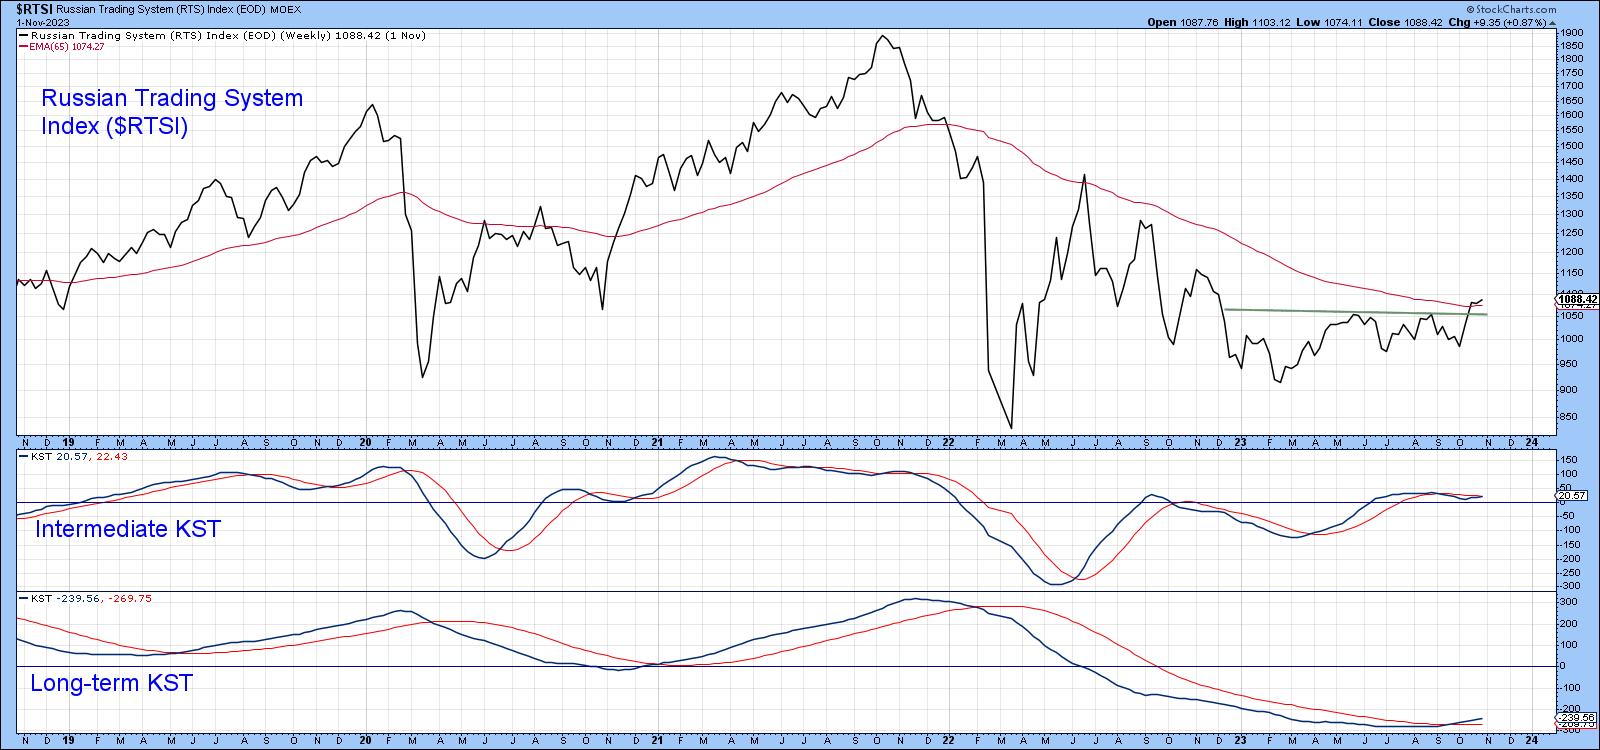
Recent technical action also looks positive for the Russian market, as it has broken to the upside in Chart 6. The Index is also north of its 65-week EMA and is being supported by a rising intermediate- and long-term KST.
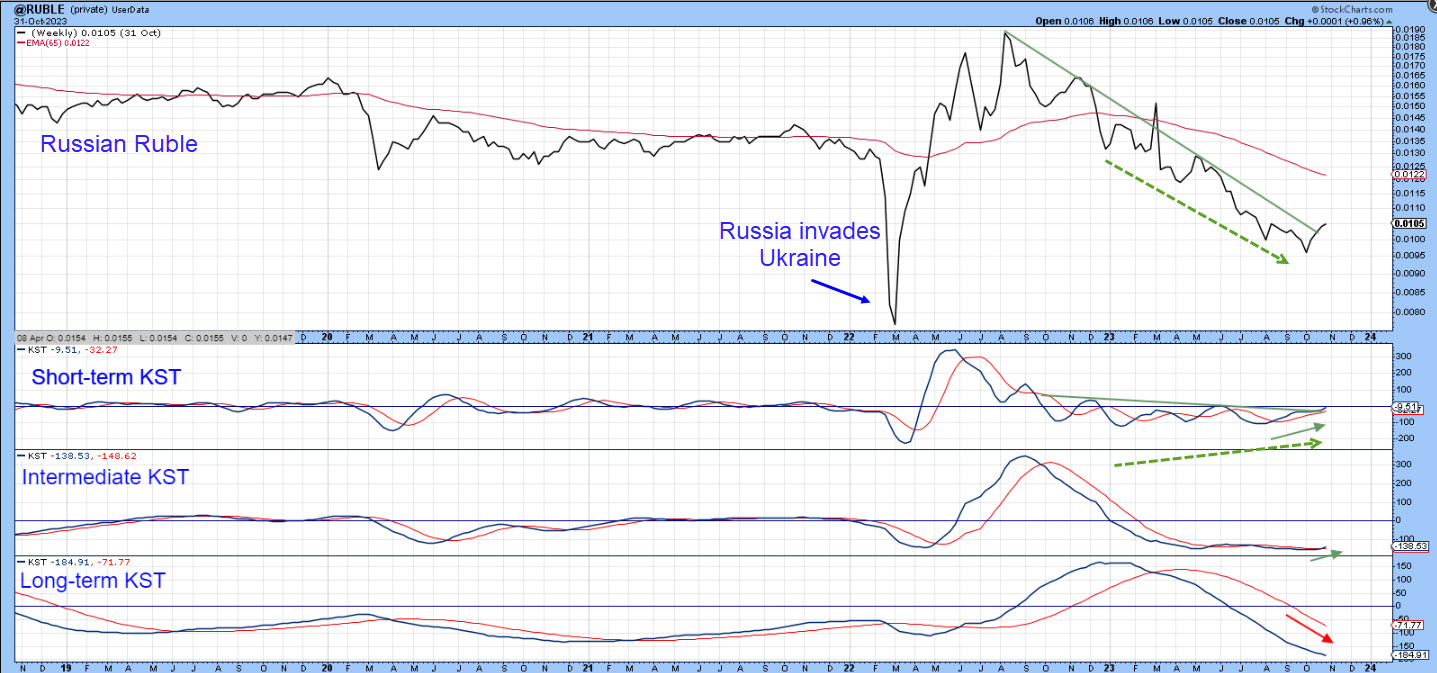
We cannot calculate relative action because of the volatile ruble, which is not part of the StockCharts database. However, it is possible to import data by way of a user index. This is featured in Chart 7.
The outbreak of war resulted in an initial sharp drop. The currency quickly rebounded to pre-invasion levels, but has been selling off ever since. More recently, a rally has enabled it to penetrate the 2022-23 down trendline. This breakout is likely to hold because the short-term KST is also breaking out of a base, having previously diverged positively with the price. Whether this action signifies a bull market for the ruble and the RTSI is open to question. However, those thinking that the Russian economy will continue to be a basket case may want to think again.
Good luck and good charting,
Martin J. Pring
The views expressed in this article are those of the author and do not necessarily reflect the position or opinion of Pring Turner Capital Groupof Walnut Creek or its affiliates.


