Three Markets That are Right At Significant Breakout Points
A lot of the time, I write articles that focus on markets or technical situations that should be monitored for a potential turn. This one is no different, except to say that these markets are not close to breakout points, but right at them. In short, it's fish-or-cut-bait time.
A Golden Break
We start off with gold, which looks as if it's about to break out from a giant consolidation inverse head-and-shoulders pattern. The Special K, which you can read about here, is also resting right at the neckline of a potential reverse head-and-shoulders pattern and slightly above its signal line.
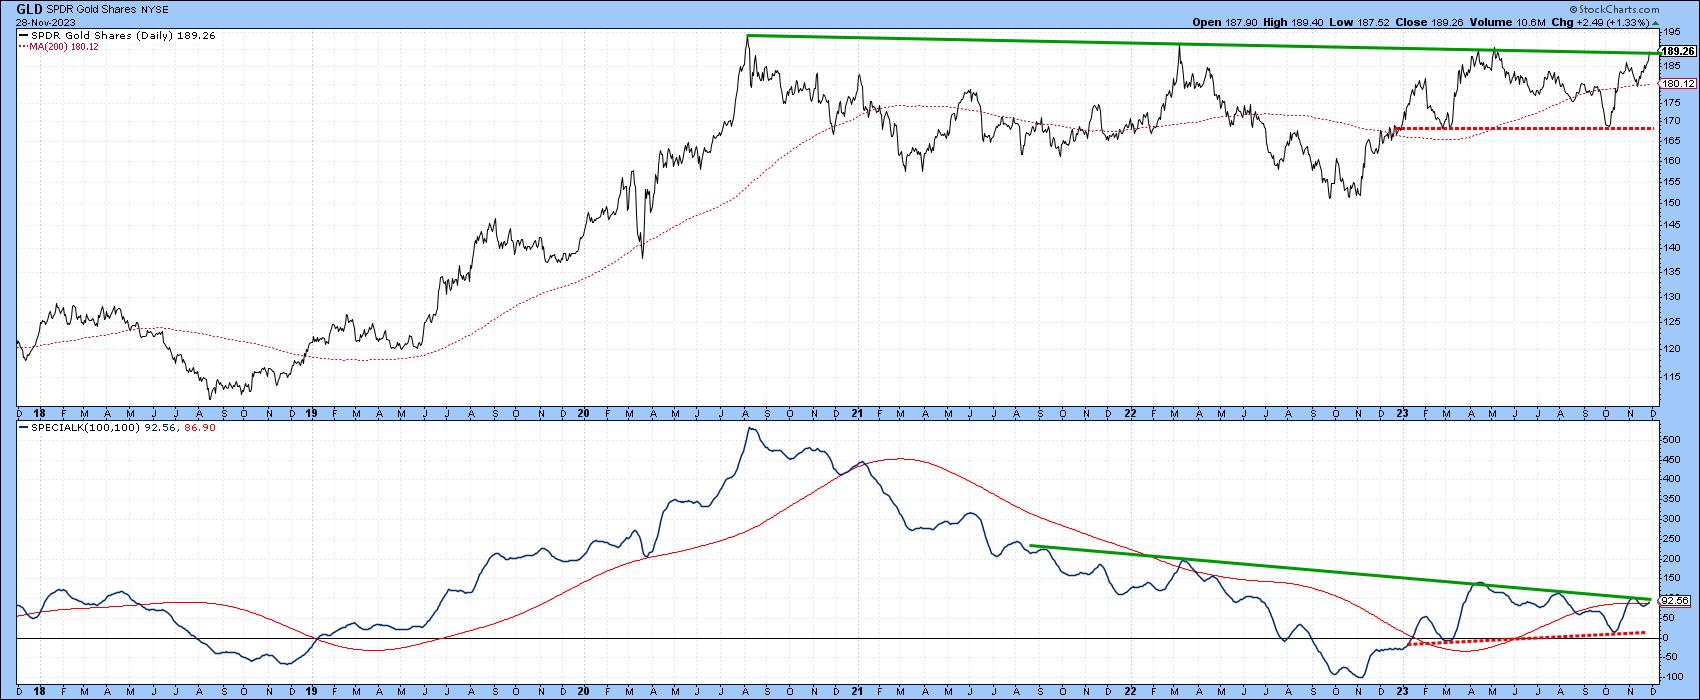
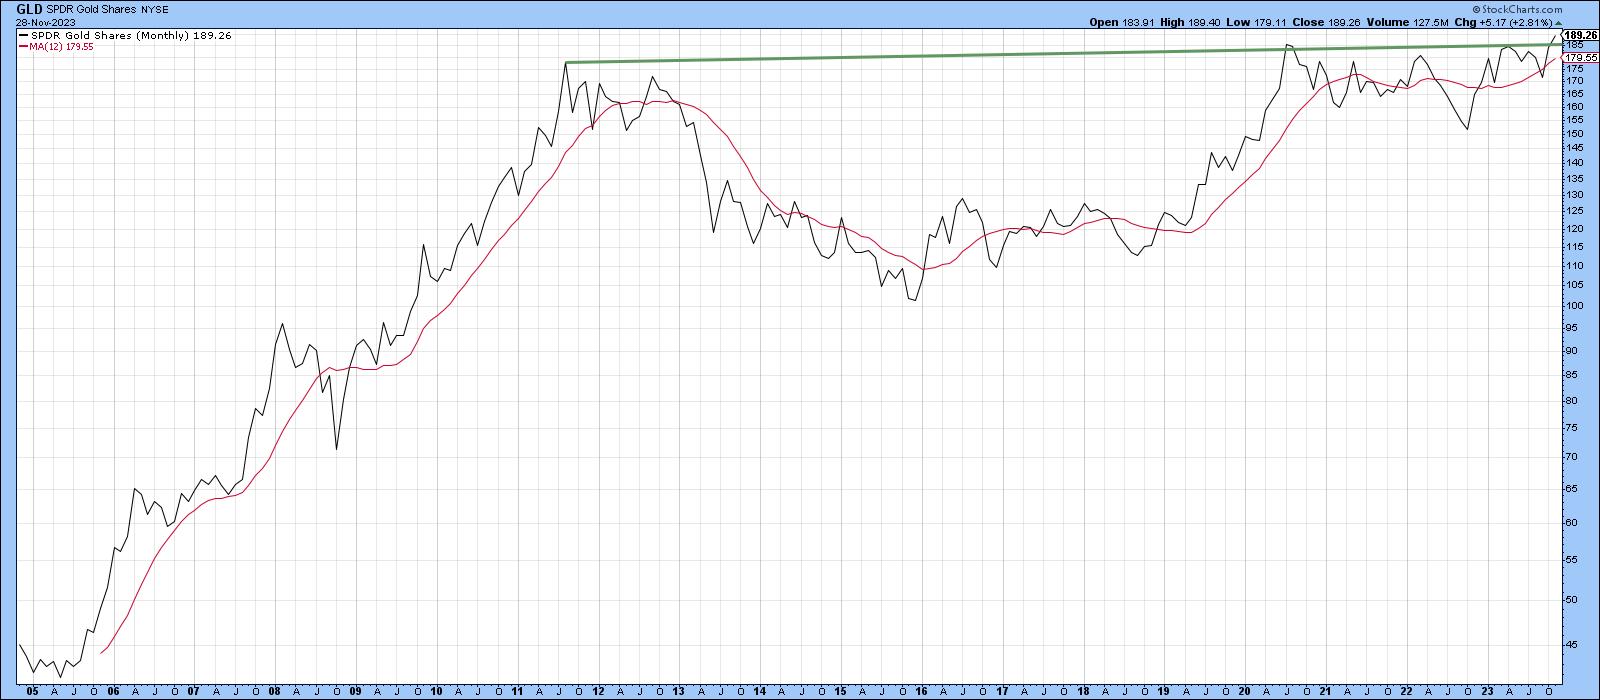
Chart 2 plots gold on a monthly basis, offering more in the way of a long-term perspective. In this instance, you can see that the price is breaking above an even more important long-term resistance trend line. We can't say it's a done deal, because this is a monthly chart, and thus requires end-of-month data for an official completion. There are three more sessions before the end of November. If a breakout does materialize at that time, it would have significant inflationary implications down the road. Remember, gold typically discounts future moves in commodity prices.
Dr. Copper About to Make a House Call?
Copper also appears to be breaking out, this time from a large symmetrical triangle. The Special K has already violated its 2022-2023 downtrend line. The chart also shows that, when a trendline violation in the Special K has been confirmed by one for the price, a meaningful reversal in trend has taken place.
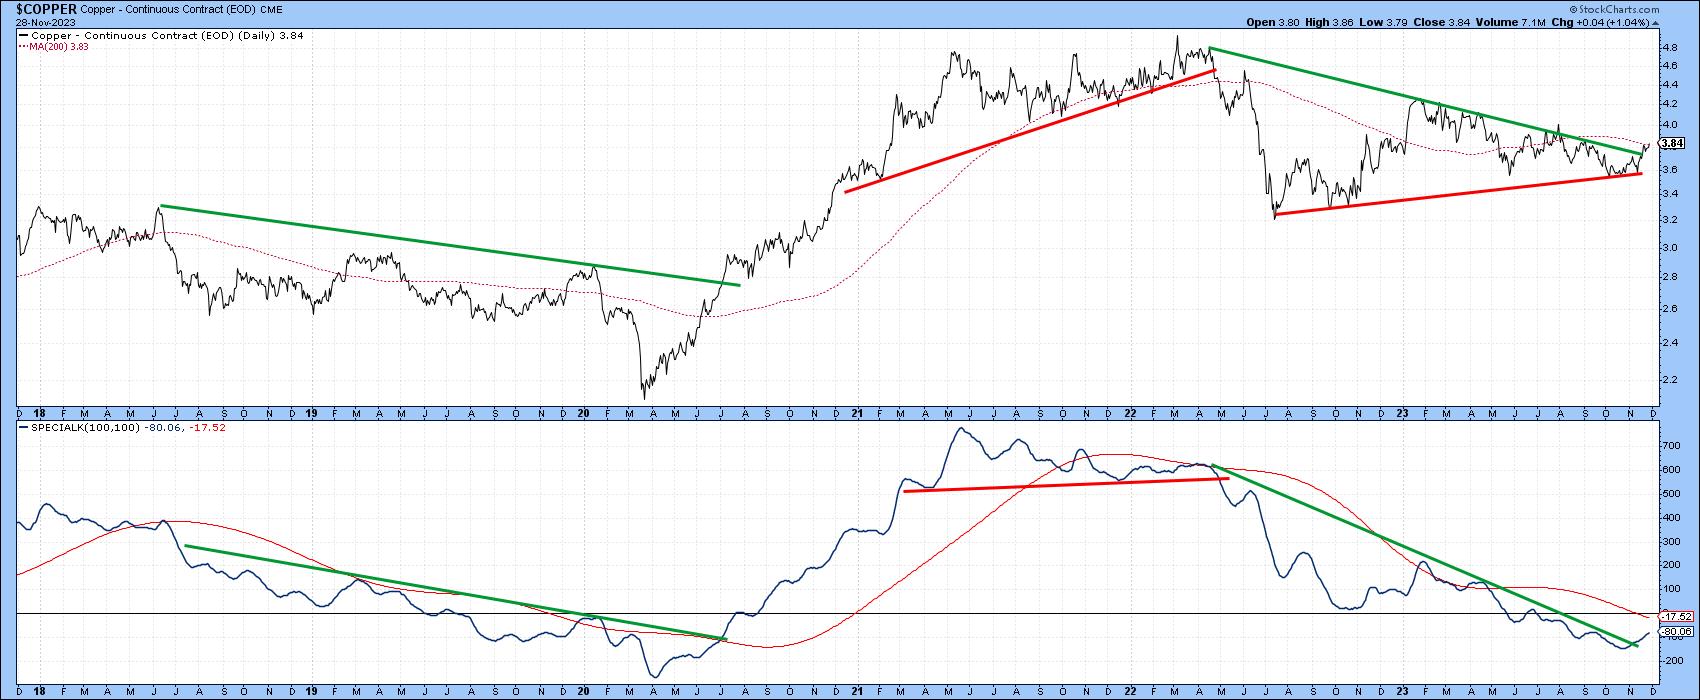
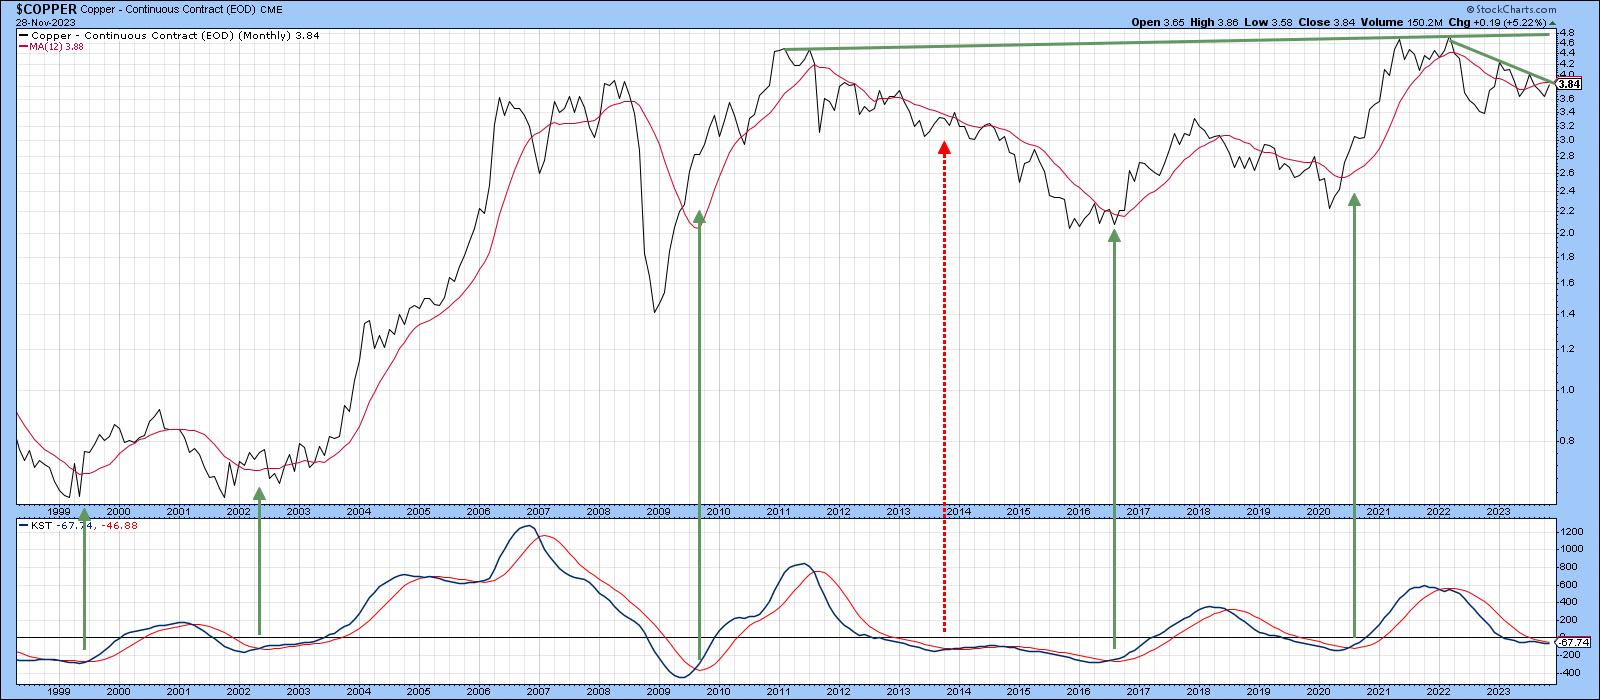
The likely breakout in the daily chart could have long-term implications as well. That's because the rally may well be strong enough to result in a serious assault on the trendline joining the 2011, 2021, and 2022 peaks. If a breakout does materialize, it will likely be supported by the long-term KST, which is poised to resolve its indecisive action of the last few months in an upward direction.
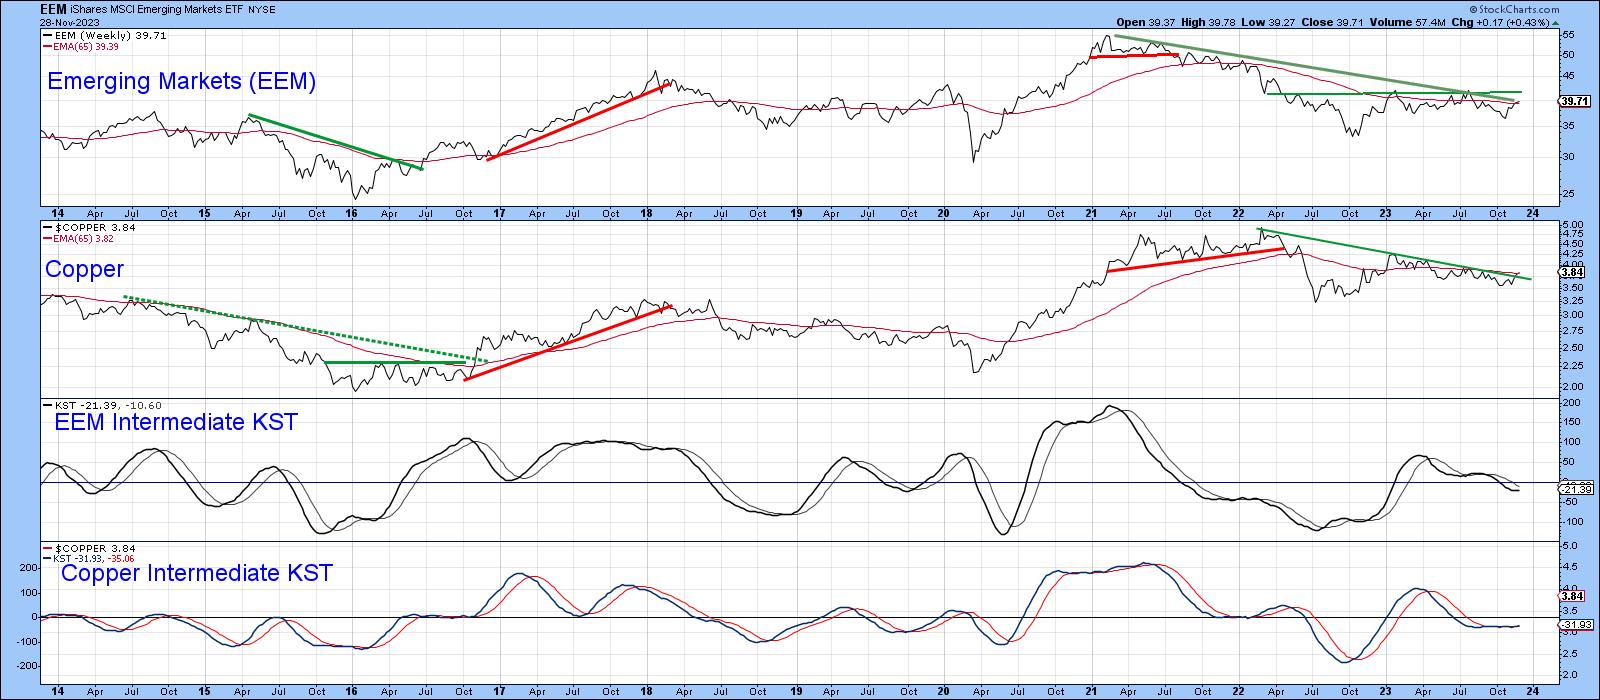
Not all emerging markets are commodity producers, but swings in the copper price do appear to affect the iShares MSCI Emerging Markets ETF (EEM), as indicated in Chart 5. The copper price may have broken out on the daily chart, but it has yet to do so on a weekly basis. In that respect, the second panel shows that the Friday NY close is positioned right at its down trendline and the 65-week EMA.
The two intermediate KSTs below tell us two things. First, in most situations, intermediate momentum swings for the EEM and copper are very similar. Second, both have flattened out and are poised for a possible important upside reversal. The price of the EEM, like that for weekly copper, is also right at its 2021-2023 down trendline and slightly above its 65-week EMA. Time for another breakout?
A Yen for Higher Prices
The yen was one of the markets I wrote about in mid-September, but not much has happened in the intervening period. Now things are beginning to look more interesting.
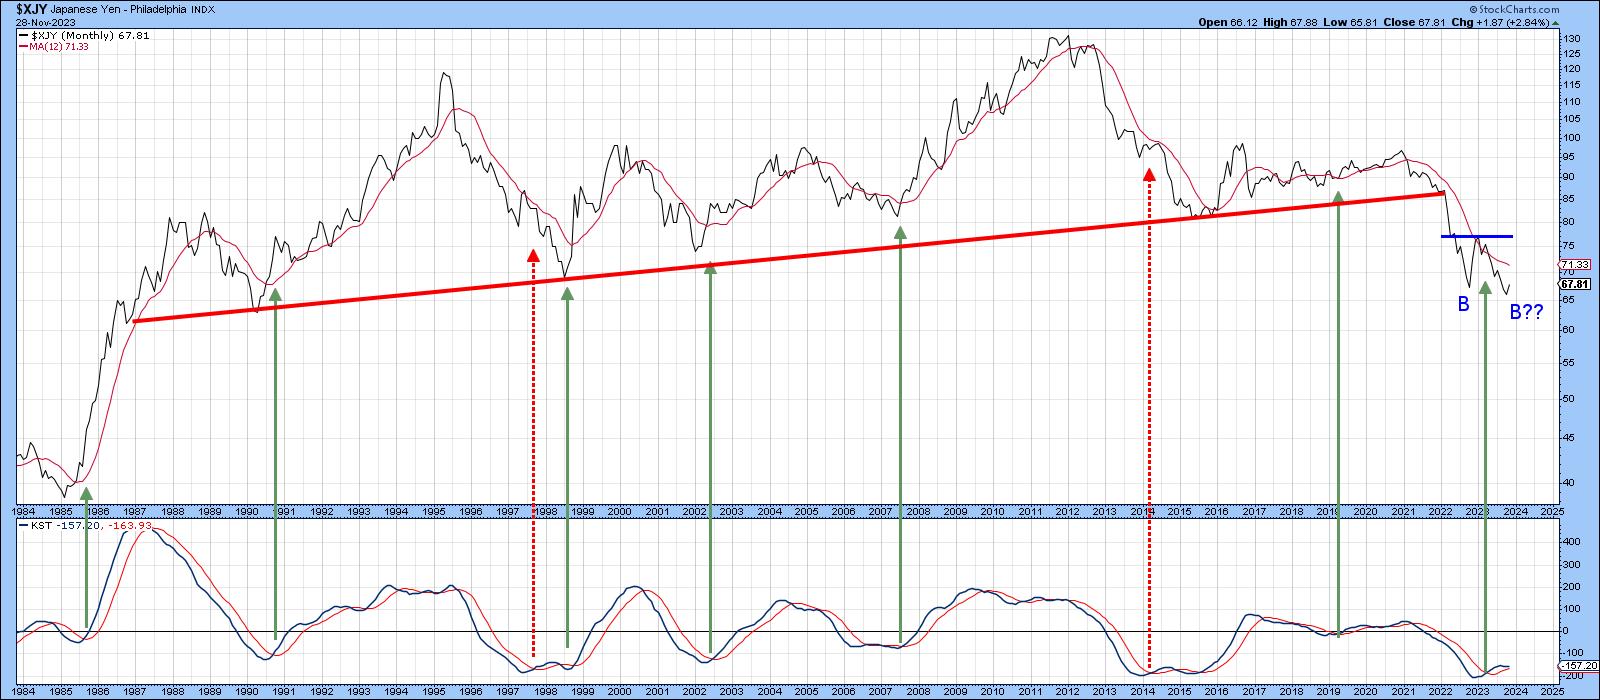
First, Chart 6 offers us some long-term perspective. The first thing to notice is the multi-decade trendline violation, signifying a secular reversal to the downside. My interest lies with the possibility the currency may be in the process of completing a double bottom formation. At the moment, it is below its 12-month moving average and has yet to experience a series of rising intermediate peaks and troughs, which means the main trend is still negative.
However, Chart 7 shows that the yen is right at its potential second bottom down trendline. The 13-week ROC has completed a base, which is positive. It is now literally right at its equilibrium point. The vertical arrows indicate that recent zero crossovers have been followed by important trend reversals. In addition, both the ROC and the PPO have diverged positively with the price, as flagged by the two green dashed arrows.
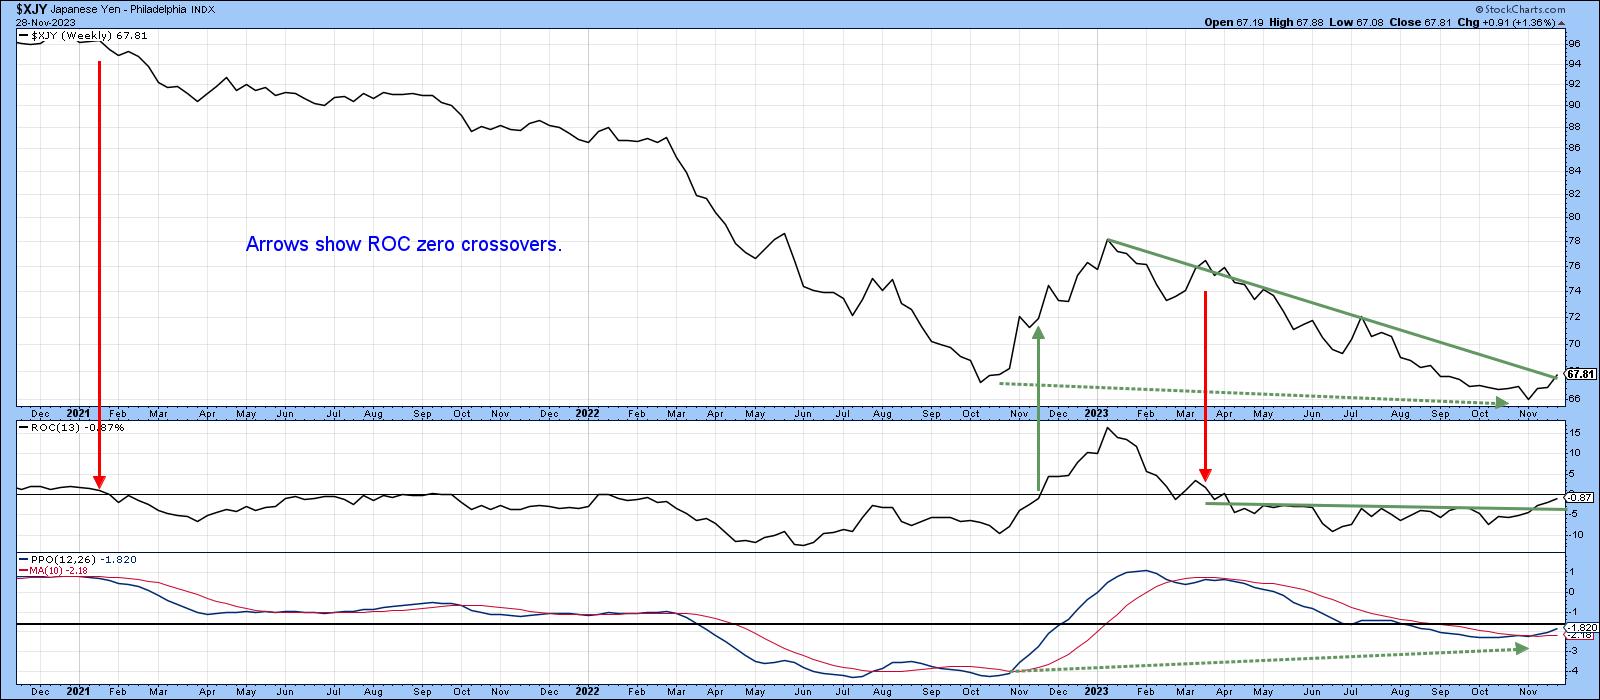
Note the PPO has also broken above its moving average. None of these events have long-term significance, as that would require the completion of a potential double bottom with a break above the early 2023 high, at the small blue horizontal line in Chart 6. That said, a decisive break above the green 2023 down trendline would certainly indicate the likelihood of a tradable rally, and that would be an important first step.
Good luck and good charting,
Martin J. Pring
The views expressed in this article are those of the author and do not necessarily reflect the position or opinion of Pring Turner Capital Groupof Walnut Creek or its affiliates.


