Are Financials Ready to Extend their Leadership?
Technology (XLK) and Communications Services (XLC) have been the leaders since the bull market began in October of last year. However, they may need to look over their shoulders, as financials have been creeping up since the October 27 intermediate low. The short answer to the question posed by the title of this article is that it's too soon to say. However, financials are certainly likely to be a worthy contender.
Let's look first at the absolute technical picture for financials, later drilling down to the relative aspects.
The Intermediate- and Long-Term Perspective
Chart 1 compares the Dow Jones U.S. General Financial Index to its long-term KST. You can see that the Index has found support at its secular uptrend line on no less than seven different occasions. The line is therefore hugely important not only because of this, but because it's a long one dating back to 2009.
Over the last few months, the KST has been flat at around zero, thereby reflecting a very finely balanced technical position. If the Index can now rally above the small green resistance line, it would, in all likelihood, push the long-term KST into a positive mode, thereby clearing the way for a robust bull market.
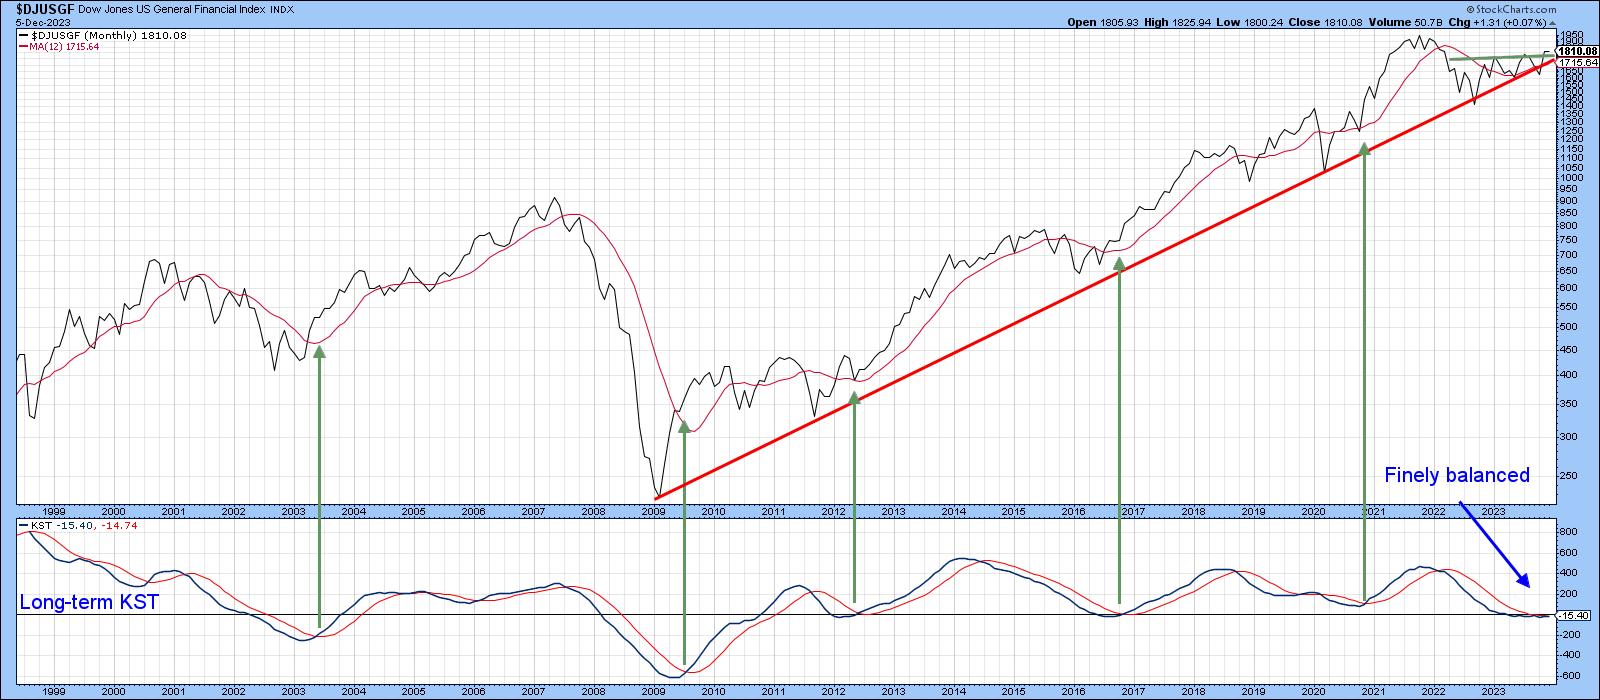
Chart 2, which compares the SPDR Financial ETF to the Special K, supports this possibility. That's because this indicator has violated its 2022-2023 downtrend line and crossed above its signal line. This combination is usually sufficient to trigger an important reversal in trend. More to the point, the price itself has confirmed this action by violating a key downtrend line of its own.
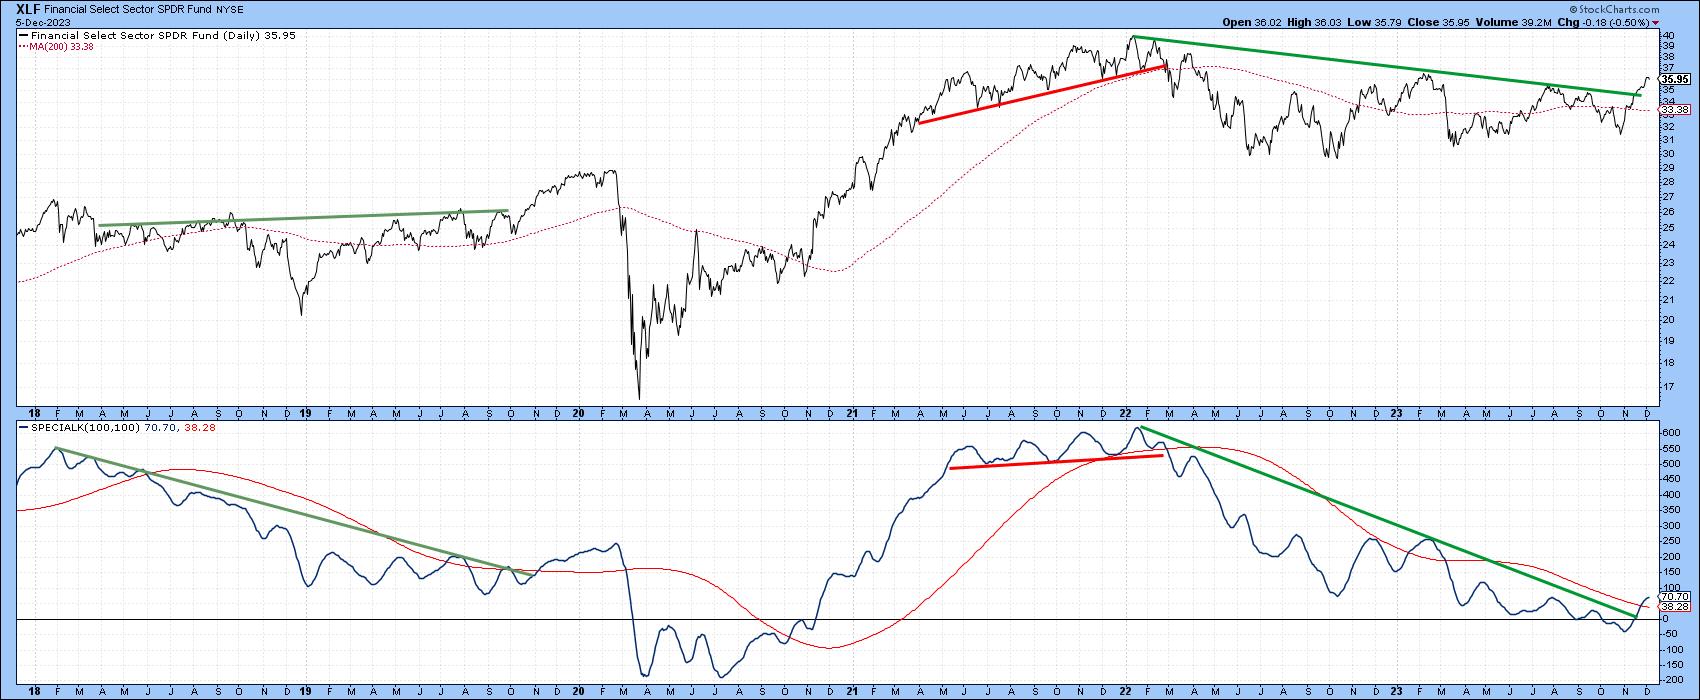
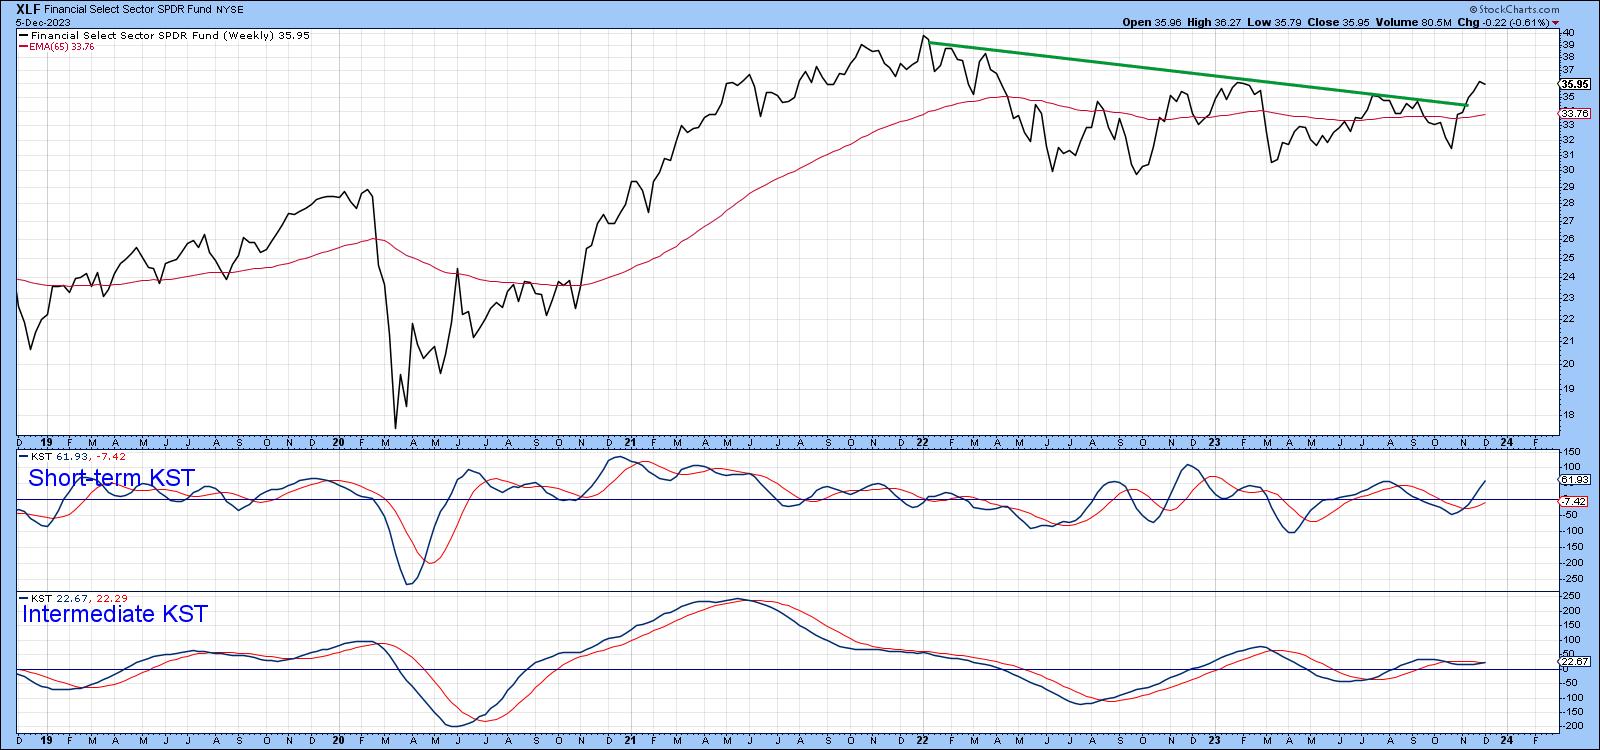
Chart 3 also looks positive, since both momentum indicators are bullish and are in no way overextended.
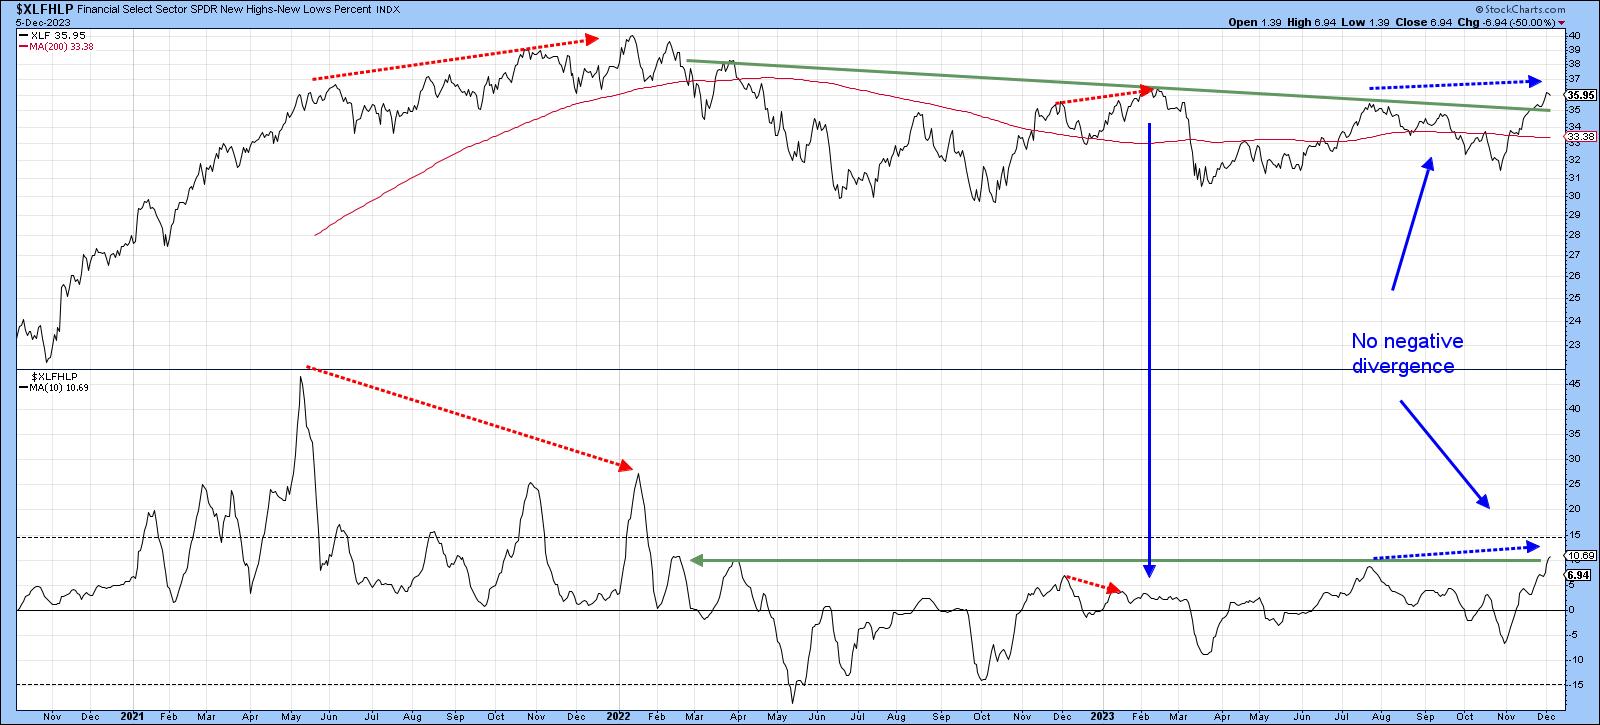
Finally, Chart 4 shows that this sector has some breadth going for it, since the 10-day MA for net new financial highs has touched a slightly higher level than at any time since early 2022. Also, compare the substantial number of financial stocks breaking out to new highs now to the paucity at the February 2023 peak. It's important to note that net new highs usually diverge negatively with the price at the final price peak; we see a couple of examples flagged by the red dashed arrows. Since the latest reading in the ratio is higher than the level reached in August, no such negative divergence currently exists.
Relative Action
The recent relative action against the S&P Composite is featured in Chart 5, where we can see a positive breakout from a 7-month base. This is being supported by positive short- and intermediate-term KSTs. Both momentum indicators look as if they are in the early phase of a rally and are currently in a similar position to that which preceded the early 2021 relative rally.
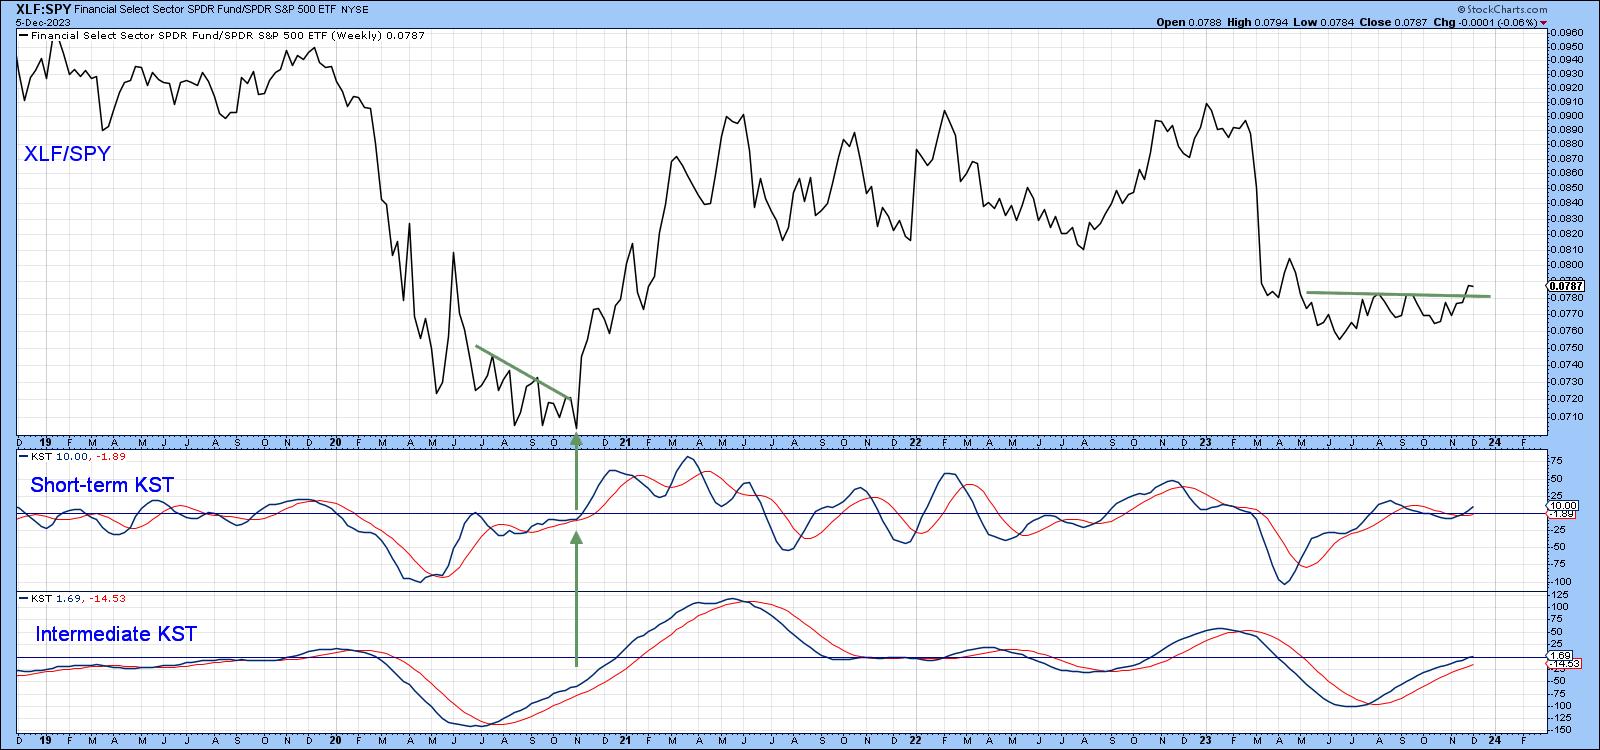
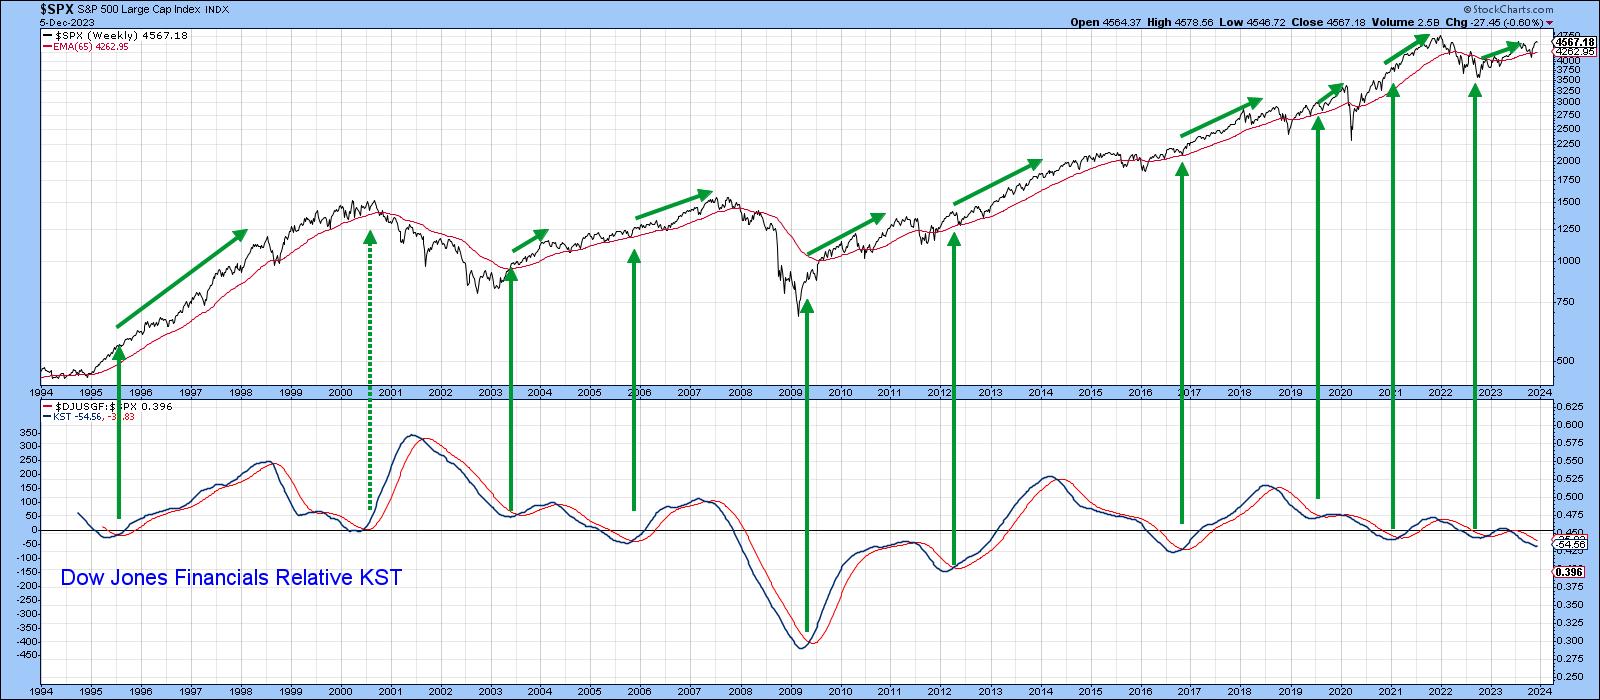
The long-term KST for relative action is not yet bullish, as we can see from the bottom window in Chart 6. That's important, because the green arrows demonstrate that rising long-term RS momentum is usually associated with a rising stock market. It's not a necessary condition, because there are periods when the KST is declining and stocks advancing. However, it is helpful as a tail wind for a stronger S&P Composite. Consequently, an upside reversal would be a welcome development.
Finally, Charts 7 and 8 pit financials (XLF) against technology (XLK). A rising ratio means financials are outperforming technology, and vice versa for a falling ratio. This relationship has been in a long-term decline since 2007 and remains below the secular down trendline and 48-month MA. The KST has flattened, but is still bearish. This leads us to conclude the secular trend is negative, despite the fact a double bottom could be forming. The red arrows, by the way, indicate the two instances when the trendline and MA were intersecting and how they reflected highly significant resistance. These two indicators are reasonably close currently, which means their joint upside violation would go a long way towards signaling a reversal in the secular trend.
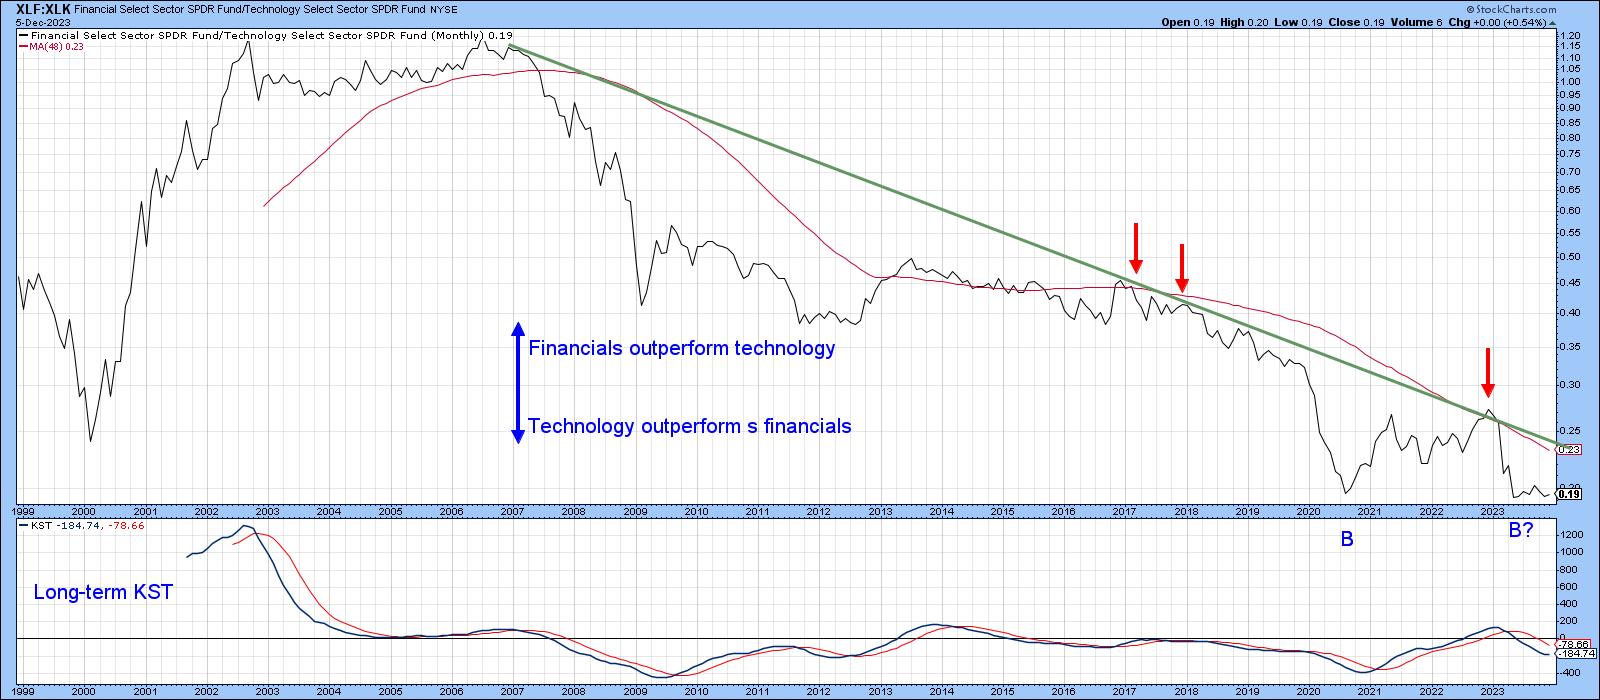
Chart 8 focuses on more recent data, where you can see that the short and intermediate KSTs have gone bullish. The dashed green arrows indicate the probability of a positive divergence. Divergences are meaningless until confirmed by the price. In this instance, that would come with a break above the 2023 down trendline, which the positive KSTs deem likely.
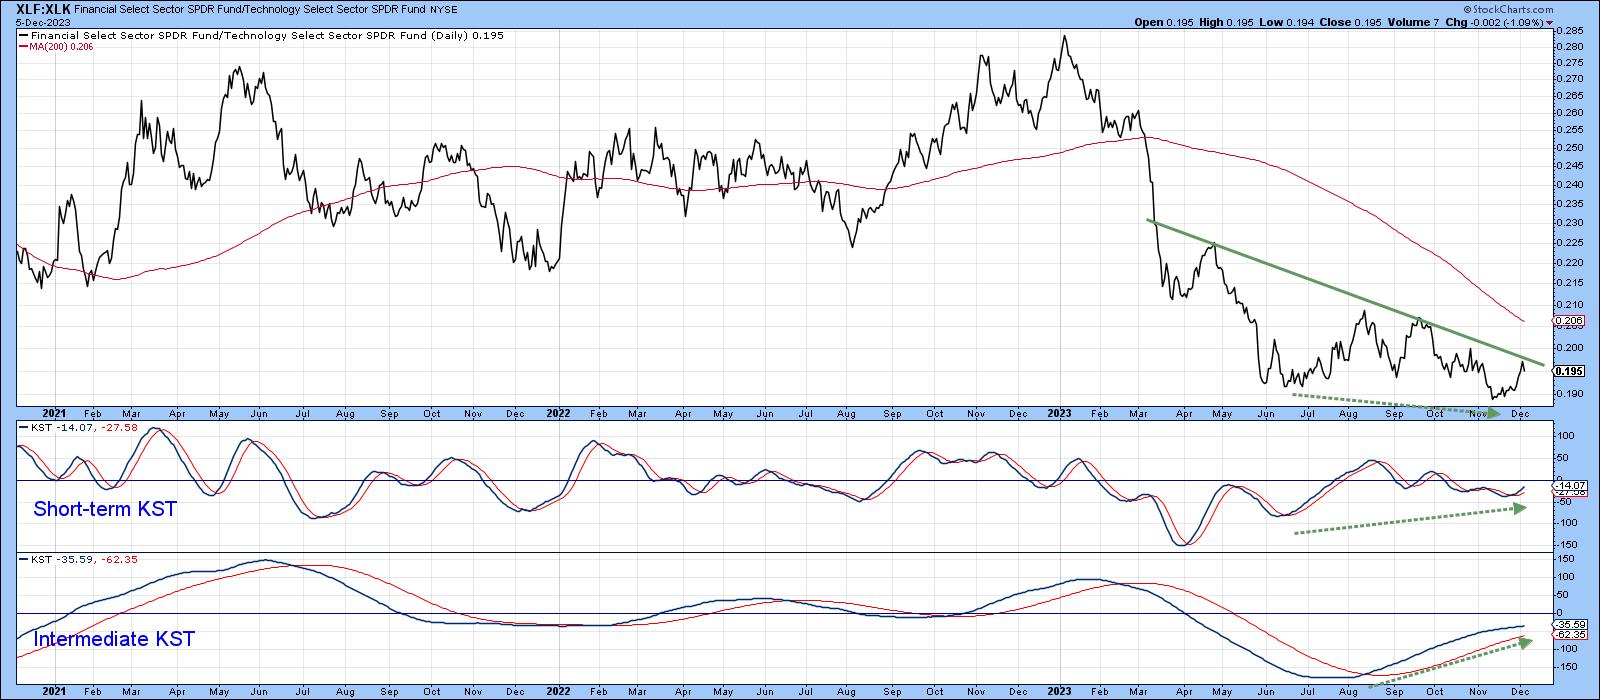
Such action would not signal a reversal in the secular trend, but would probably mean technology taking a temporary back seat against financials. Since the long-term indicators are signaling a bull market, that would probably mean a rally in both sectors going into year-end, with financials coming out on top.
Good luck and good charting,
Martin J. Pring
The views expressed in this article are those of the author and do not necessarily reflect the position or opinion of Pring Turner Capital Groupof Walnut Creek or its affiliates


