Maybe It's Time for a Santa Claus Rally... in the Dollar
I like to start off my approach to any market by taking a look at the long-term trend. That's because a rising tide not only lifts all boats, but the direction of the long-term trend determines the characteristics of those below it. For example, if the primary trend is up, the magnitude of short-term moves tends to occur on the upside, whilst short-term corrections are relatively brief. The opposite would be true for a downtrend.
Chart 1 represents a quarterly plot for the US Dollar Index. The oscillator in the lower panel is a Coppock Curve. The green shadings represent periods when the Coppock is above its six-quarter moving average; that relationship is currently in a bullish mode. It's also worth noting the Index itself is also trading above its 16-quarter (4-year) moving average. This timespan is by no means perfect, but, as you can see from the red and green arrows, the moving average has turned back a number of rallies and reactions, and is therefore a good dynamic level of support and resistance.
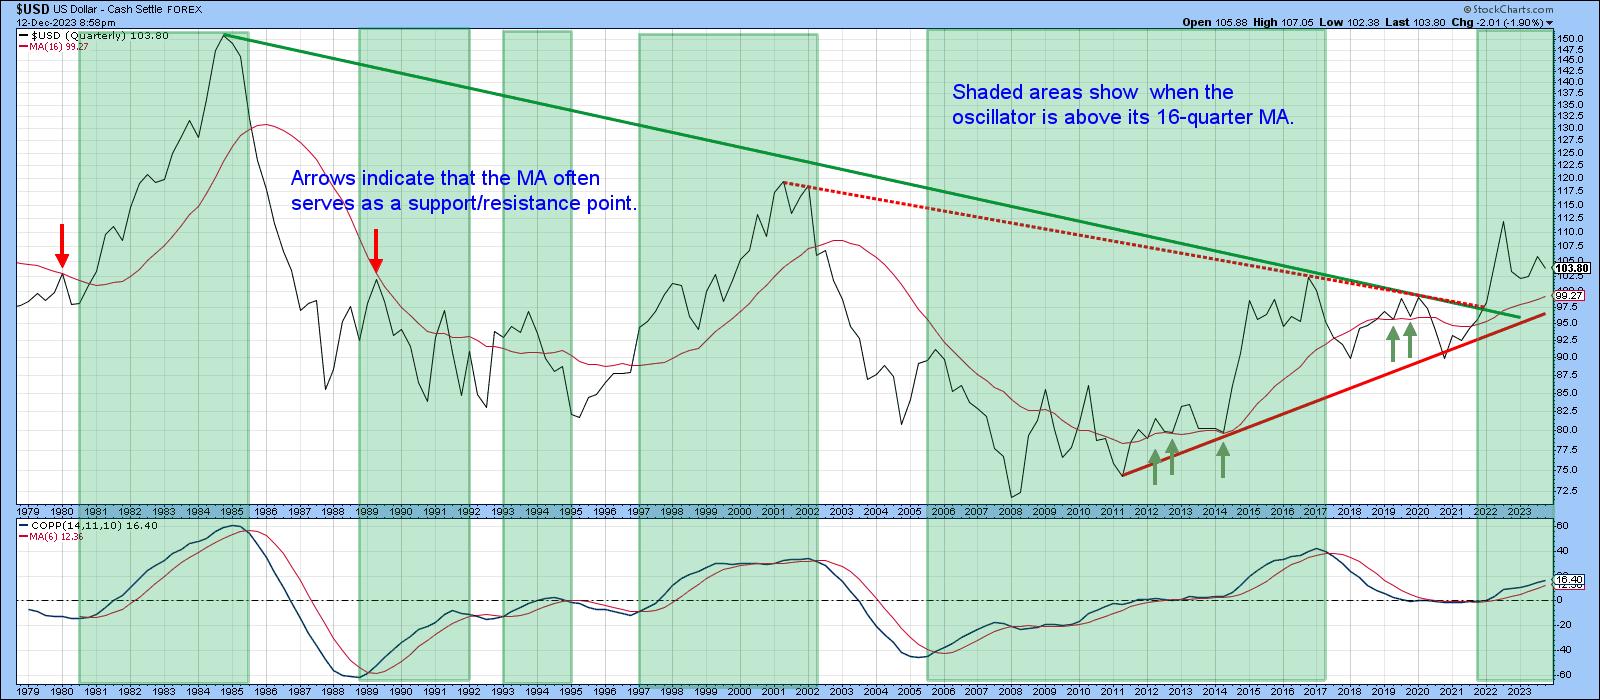
Chart 2 also supports the idea that the Dollar Index is in a primary bull market. First, it has once again held at its 24-month moving average, where it needs to find support. Second, the behavior of the RSI in the lower window is consistent with bull market characteristics. That's because it has recently reached and maintained an extreme overbought condition. Compare that action to the bear market period between 2003-2008, when it suffered extended periods of oversold readings. Note the Index has fallen substantially from its 2022 peak, and yet the RSI has barely dropped below zero.
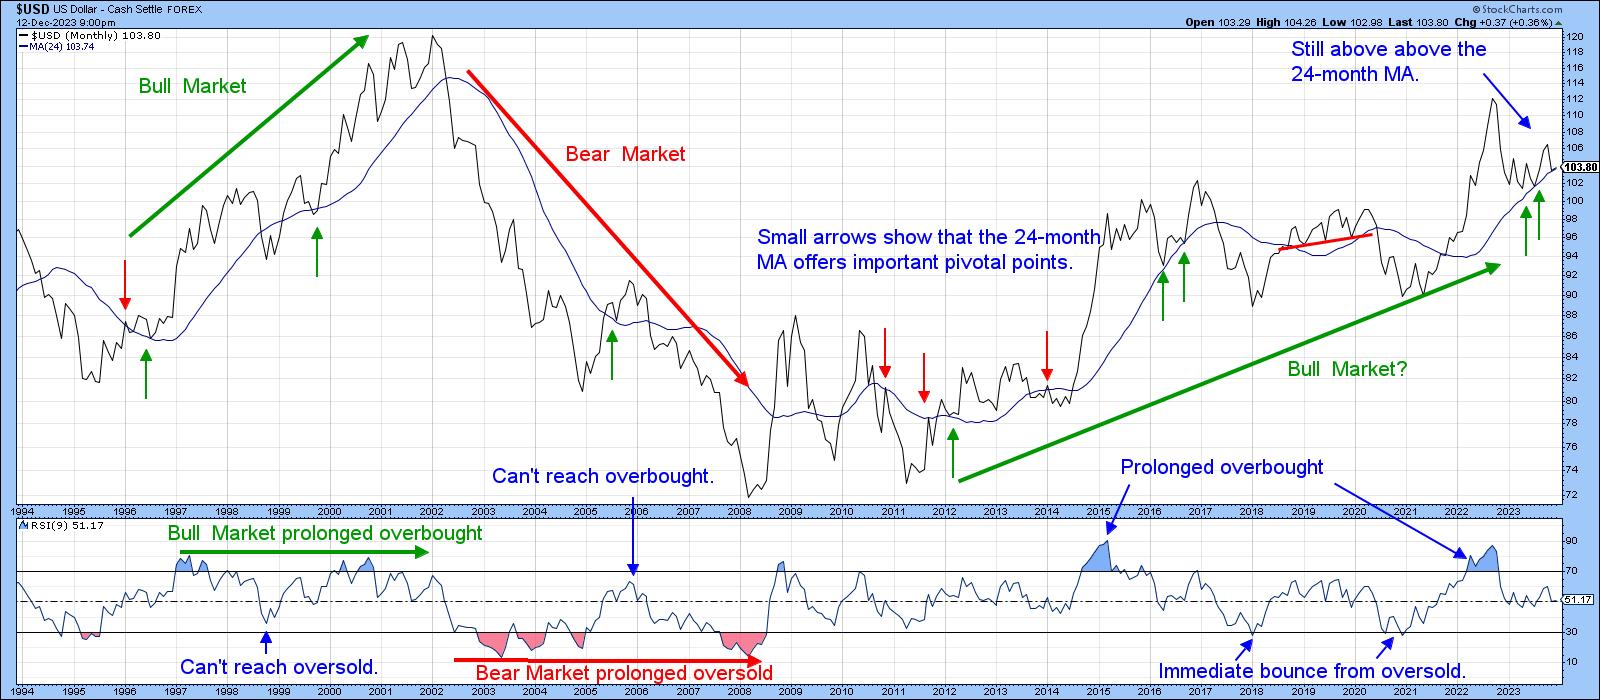
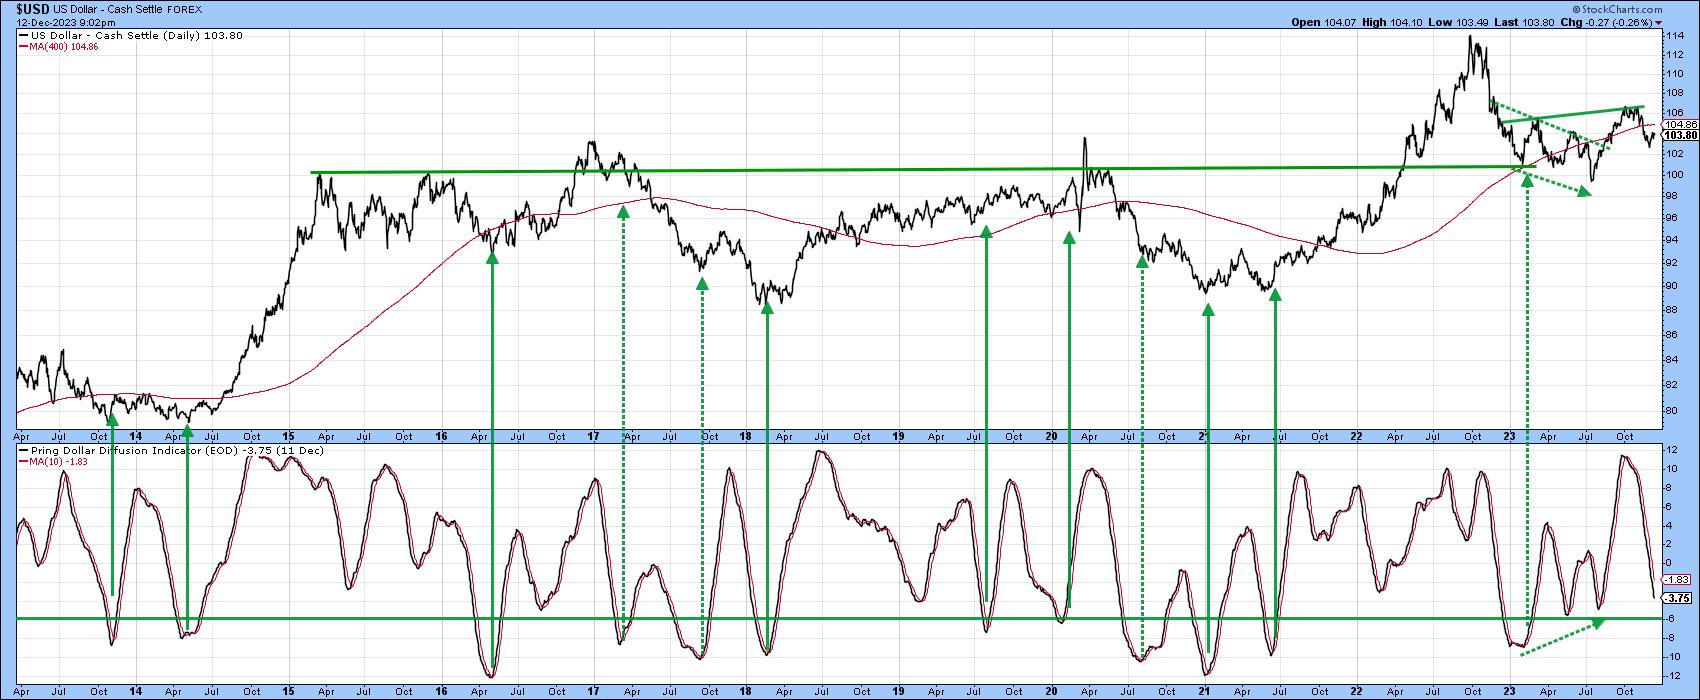
Chart 3 compares the Index to my Dollar Diffusion indicator, which monitors a universe of cross-dollar relationships in a positive trend. The arrows flag instances when the oscillator drops to the green horizontal oversold line and reverses to the upside. The solid ones identify when such action has been followed by a rally or extended trading range. The dashed arrows indicate failed signals when the subsequent rally was sub-par. The smaller green dashed arrows indicate that a positive divergence developed between the Index and the oscillator in the first half of 2023. It was also confirmed by a penetration of the dashed green down trendline. Right now, the indicator is declining and has yet to trigger a buy signal. That could mean a probing of the November lows before moving higher.
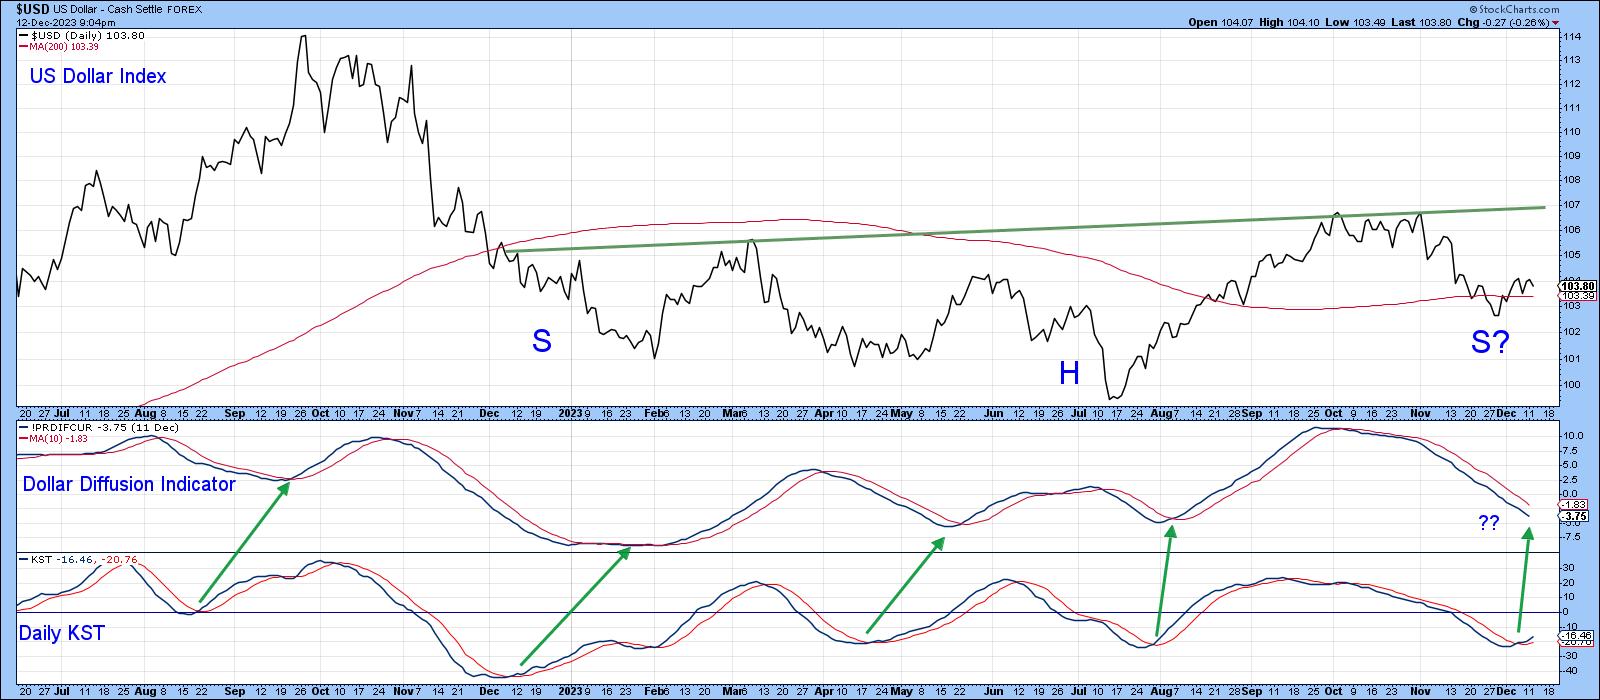
Even so, Chart 4 demonstrates that the daily KST for the Index has a strong tendency to lead the diffusion oscillator. That does not mean the oscillator is guaranteed to follow an already positive KST. However, it seems likely it will, as the Index itself has already regained its 200-day MA. The real challenge, though, lies at the neckline of a potential reverse head-and-shoulders pattern, which is currently around 107.
What Markets Could be Affected by a Dollar Rally?
Swings in the dollar do not necessarily cause other markets to rally or sell off, because they are influenced by a host of factors. Movements in the dollar, though, can and do act as a tail or headwind for a move that was likely to take place anyway. Right now, there are two areas worth monitoring in this regard.
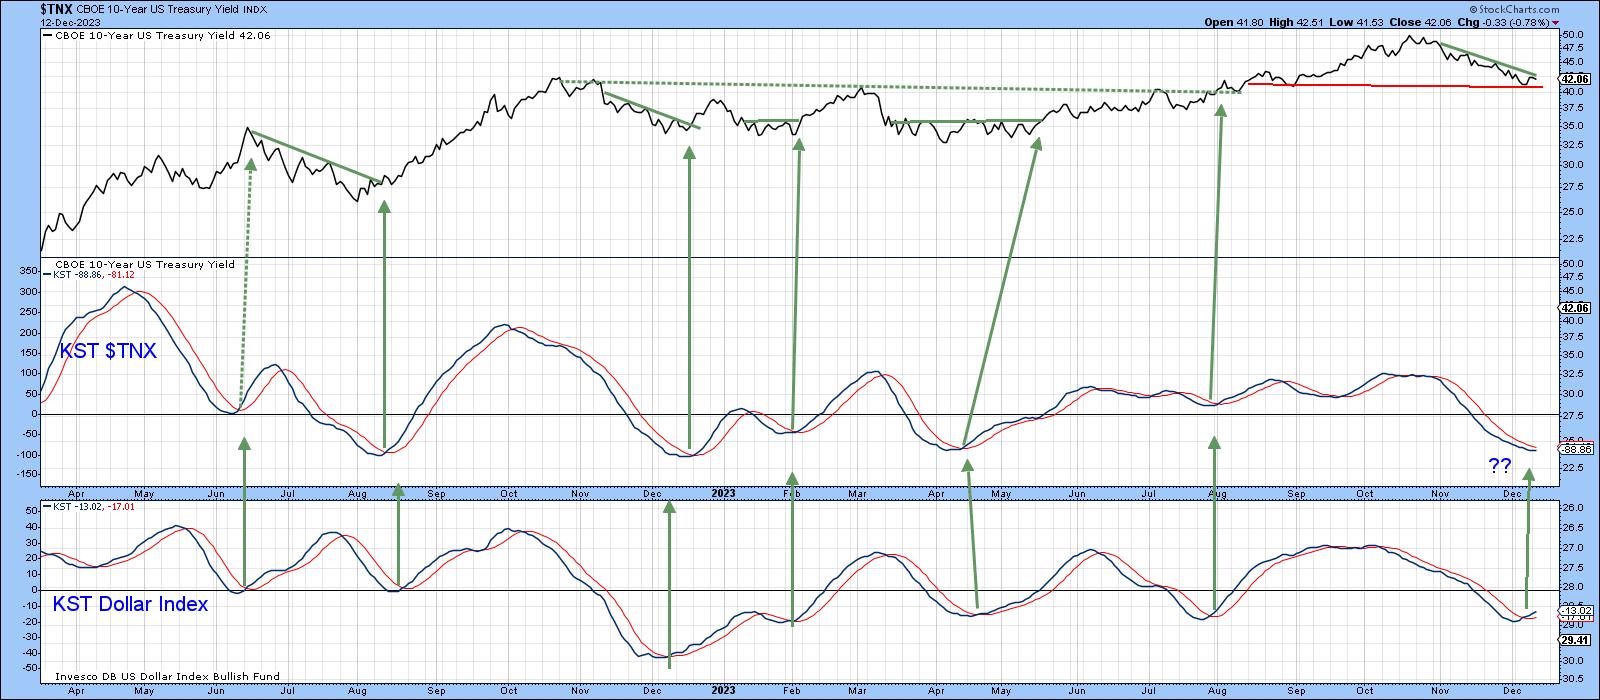
Chart 5 compares the KST for the dollar to that for the 10-year yield. The green arrows approximate the KST lows in the dollar. If the recent past is prologue, the yield should experience a short-term rally. I want to stress that this is by no means a perfect relationship, as is evident from the dashed arrow in June of 2022. That's why it's important to see that the yield confirms with a violation of its October/December down trendline.
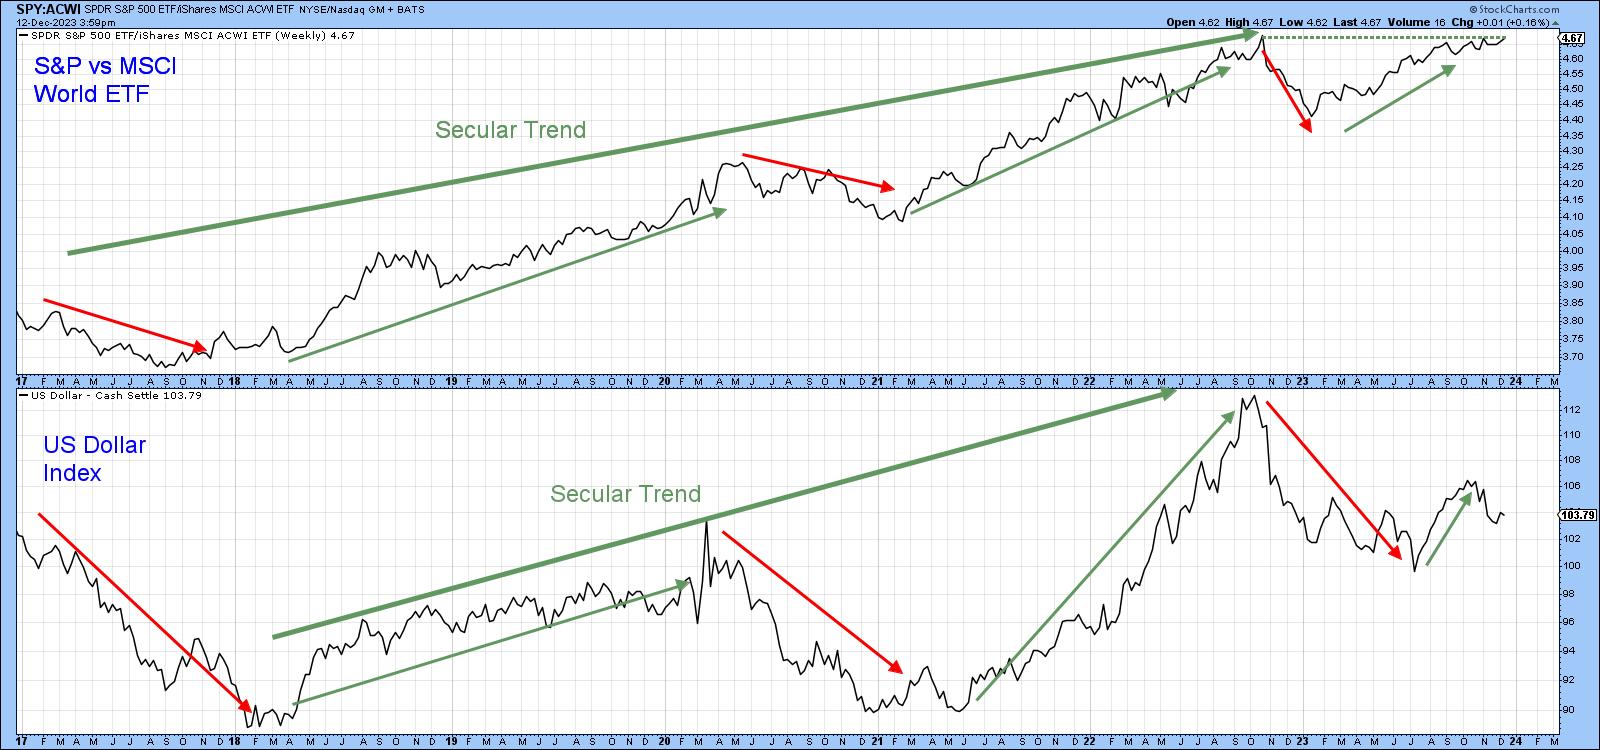
A key relationship tied into dollar moves is the relative strength of the S&P to the MSCI World Index, as shown in Chart 6. The arrows denote the fact that the Index and ratio undergo similar swings over long periods of time. Note the RS was slowly working its way higher as the dollar sold off during the last couple of months. It is now positioned to break out to a new secular high should the dollar experience a Santa rally.
Good luck and good charting,
Martin J. Pring
The views expressed in this article are those of the author and do not necessarily reflect the position or opinion of Pring Turner Capital Group of Walnut Creek or its affiliates.


