Buying Bitcoin ETFs is the Easy Part, But What Comes Next?
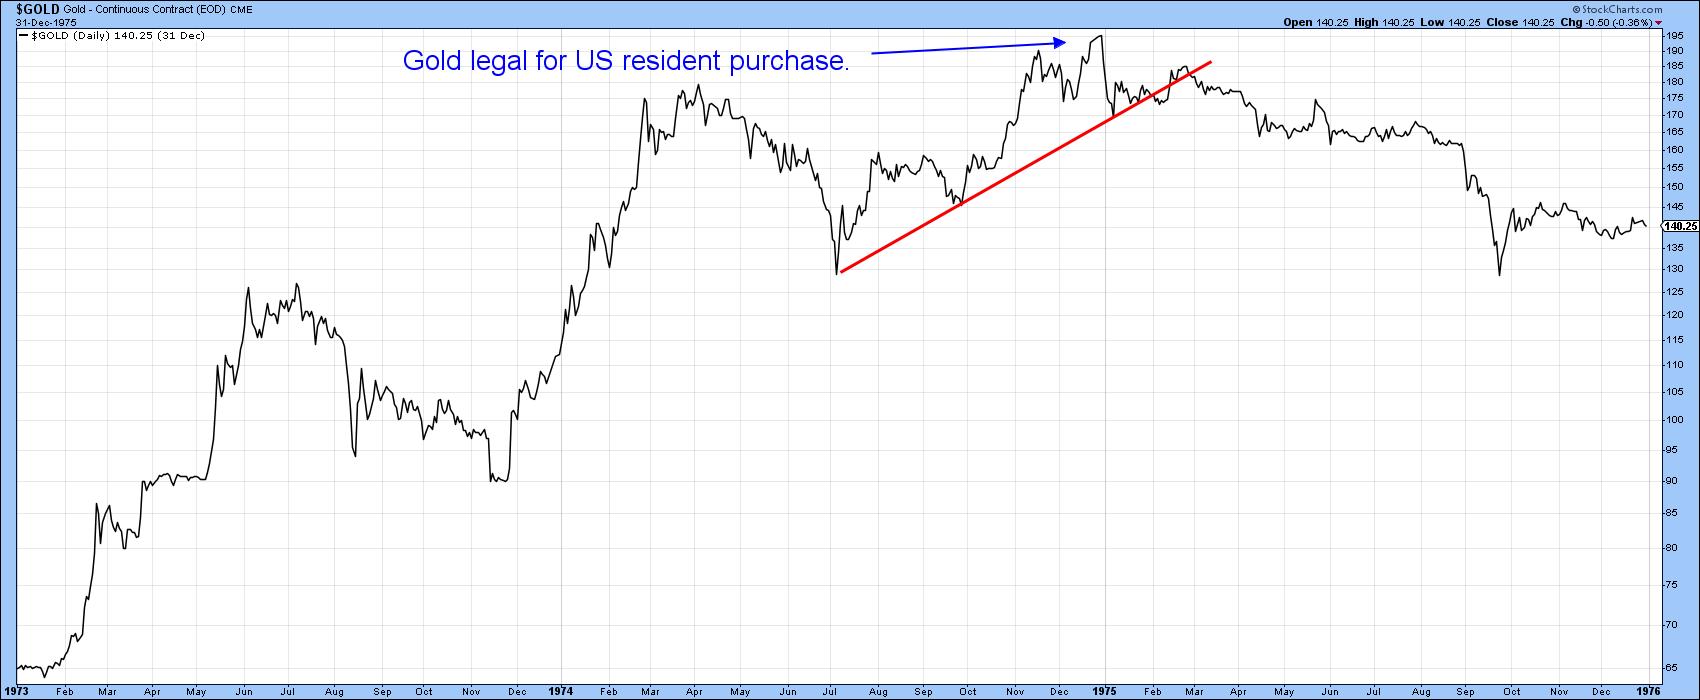
Last week, eight new Bitcoin-based ETFs began trading courtesy of recent SEC approval. This launch was well anticipated, as the price had already run up in the hope that these new buyers would push it to an even higher level. The thought occurred to me that the situation is not dissimilar to the legalization of gold purchases by US citizens that took place on December 31, 1974. In that example, shown in Chart 1, the price also rallied ahead of time, as non-US investors bid up prices, expecting to see those new US buyers flood the market and send gold even higher. As it turned out, such an investment strategy did not work out so well. That's because the price peaked on the appointed day, and subsequently proceeded to lose 30% of its value over the following nine months.
With that in mind, I thought it might be a good idea to examine the current technical position of Bitcoin, in order to see if it might be consistent with a similar performance.
Short-Term Picture
Chart 2 features daily bars for Bitcoin together with a 50-day MA. Note that the price was able to rally above the red dashed resistance line but, on the day of the high, was unable to close above it. This qualified it as a bearish Pinocchio bar. A Pinocchio forms when intraday action pushes the price above resistance, but the open and close do not.
A Pinocchio makes you think the price is breaking out. However, like the Disney character, it gives you a false impression of what is really going on. These bars reflect buyer exhaustion and are expected to have a negative effect for between five to ten sessions, often much longer. In many situations, the price consolidates for a few sessions following what is usually a sharp Pinocchio break, leading to complacency before it works its way lower. That sort of outcome seems to be developing now, as Bitcoin has not yet decisively crossed below its 50-day MA. The arrows show that this particular time span has, on a closing basis, turned back many rallies and reactions and is therefore a very useful support/resistance pivot point.
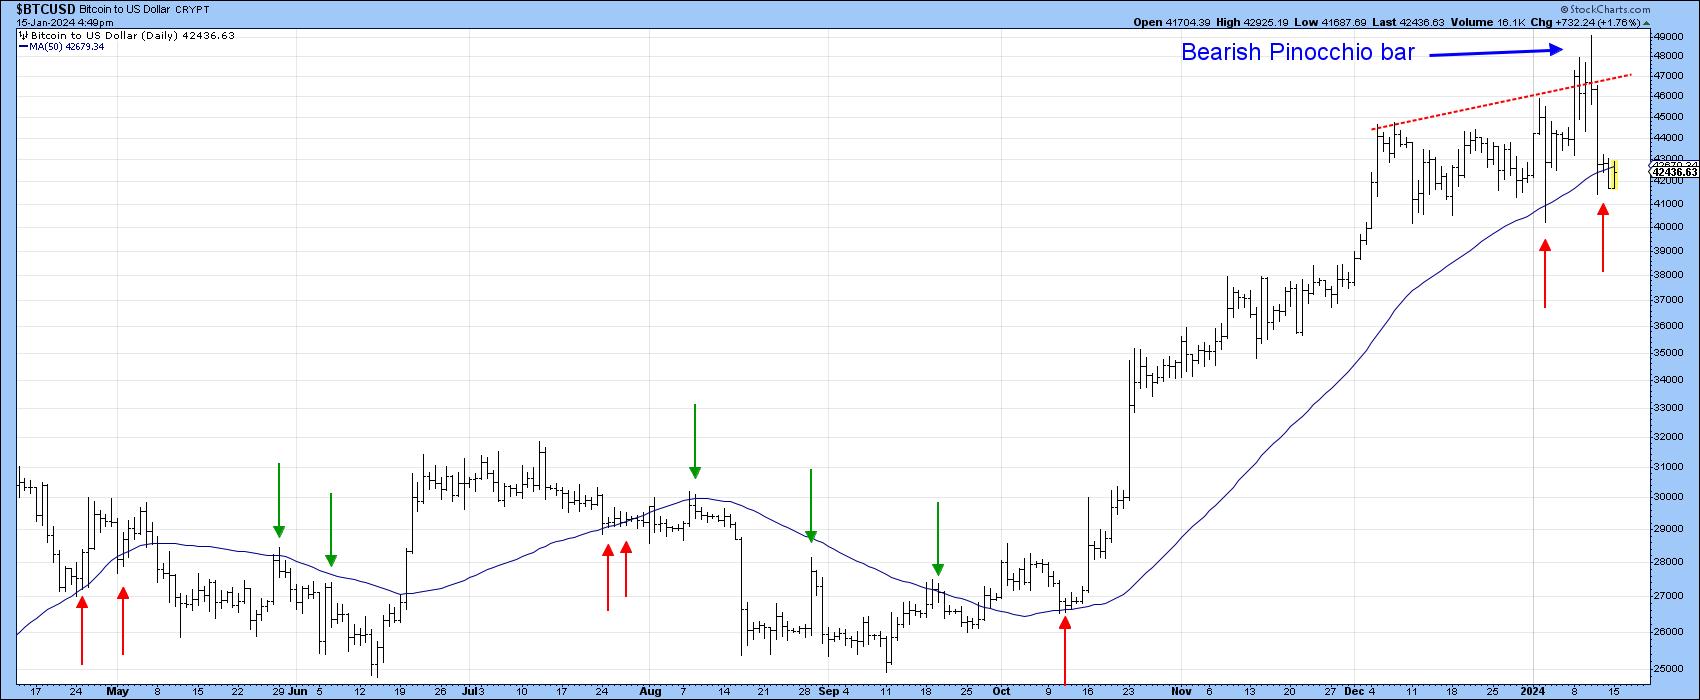
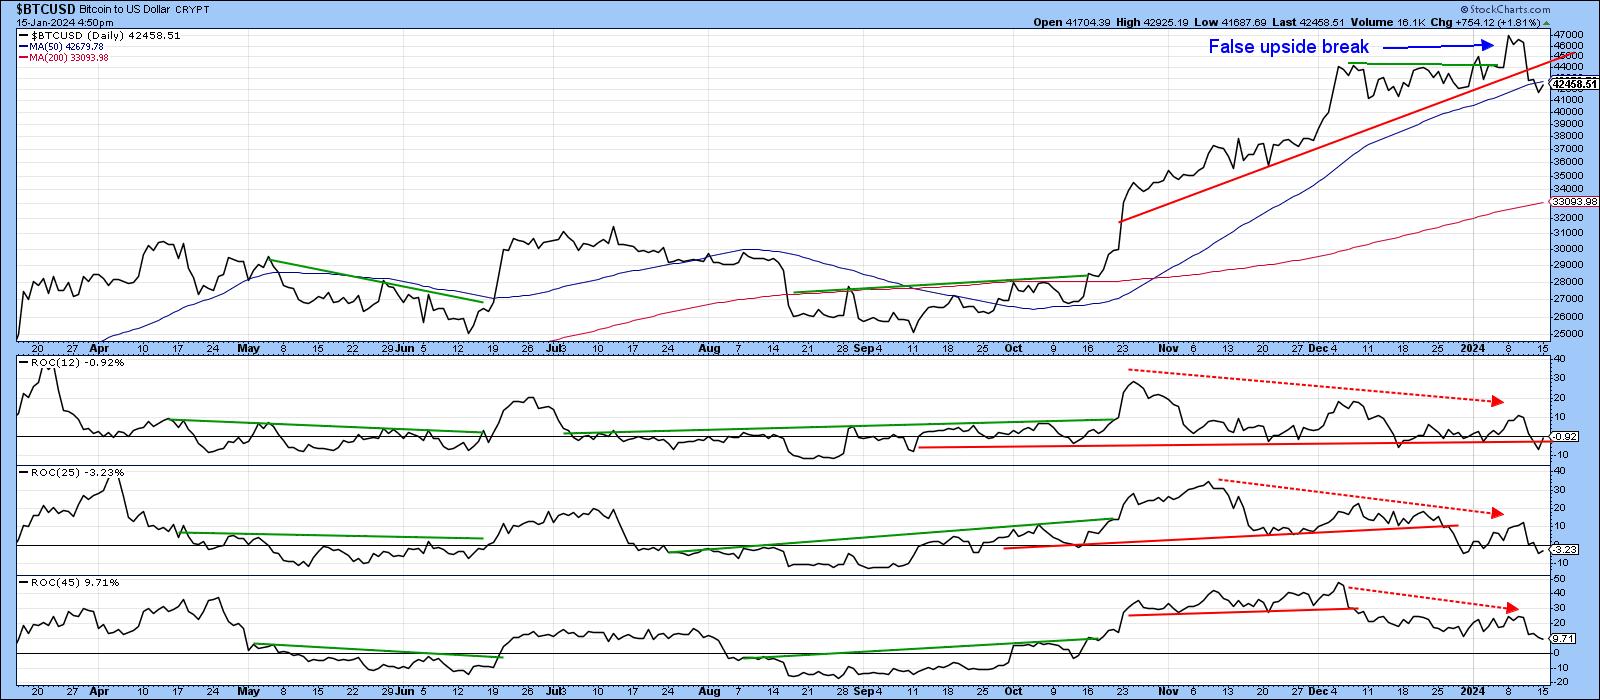
Chart 3 also tells us that the closing price experienced a false break above the green resistance trendline. Moreover, it also informs us that this whipsaw has now been confirmed by a violation of the red up trendline. It is also evident that the three ROCs have diverged in a negative way with the price. The missing piece in the puzzle is additional confirmation in the form of a more decisive 50-day MA crossover.
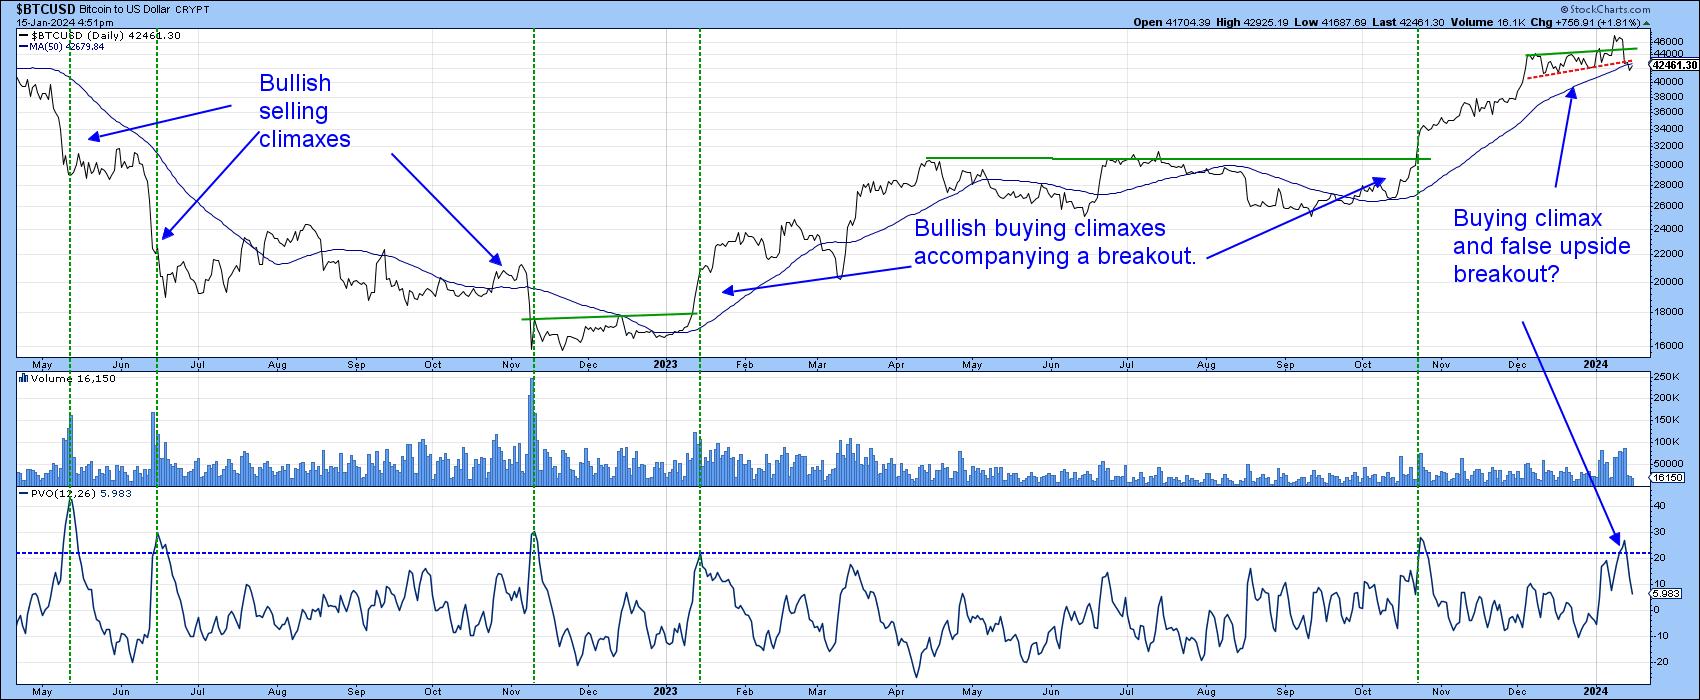
Volume, in the form of the Price Volume Oscillator (PVO), is featured in Chart 4. The dashed vertical lines flag volume climaxes. The first three appear after a price drop and are therefore bullish selling climaxes. The next two accompany upside breakouts from price patterns and are positive as well. The PVO recently rallied to its overbought zone once again. In this instance, though, the volume expansion appeared following a lengthy advance and represents a bearish buying climax. Note that the price has also dropped to its red support trendline. Since it is also close to the 50-day MA, it again emphasizes the importance of the MA as an important support zone.
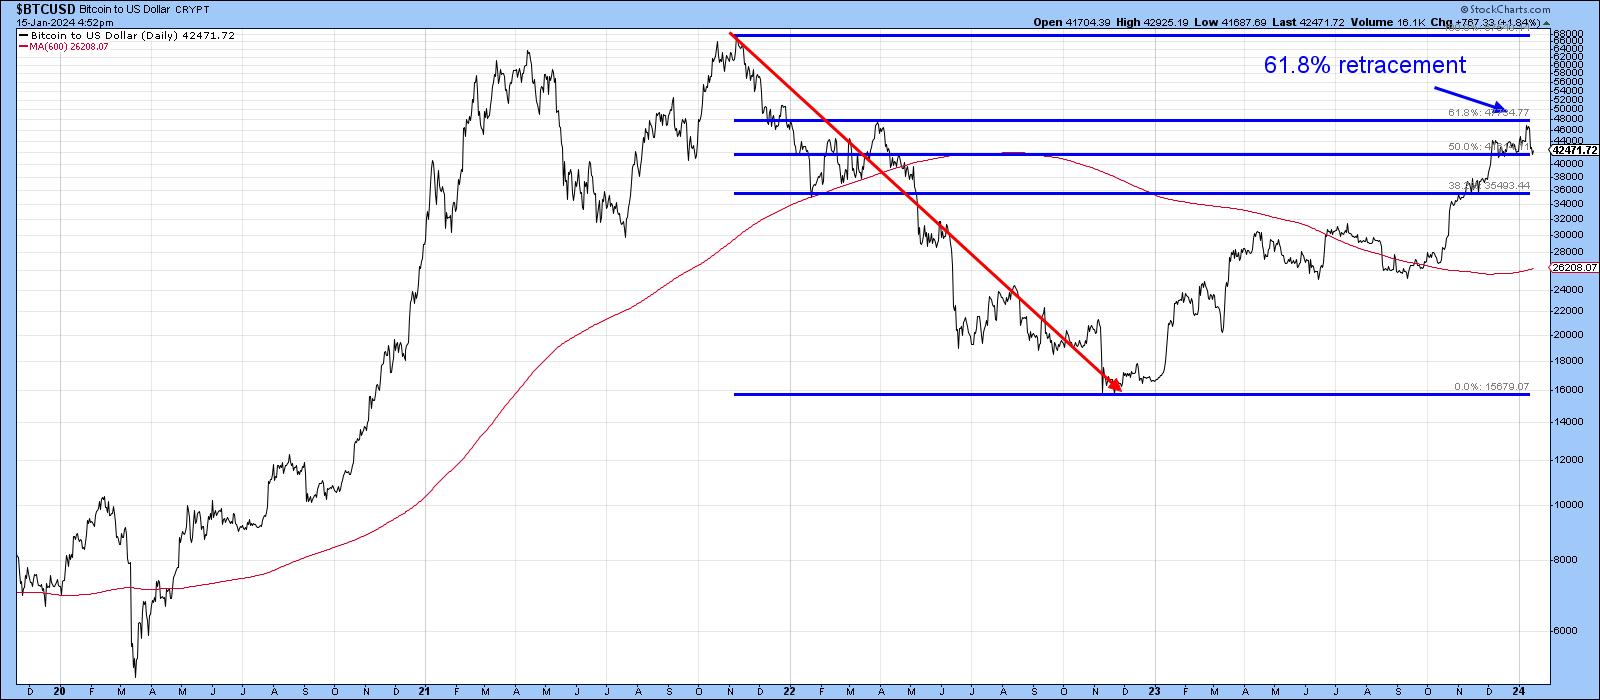
Another reason for suspecting that the rally may have run its course lies in the fact that it represents an approximate 61.8% retracement of the 2021-2023 bear market, as shown in Chart 5.
Long-Term Picture
The short-term technical may look weak, but Chart 6 also shows that the price remains well above its 600-day MA, a timespan whose crossovers have offered reasonably timely bull and bear market signals in the past.
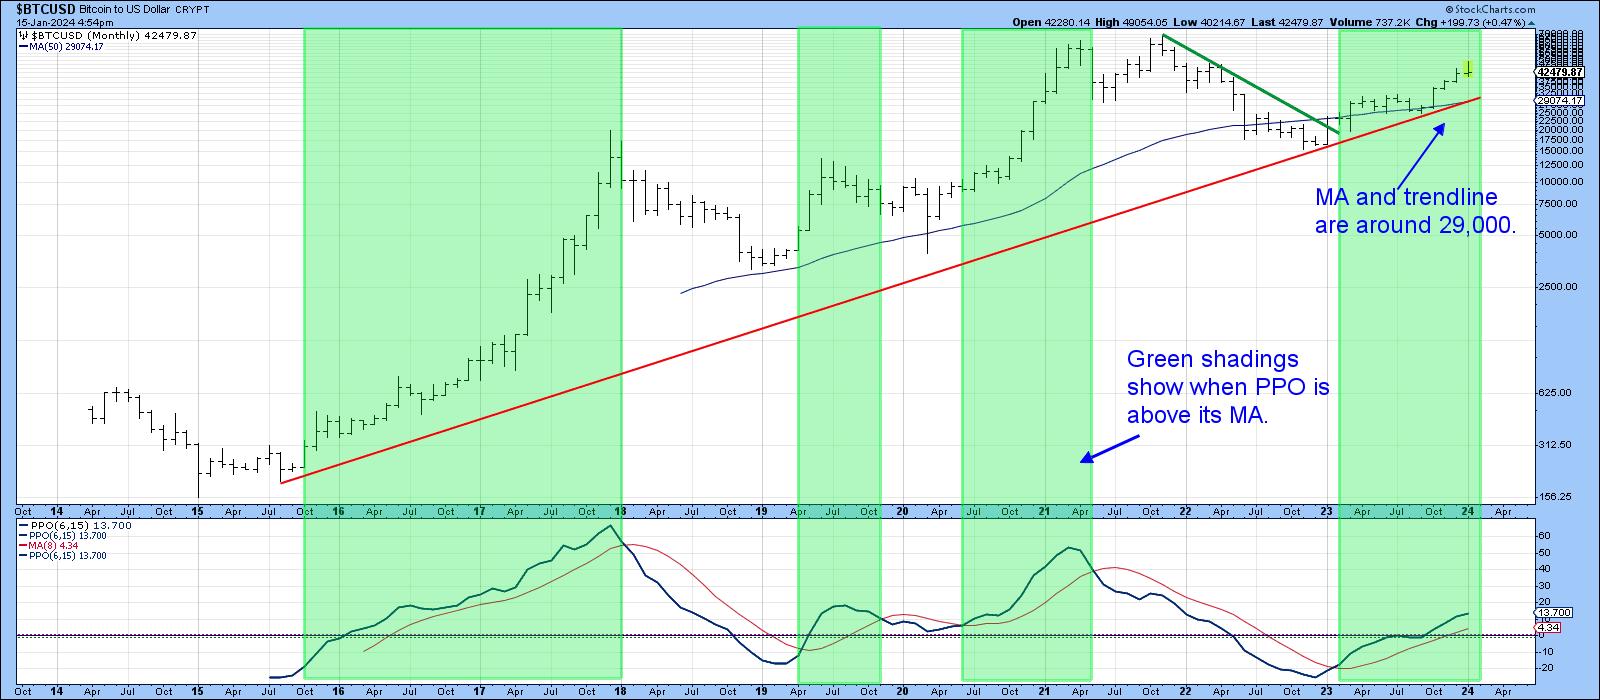
The green shadings in Chart 6 tell us when the PPO, using the 6- and 15-month parameters, is trading north of its (red) 8-month MA. This approach has captured most of the upside since 2015 and avoided most of the downside. If it started to give way and the price was also to slip below its 50-month and red up trendline at around 29,000, that would definitely be enough to conclude a major bear market was underway. In the meantime, expect the price to experience an intermediate correction of some kind. We can worry about the status of the bull market later.
Good luck and good charting,
Martin J. Pring
The views expressed in this article are those of the author and do not necessarily reflect the position or opinion of Pring Turner Capital Groupof Walnut Creek or its affiliates


