Is it Prime Time for Small Caps?
A couple of weeks ago, I took note of the widespread interest in small caps amongst the technical community. I don't normally follow cap plays, but my contrary bones began to shake when I saw such acclaim at their recent performance following several false dawns in the last decade. Consequently, I thought it might be a good idea to take a closer look to see if there was anything to the idea that small caps had just begun a trend of superior relative performance.
Chart 1, which features the long-term trend of relative action for the Russell 2000, shows this sector of the market, has been underperforming since 2011-2014, and that there have been several failed attempts at reversing it. The 2020-21 rally was impressive by any standard, but soon blew out, as it did not have much of a foundation in the way of a large base. Fast forward to 2023 and we see the possibility of a potential downward-sloping inverse head-and-shoulders forming. Note that the potential neckline is also converging with the 12-month MA crossover, which will increase the significance of any breakout that may take place.
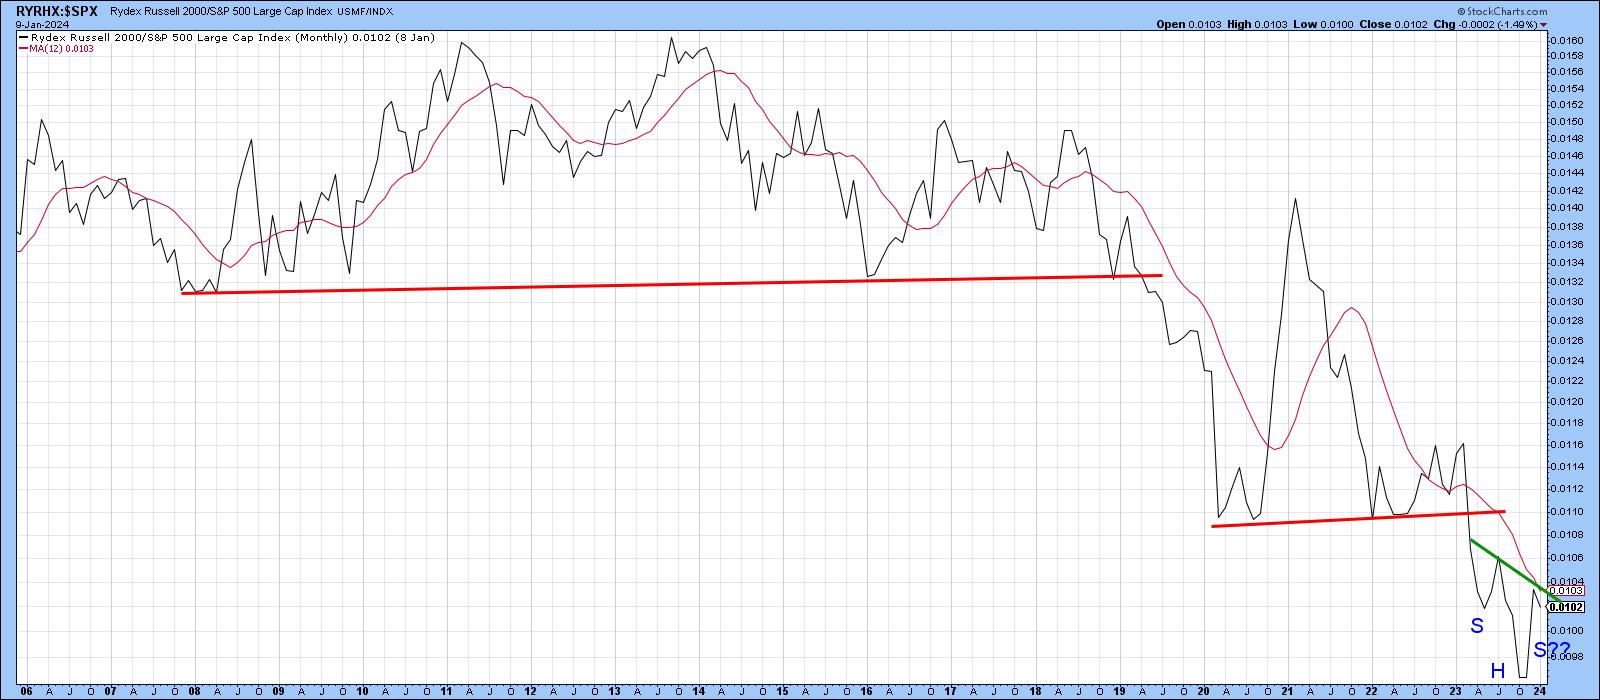
Chart 2, which features weekly data, looks a lot more encouraging. That's because the RS line is right at the 2021-23 down trendline. Also, it's not that far removed from the dashed-green potential inverse head-and-shoulder neckline. What's encouraging is the fact that the long-term KST for relative action has tentatively crossed above its 26-week EMA, suggesting that a multi-month improvement in relative action, and therefore an RS breakout, is likely.
The large green arrows flag periods when both the absolute and relative KSTs more or less simultaneously crossed above their EMAs. As a result, a multi-month advance followed for both the absolute and relative lines. The two ellipses show when the RS KST went bullish, but this was not confirmed by the absolute momentum. Currently, both are positive, which argues in favor of the IWM itself breaking more decisively above that 2022-24 resistance trendline.

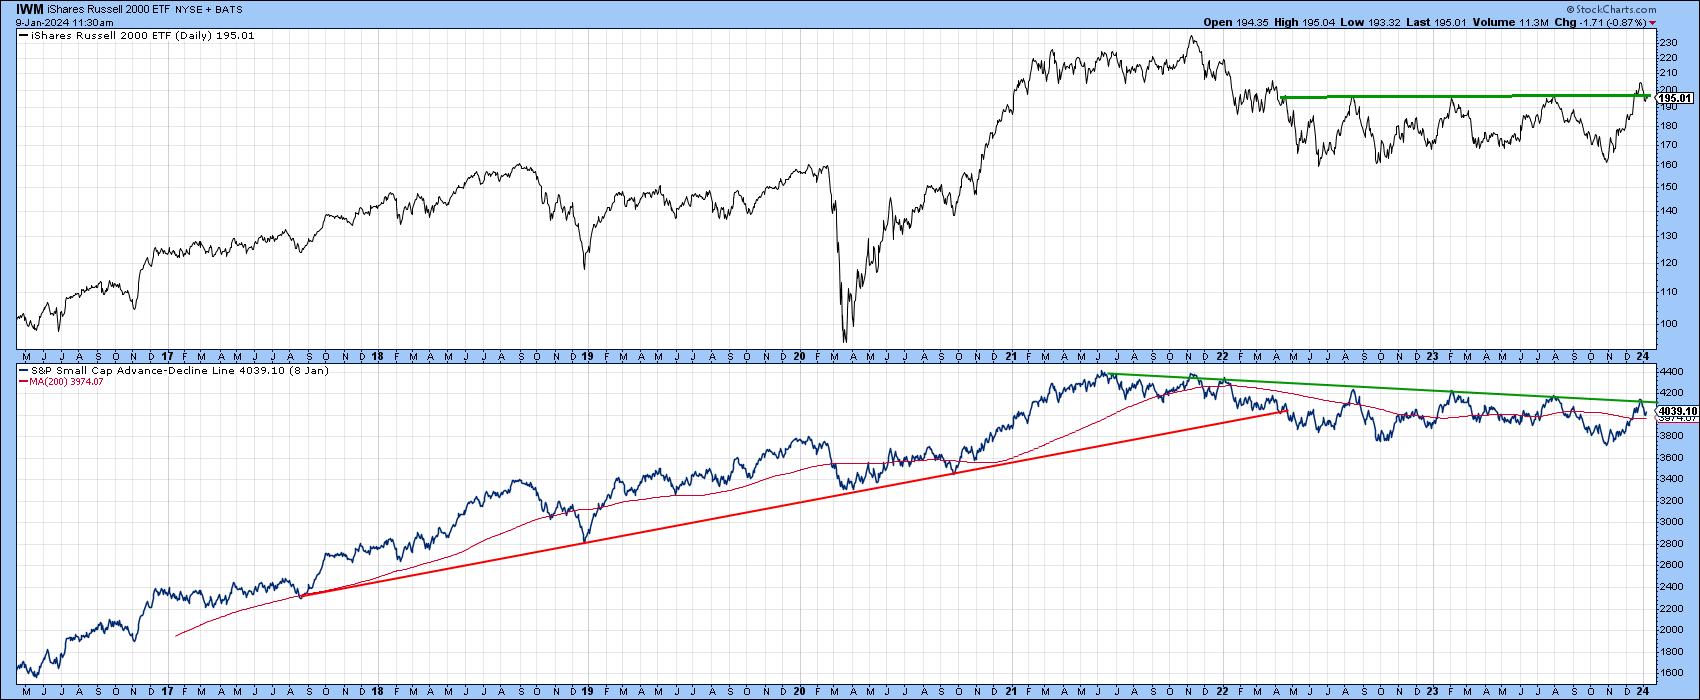
Resistance is also apparent in the breadth data. For example, Chart 3 shows that the A/D line for small caps was recently bumping up against its 2021-24 resistance trendline but has since backed off. Remember, if you want to follow this or any other chart going forward, simply click on any of them for an automatic update.
The Short-Term Picture
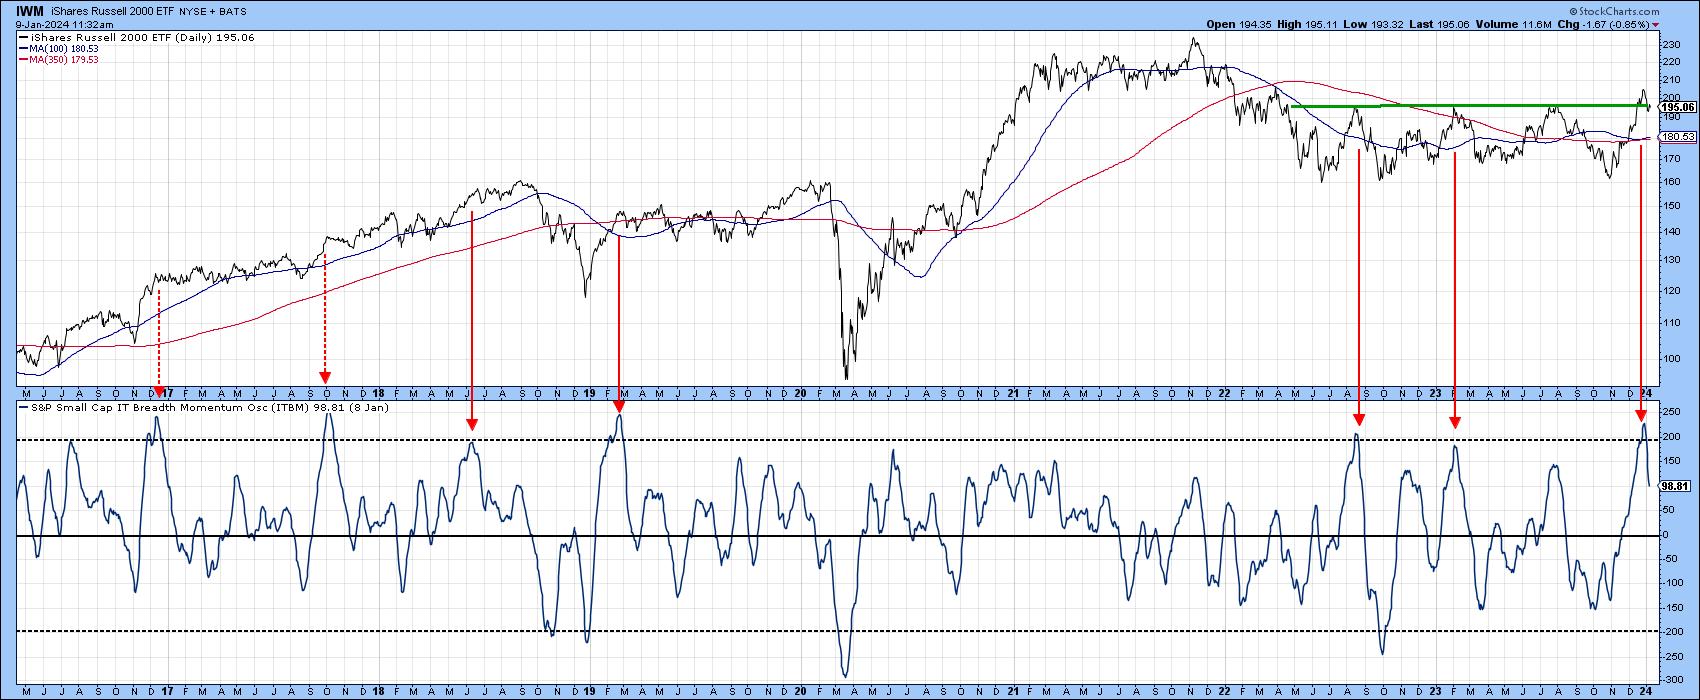
The long-term picture looks constructive, but is going to have to deal with a currently overextended short-term overstretched condition, because more followthrough is required for both the price and A/D line. One example of the overstretched near-term picture comes from the breadth momentum oscillator, in Chart 4, as it has only just reversed from an overbought reading. The solid red arrows tell us that such action is usually bearish; however, the dashed ones were not followed by any serious corrective activity, because they were part of an ongoing linear uptrend typical of a strong bull market. How the IWM is able to handle the current overstretched condition will provide a clue as to its staying power. In that regard, I would get worried if the price dips below the converging 100- and 350-day moving averages at $180, as that would suggest the failure of the post-October rally.
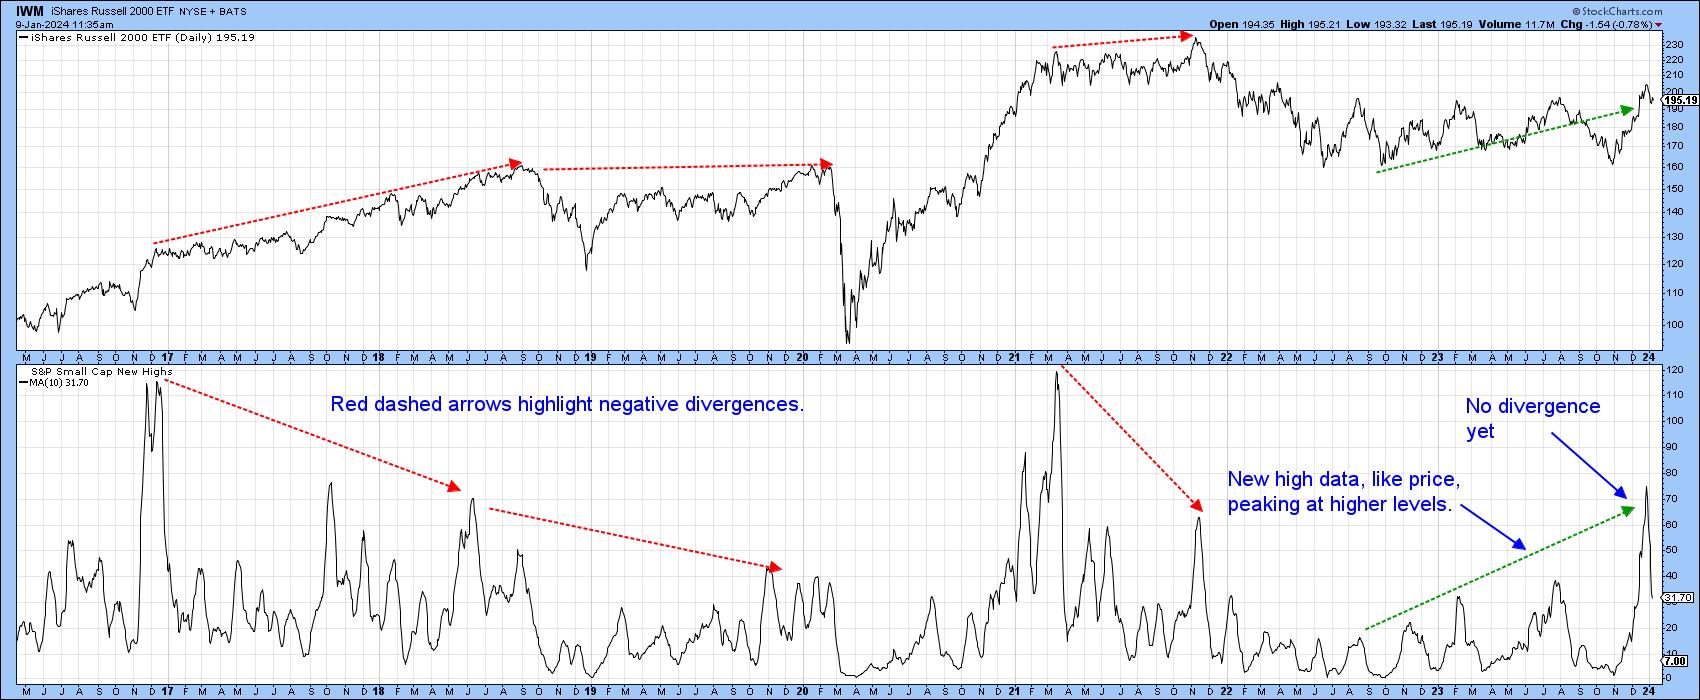
New high data, as featured in Chart 5, offers some hope in this regard. The red dashed lines point out the fact that important rally peaks are often preceded by higher peaks in the number of small caps registering new 52-week highs. Since the indicator has just registered a post-2021 high, there is no current divergence. Indeed, we could argue that the reverse is happening, since the indicator and the IWM are currently in gear, with a progressively larger number of new highs being in sync with price activity.
Conclusion
The long-term technical structure on both an absolute and relative basis is constructive, but more follow through on the upside is required to turn it into a bullish one. The principal challenge is for the IWM to successfully deal with the overbought short-term condition with the kind of muted correction typically associated with a bull market. Since the overall market is likely to move higher, and long-term momentum on both an absolute and relative basis is positive, a more decisive upside breakout is likely. Whether that will be sufficient to reverse the decade-long downtrend in relative action is another question.
Good luck and good charting,
Martin J. Pring
The views expressed in this article are those of the author and do not necessarily reflect the position or opinion of Pring Turner Capital Groupof Walnut Creek or its affiliates.


