Is Oil Going Up or Down?
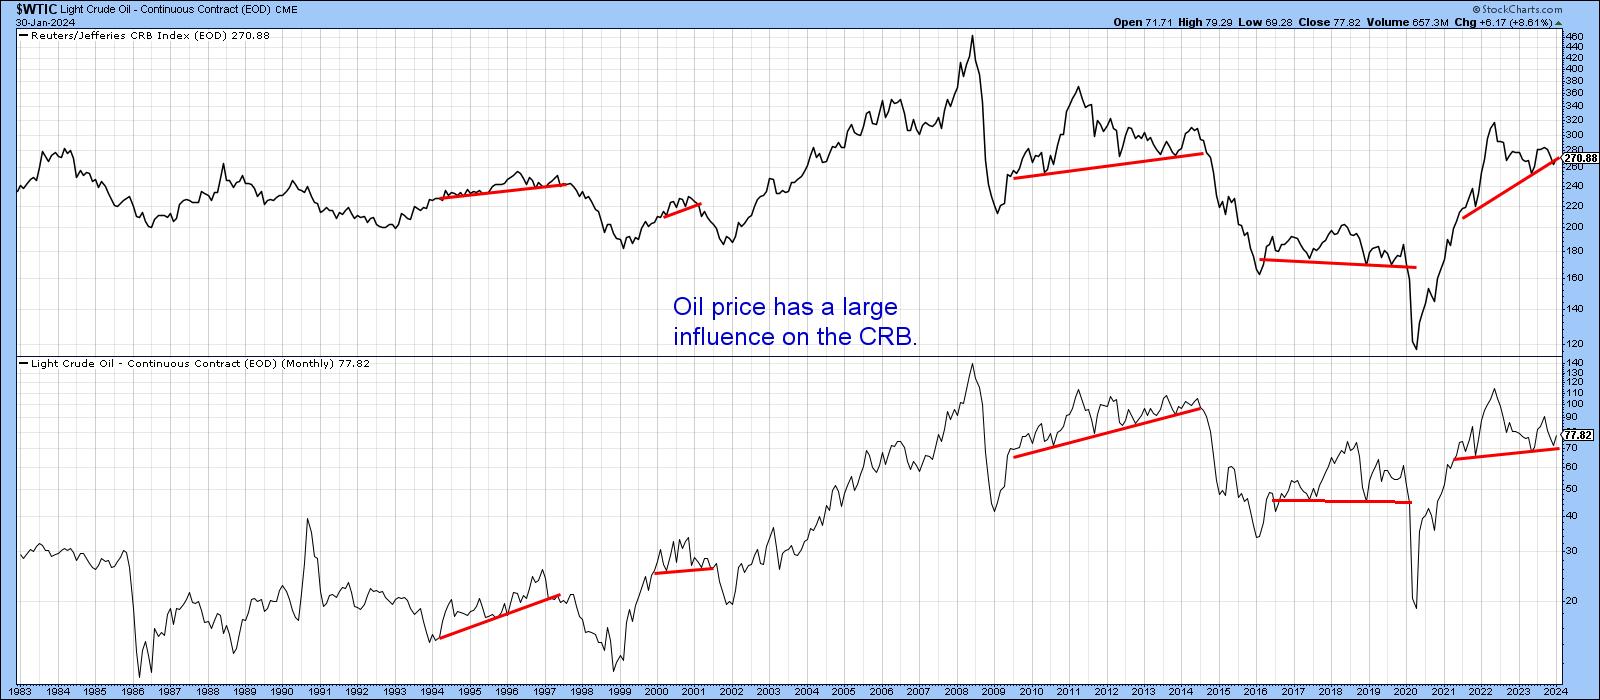
Oil is not only an important commodity in and of itself, but is also one has a substantial influence on commodity indexes in general. Its weight in the CRB Composite is 23%; for energy in total, it is 39%. Chart 1 compares the oil price to the CRB Composite, where it is evident the two move relatively closely together. Indeed, we can see many examples of joint trendline violations being followed by important trend reversals. It is therefore fair to say that wherever oil goes, commodities in general are likely to follow. It looks as if both series are in the process of forming tops, but those distribution formations have not yet been completed, so it is premature to come to a bearish conclusion. What we can say is that when those patterns are resolved, either with completion or failure, a big move is likely to follow.
A Fine Balance Between Buyers and Sellers
Chart 2, using Friday closing prices for West Texas Crude, displays the battle lines more clearly. What looked like a simple potential head-and-shoulders in Chart 1 has now become more complex, with multiple shoulders. The neckline is currently at $70, and the line joining the head with the latest shoulder is around $85. If that green line is violated, it would suggest the pattern had failed. We should then expect an above-average rally to follow as those who sold in anticipation of a downside break scramble to get back to the right side of the market.
The convergence of the two lines itself suggests a fine balance between buyers and sellers. So too does the recent flat action by the long-term KST and 65-week EMA. Speaking of balance, note also how the EMA is trading roughly halfway between the two trendlines.
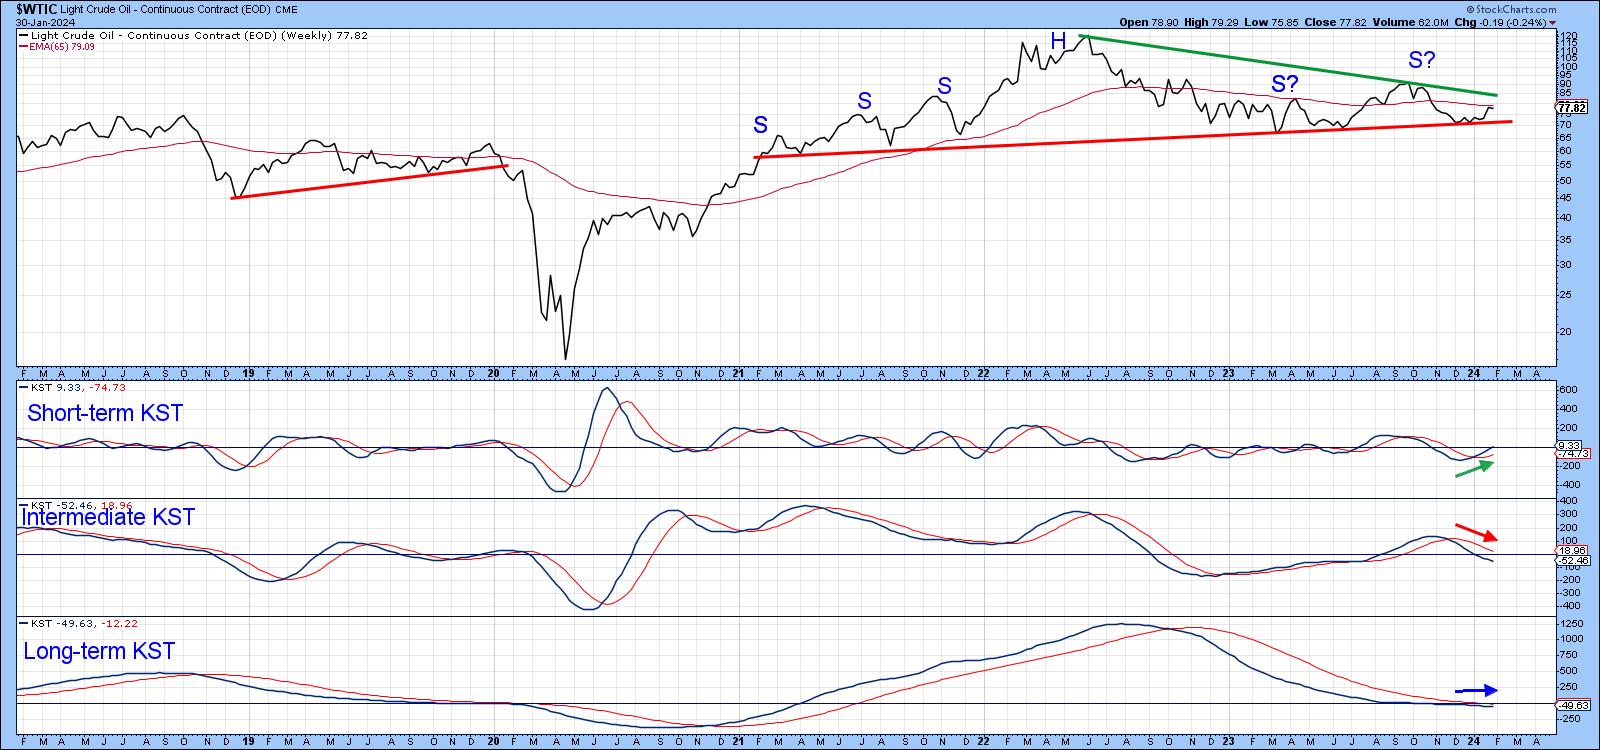
The short- and intermediate-term KSTs are conflicted, with one rising and the other declining. Since near-term prices are more influenced by swings in the former, one thing I am watching for is to see whether short-term momentum turns down before the price surpasses the green down trendline. That would be negative in its own right. However, since it would have come on the back of escalating tensions in the Middle East, which should have stimulated prices, then if it happens, that would suggest a very vulnerable technical structure.
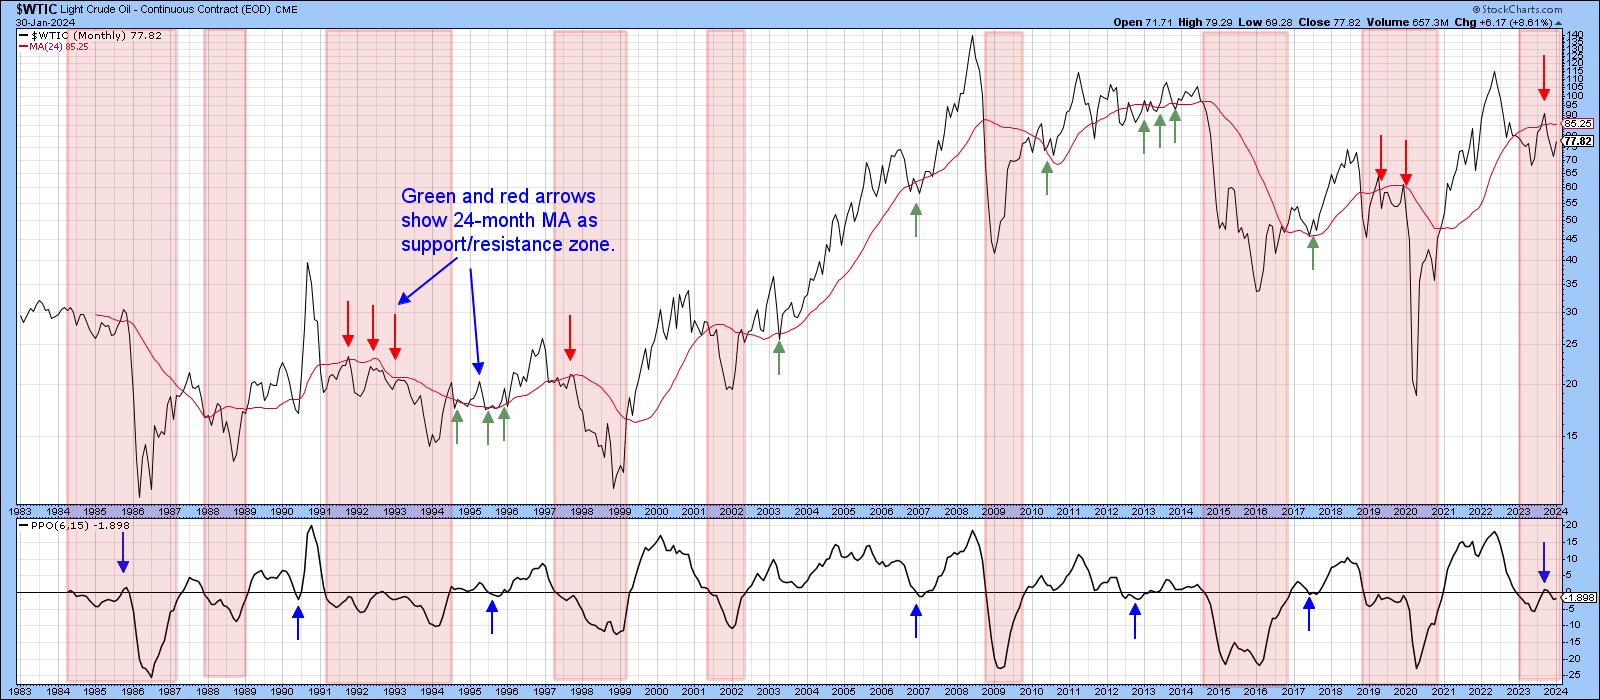
Chart 3 further underscores the tight battle between buyers and sellers. The indicator in the lower window is a PPO using the 6-month and 15-month parameters. The pink shadings represent periods when the oscillator was below zero and the blue arrows the limited number of whipsaw signals that have developed over the course of the last three decades. The PPO is currently on a sell signal, but its proximity to the zero level tells us that it would not take much in the form of higher prices to reverse course to the upside. It's boring at the moment, but unlikely to remain that way for much longer.
Near-Term Vulnerability
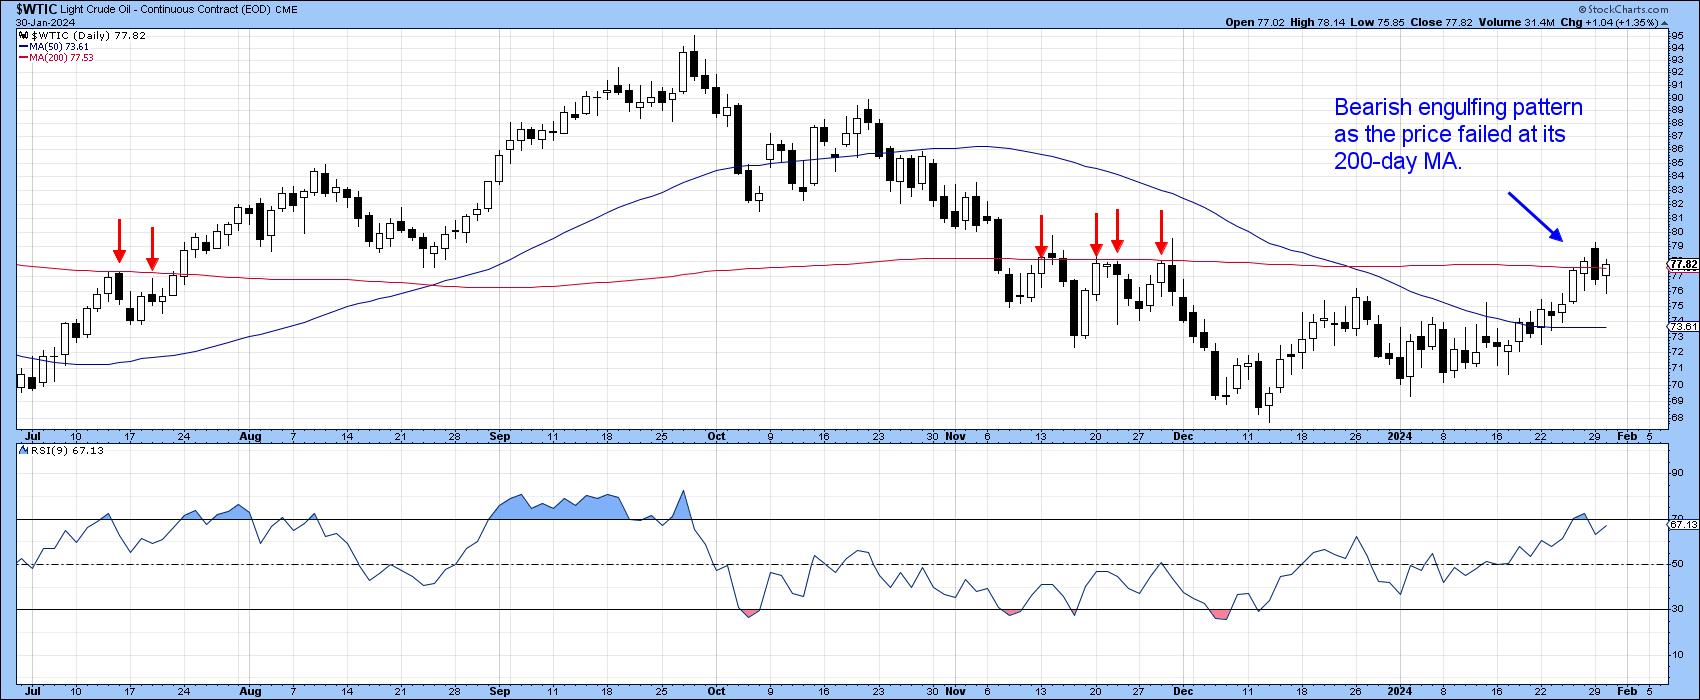
Chart 4 hints at near-term vulnerability because Monday's price action indicates a bearish engulfing pattern. Not only that, but the session began with a decisive break above the red 200-day MA but ended well below it. In that respect, the red arrows indicate how this MA has recently acted as an impressive dynamic area of resistance. Failure to hold above it is therefore a sign of near-term exhaustion. You can also see that the RSI is overbought, which again suggests that things are overdone for the short-term. If, on the other hand, the price moves decisively above Monday's high and holds that position, the odds of an upside resolution would be greatly enhanced, as failed patterns are usually followed by above-average moves in the opposite direction.
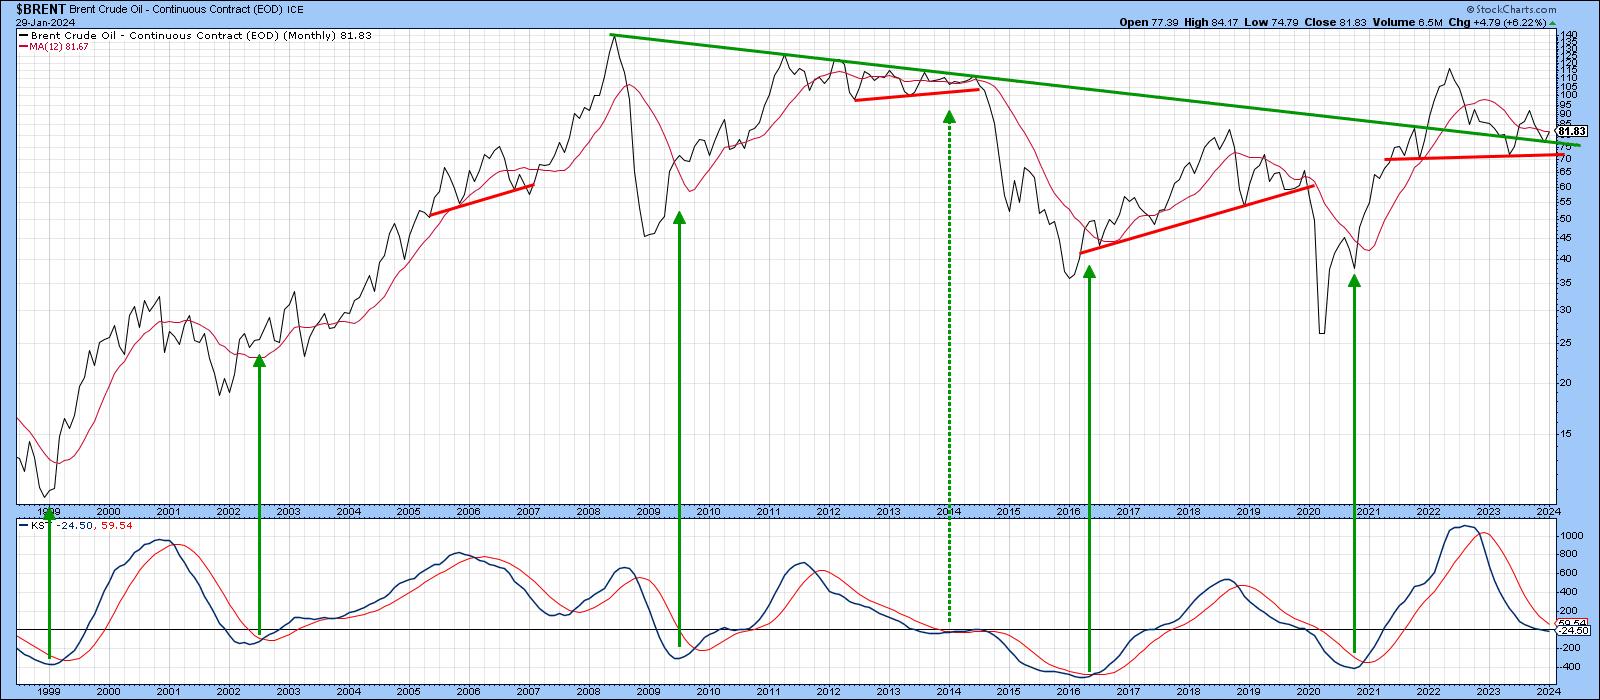
A Constructive Long-Term Chart
Chart 5 features Brent Crude because 2022 saw it violate its secular down trendline going all the way back to 2008. That line has a slow angle of descent and is 16 years in length. Most importantly, it has represented a huge dynamic level of support and resistance. Right now, the price is above it, which adds to the bullish case. However, we really need to see a decisive 12-month MA crossover and KST upside reversal in order to turn the balance of evidence to the bullish side.
Good luck and good charting,
Martin J. Pring
The views expressed in this article are those of the author and do not necessarily reflect the position or opinion ofPring Turner Capital Groupof Walnut Creek or its affiliates.


