What Does Dow Theory Say About This Market?
Some tools in technical analysis are totally objective, such as a moving average crossover. It may be debatable whether it's a decisive signal or not, but a crossover is nevertheless a crossover. Dow Theory, on the other hand, is much more subjective and, therefore, open to interpretation. For example, several commentators have recently opined that Dow Theory is not yet bullish because the Transports (originally railroads) have not confirmed the latest all-time high in the industrials. I am unaware of any mention of all time highs in any of the textbooks explaining the theory, so I am not sure how that works.
The Theory in a Nutshell
Dow Theory evolved from the work of Charles H. Dow, which was published in a series of Wall Street Journal editorials between 1900 and 1902. Dow used the behavior of the stock market as a barometer of business conditions, rather than as a basis for forecasting stock prices themselves. His successor, Willian Peter Hamilton, further developed Dow's principles and organized them into something approaching the theory as we know it today. It was not until Robert Rhea published Dow Theory in 1932 that its principles became more established.
The concept is based on the idea that stocks look ahead and anticipate changes in economic conditions ahead of time. However, the outlook for the economy is only bullish when the prices of both the companies that manufacture goods and those that transport them rally in price. The reverse would be true for a bear market.
In Dow Theory, the direction of the primary trend is assessed on the simple principle of peak trough progression. The peaks and troughs, in this case, are defined by Rhea as "an important decline in a bull market or advance in a bear market, lasting for 3-weeks or as many months, during which interval, the movement generally retraces between 1/3 and 2/3" of the previous pro-trend move. In effect, the trend is bullish when the Dow Industrials, on a daily closing basis, experience a series of rising intermediate peaks and troughs, and this is confirmed by the Transports doing the same. The Theory says nothing about how long a confirmation should take. As a general rule, though, the closer the confirmation, the stronger the signal. Dow Theory also comes with drawbacks, as occasionally the signals occur well after the final turning point. Also, it can be difficult to determine what trends actually qualify as "intermediate" in nature.
The Current Picture
Chart 1 tries to short-circuit the defining process with the use of StockChart's Zig Zag indicator. Using the benefit of hindsight, this tool enables the filtering of price swings meeting your percentage requirements. In Chart 1, the dial has been set to 7.5%, which identifies all price moves greater than 7.5%. It's not a perfect approach but offers an objective good starting point for identifying intermediate moves in either direction.

Chart 2 takes those 7.5% price swings and overlays arrows at the turning points for both series. For the Transports, we begin at the late 2021 peak, and experience a retracement low (1) at the tip of the first red arrow. An intermediate rally follows with the green arrow (2). This is finally followed by a decline that takes the Index slightly below the previous low at 1. That downside reversal in the peak trough regression is a sell signal for the Transports, but does not qualify for a Dow Theory sell signal. That takes place at 3 in the lower panel, which displays the Industrials.
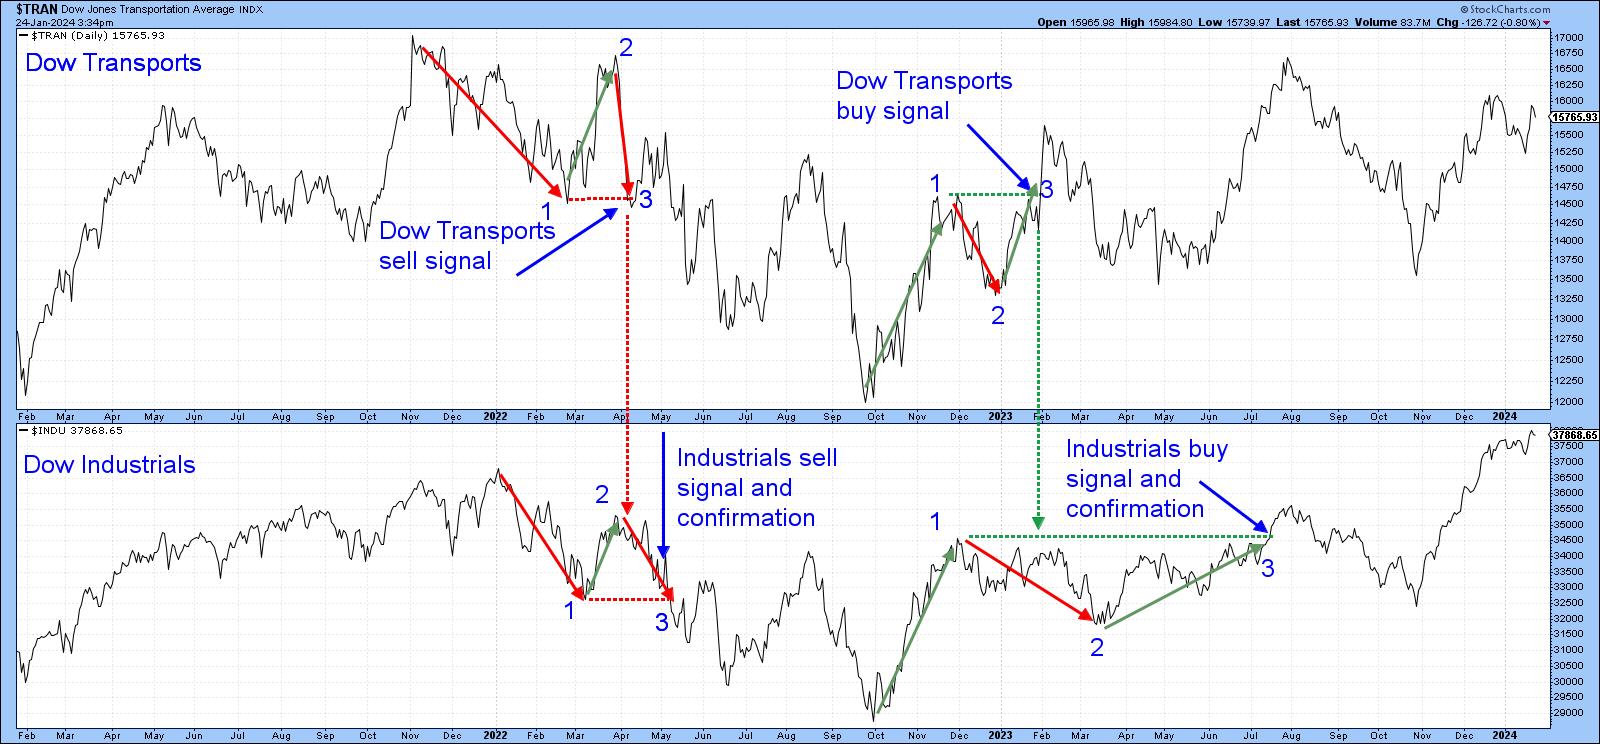
Both indexes reach their low water mark in October 2022, with the Transports again leading the way with a buy signal at 3 in January 2023. The Industrials finally confirm in July of last year, and, with that, a Dow Theory buy signal. The two have been zig-zagging around since, but the series of rising intermediate peaks and troughs is intact, so Dow Theory remains bullish.
In order to generate a sell signal, it would be necessary for the current Transport rally to fail at some point below its August 2021 peak, followed by a subsequent drop below its October bottom. At this juncture, no corresponding intermediate turning point for the Industrials is apparent, since the Index is at an all-time high. That's usually a nice place to be!
Good luck and good charting,
Martin J. Pring
The views expressed in this article are those of the author and do not necessarily reflect the position or opinion of Pring Turner Capital Groupof Walnut Creek or its affiliates.


