Emerging Markets Getting Closer to a Breakout
Last November I asked the question "Are emerging markets about to emerge?"Using the iShares MSCI Emerging Markets ETF (EEM) as our benchmark, I concluded that more strength was needed in order to push the indicators into a bullish mode. In the intervening period, things have improved, but we are not quite there yet.
The stakes are high, because the EEM has been in a secular bear market relative to the Dow Jones Global Index since 2011. That's also when commodities experienced a secular peak. Chart 1 also shows that during the secular bull market of 1999-2011 KST, sell signals were fairly ineffective. That's because they were operating in a counter-secular way. By the same token, buy signals during the post-2011 bear market, being of a counter-cyclical nature as well, were mostly unproductive. That's also the case for the most recent 2023 signal, as the RS line has continued to deteriorate. Were it to respond in a favorable way by surpassing the 24-month MA and secular down trendline, a worthwhile rally or even a new secular bull market could be in the cards.
Emerging in a relative sense therefore seems a ways off, but what of the absolute price?

The Technical Picture for the iShares MSCI Emerging Markets ETF
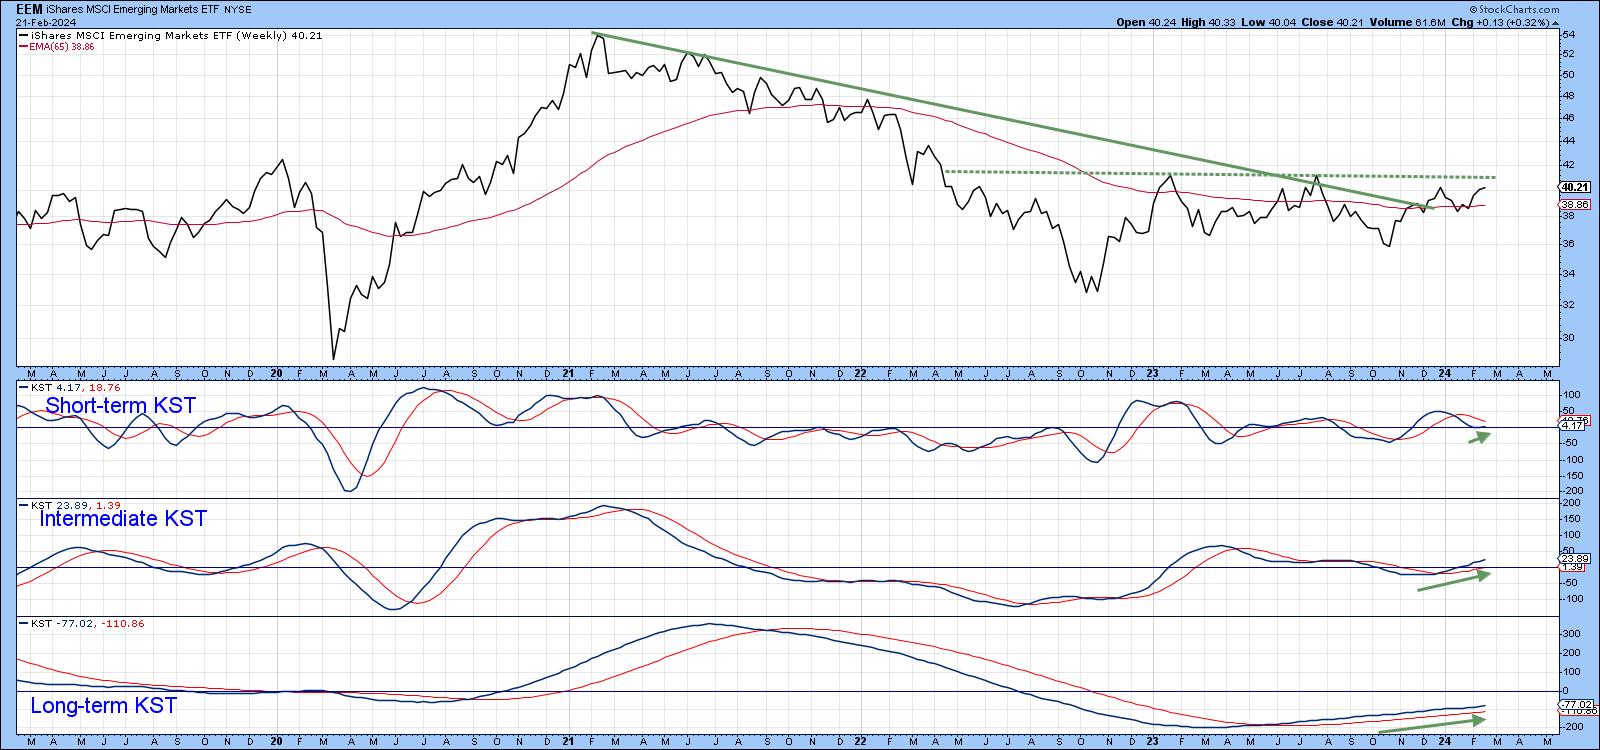
In this instance, things appear to be closer to a positive resolution. First, the price has violated its bear market trendline and exceeded its 65-week EMA. Second, all three KSTs are in a rising trend, though the short-term series has yet to run on all cylinders by crossing its EMA. The key, though, is a weekly close that can hold above $42, thereby completing the potential base.
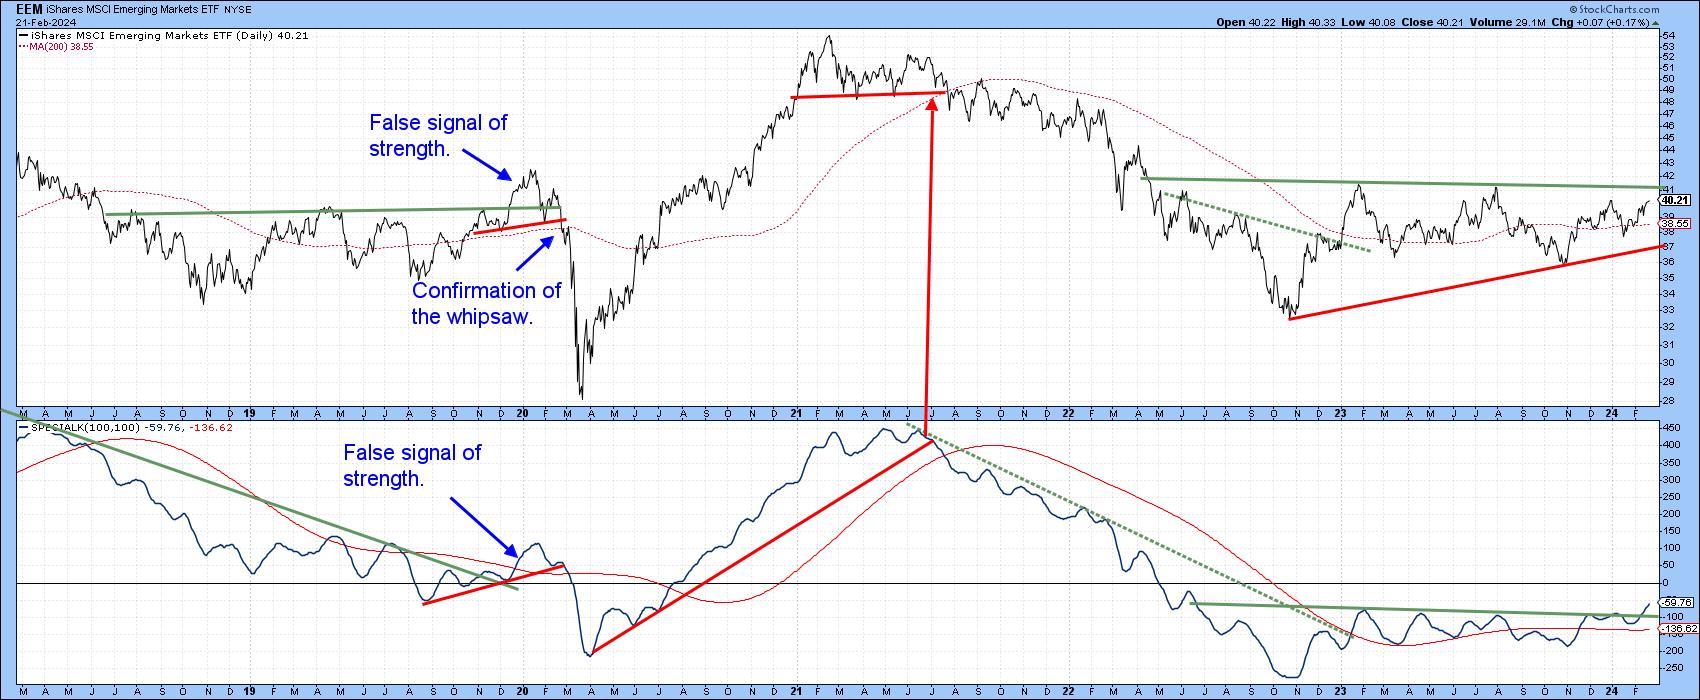
Drilling down to the daily data, Chart 3 indicates that $42 again represents a decisive breakout point. Here though, the technical picture is more encouraging, because the Special K, which you can read about here,has just broken out from a nice base of its own. I have the expression "where the Special K goes, the price soon follows." It doesn't always work out that way every time, of course. However, it does point me in the right direction more times than not. Even so, it's still important to make sure any signal given by the Special K is confirmed by the price with some kind of a trend reversal signal. After all, you can't buy and sell momentum -- only price.
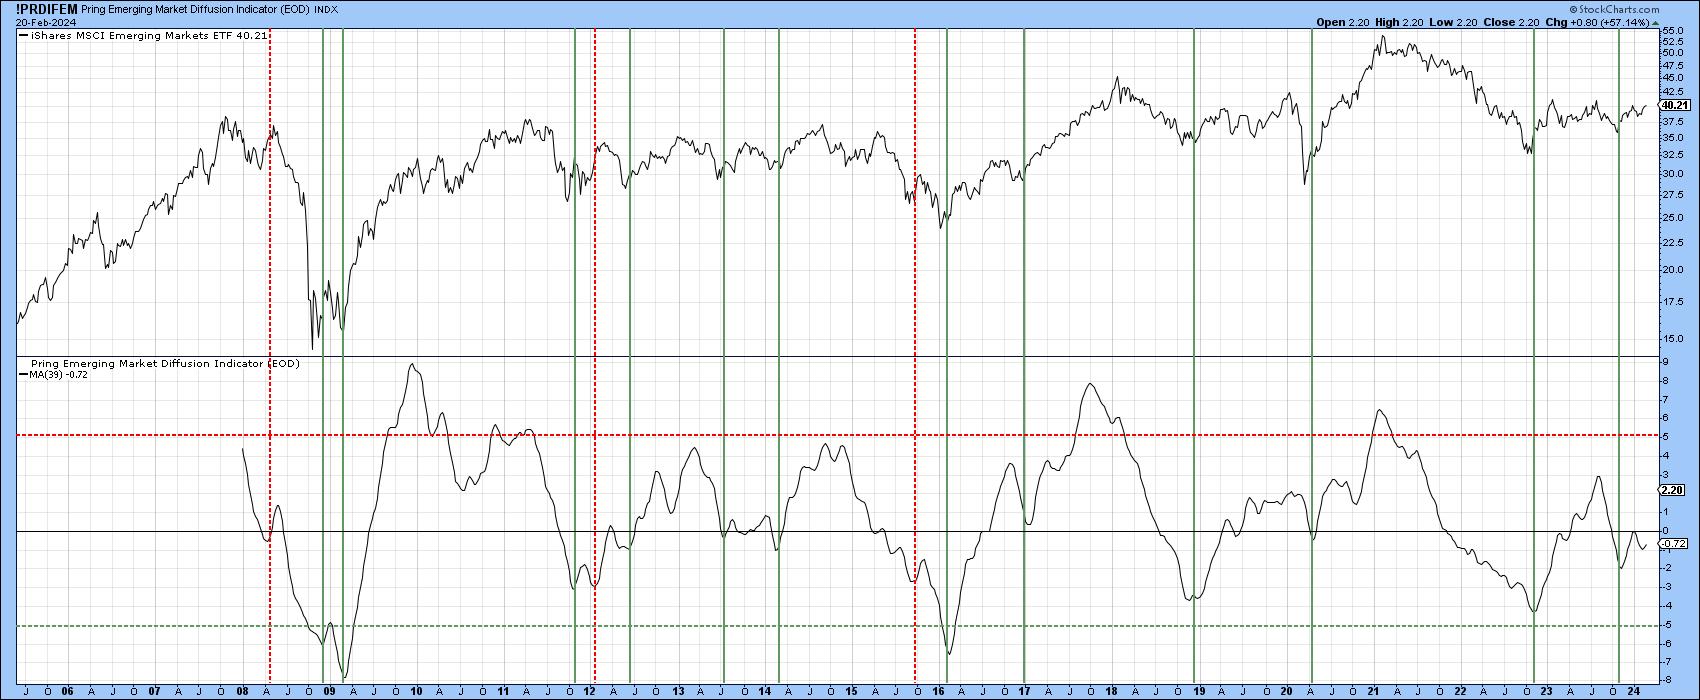
Finally, Chart 4 shows a 39-week MA of my Emerging Market Diffusion indicator, which monitors a universe of emerging market country ETFs in a positive trend. Buy signals are triggered when it reverses to the upside from a sub-zero position. False flags are identified by the dashed red lines, valid signals by the solid green ones. A reversal took place at the end of last year, which was followed by a small rally and subsequent setback. In the last couple of weeks, it reversed again, thereby renewing last year's bullish message. I'd like to see a bit more strength before concluding this reversal is valid, but, in any event, it's another indication that it would not take much to result in a breakout in the EEM itself.
Emerging Markets and Commodities
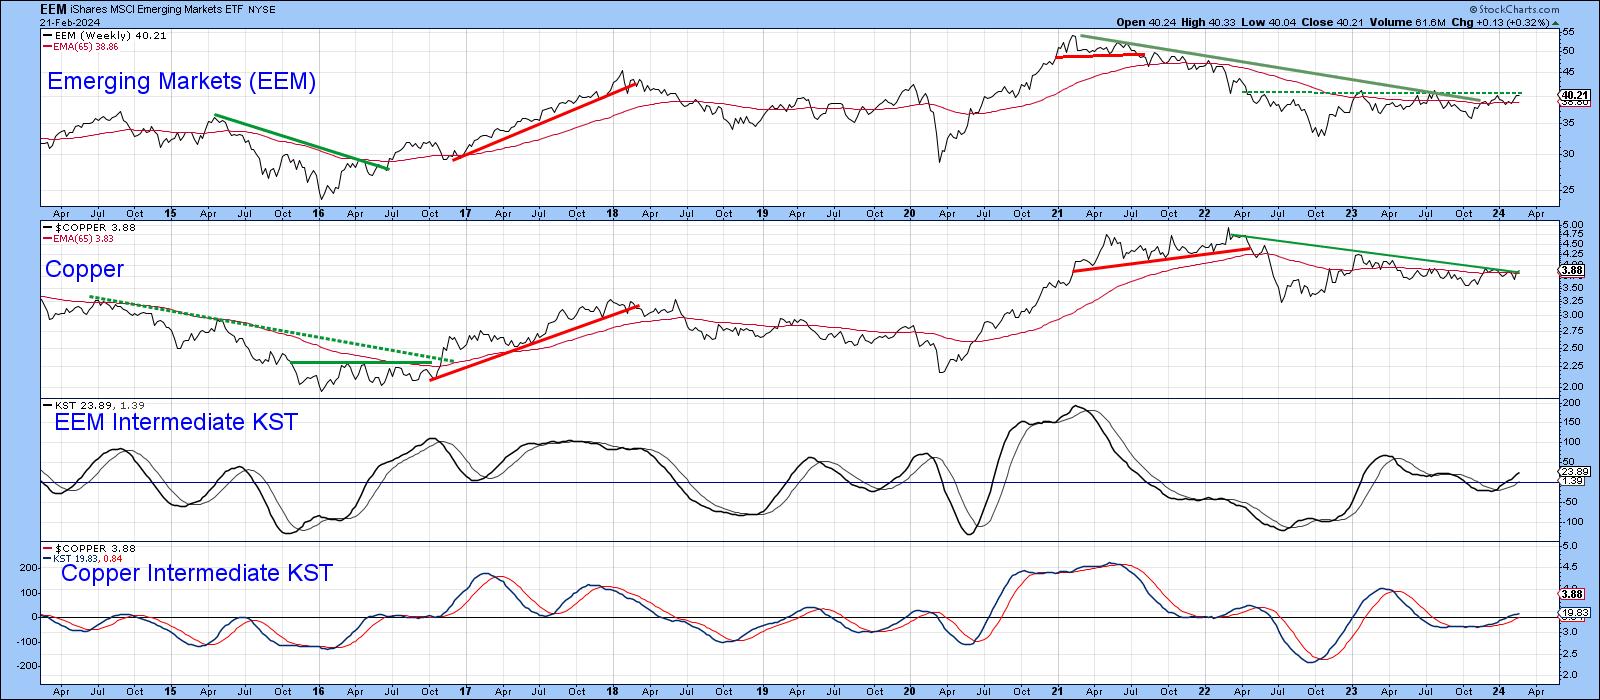
Emerging markets are diverse in their characteristics, but most are in some way tied to commodity prices. Copper is a key commodity used worldwide and Chart 5 compares the EEM to $COPPER. It is evident the broad moves in both price series have been similar. The EEM has been in an upwardly-biased trading range since 2006, which means that rallies have been relatively short-lived. Even so, KST buy signals, triggered from the copper price and flagged by the vertical line, have caught the majority of these upswings, especially when accompanied by a trendline break in the EEM and copper price. Right now, these same indicators are set up for another rally. It may look bullish, but it's of paramount importance to wait for the breakout to actually materialize rather than jumping the gun.
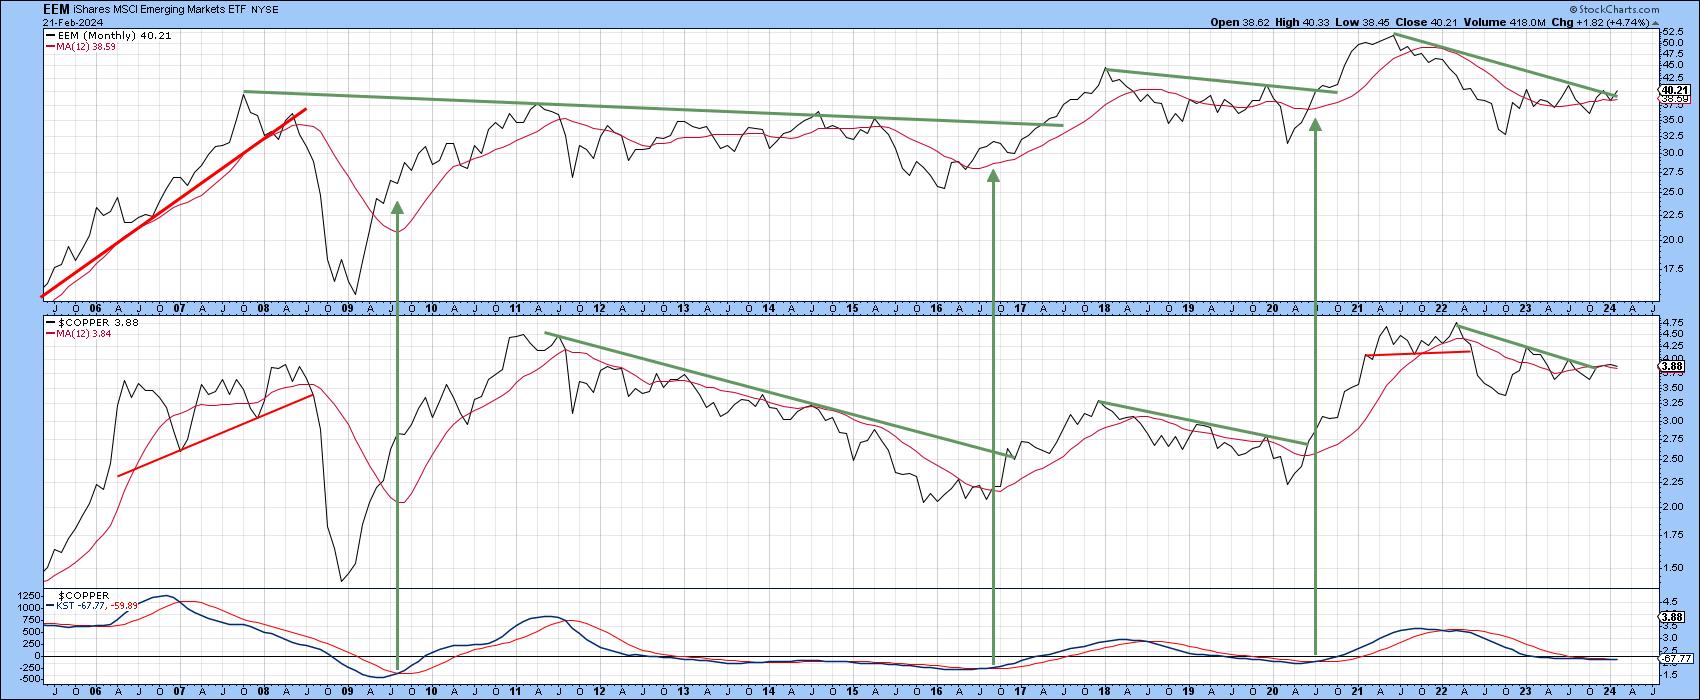
Chart 6 displays the same relationship between the EEM and $COPPER, but this time using weekly data. A comparison of their respective KSTs shows two things. First, they are very closely related. Second, both are currently bullish, which should be enough to support an upside breakout in the EEM and $COPPER -- but will it? Only time will tell.
Good luck and good charting,
Martin J. Pring
The views expressed in this article are those of the author and do not necessarily reflect the position or opinion of Pring Turner Capital Group of Walnut Creek or its affiliates.


