Three Intermarket Relationships That Say This Bull Market is Going Higher
Absorbing the information gleaned from monthly charts for various asset classes or sectors can help gain some perspective. However, I find that an examination of the relationships between them can be equally rewarding, if not moreso. That's because they point out the nature of the current investment environment, therefore acting as a cross-check on the individual markets themselves.
For example, you may think the trend of bond yields is positive because of a 12-month MA crossover. Since bond yields usually rise as a response to higher commodity prices, it's as well not only to check out their trend, but the technical position of the relationship between them as well. This acts as a cross-check to make sure that bond yields are acting consistently with what commodity prices are actually doing. But I digress, as the purpose of this article is to examine three intermarket relationships for stocks.
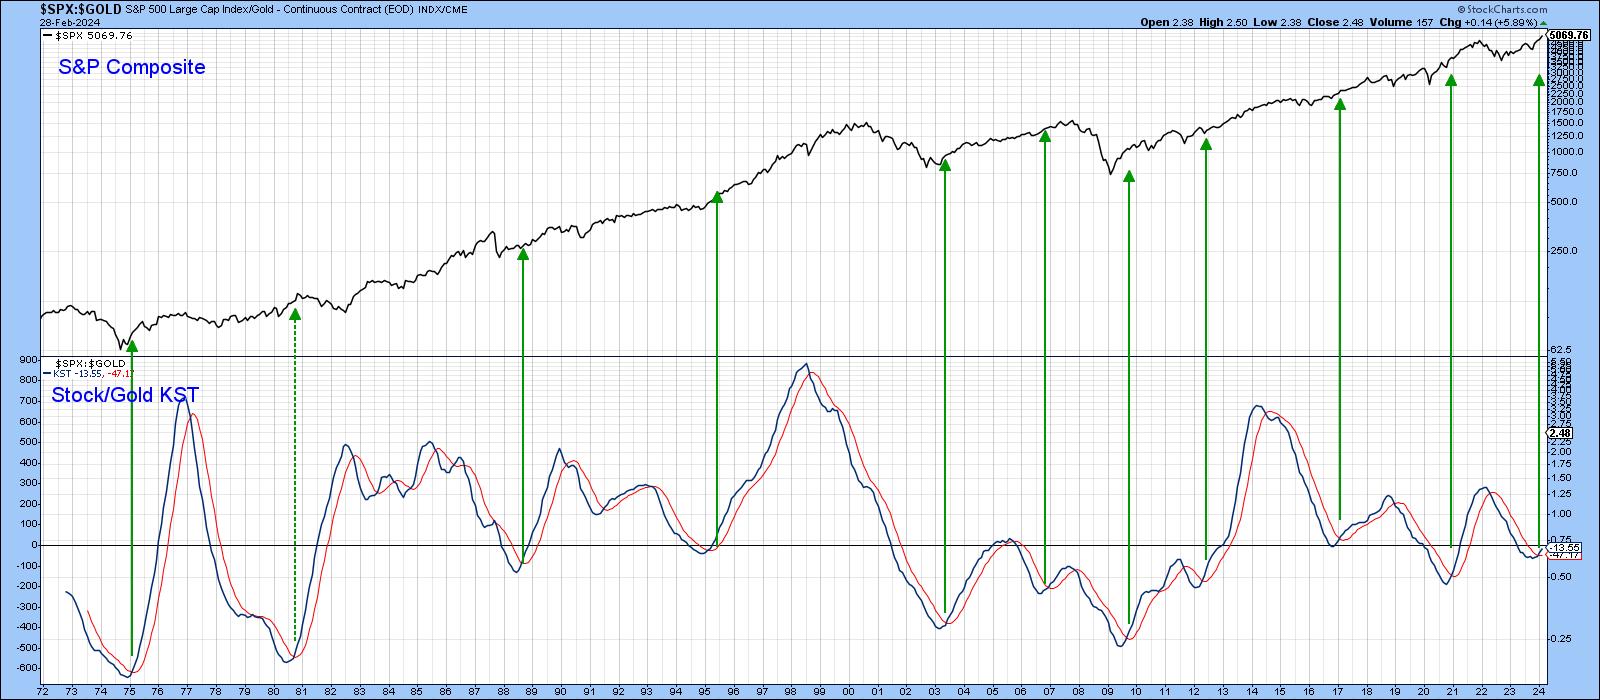
Stocks/Gold
Stocks like stability, whereas gold flourishes under an environment of instability, especially when that instability is caused by unusual swings in inflationary and deflationary forces. When gold rallies, but stocks advance even faster, it means that equities can deal with just about anything being anticipated by that higher gold price. It's when the problems being discounted by gold become overwhelming that the ratio and stocks themselves have a habit of running into trouble.
Right now, we appear to have the reverse problem. In that respect, Chart 1 shows the ratio has recently broken out from a 2-year consolidation pattern, which means the stock market is telling us it can deal with any of the international instability currently factored into the gold price.

Equally as important is the fact that the long-term KST (Chart 2), which you can read about here, has only recently crossed above its MA. The history of this relationship from the early 1970s shows that nine of the ten sub-zero KST buy signals were followed by an advance lasting at least 6 months, often longer. That action supports the view that the current bull market still has plenty of upside potential. On the other hand, if this smoothed momentum indicator reverses to the downside, it would negate the buy signal and represent a possible warning of trouble. I say "possible" as sell signals have not been as reliable as buy indications; in most situations, downside reversals have come from much higher levels. Given the recent upside break in Chart 1, an imminent downside KST reversal seems unlikely.
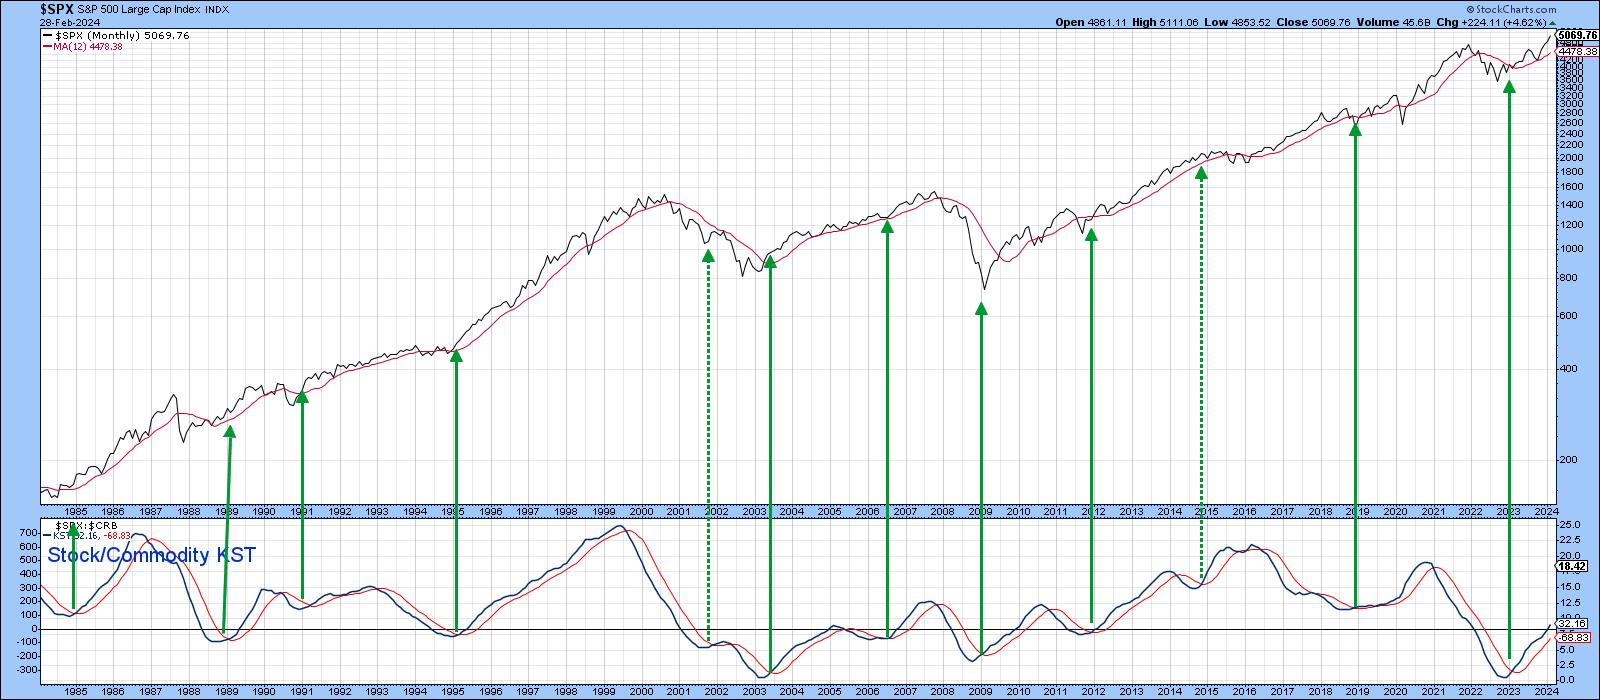
Stocks/Commodities
The stock market anticipates economic recoveries, whereas commodity prices tend to lag or coincide with business cycle lows. That means equity bear markets generally bottom ahead of those for commodities.
One sign of a stock market low is an upside reversal in the ratio between them. Chart 3 displays this relationship in the form of its long-term KST. The arrows flag KST buy signals. The latest was triggered in early 2023. I am featuring it here not for that signal, but because the indicator has only just reached its equilibrium point. Except for the 2005 sell signal, the remaining downside reversals came from substantially higher levels. In other words, based on the current position of the indicator, the bull market should have at least several months more to run.
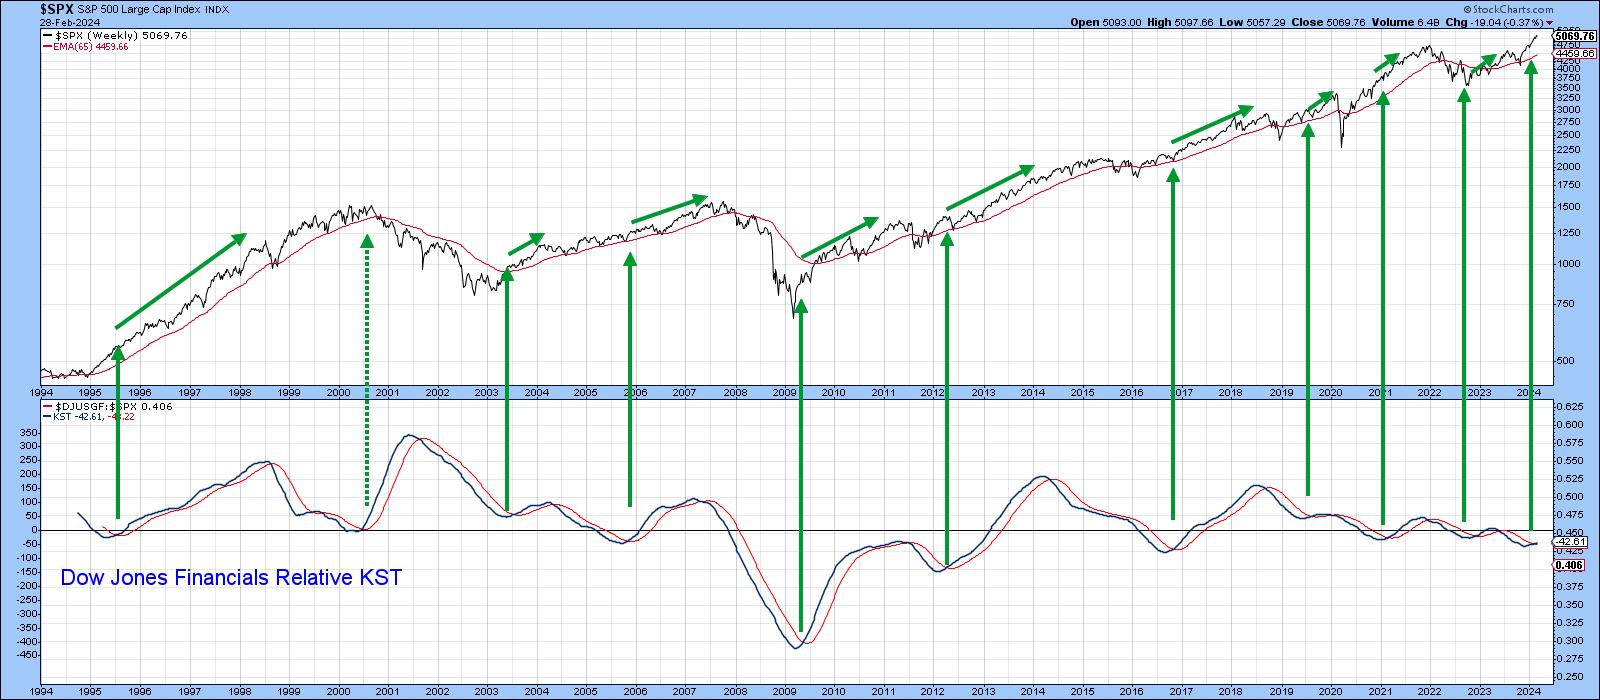
Financials vs. S&P Composite
Chart 4 compares the S&P Composite to a long-term KST calculated from the ratio between the Dow Jones Financial Index and the S&P itself. Superior performance by financials is a positive sign for the overall economy, as this sector plays a crucial role in fomenting economic growth and stability. Moreover, financial stocks are often seen as riskier investments due to their sensitivity to economic cycles and regulatory changes. When investors favor them, it reflects a positive outlook on risk-taking and economic growth.
The arrows back this up, as the Index typically rallies for an extended period following KST buy signals. This indicator has just turned bullish, further suggesting strength going forward.
Conclusion
The current position of these three relationships indicates that, notwithstanding corrections along the way, 2024 will continue to be a positive year for stocks. It's always possible that any of them will reverse prematurely, so we need to make sure they maintain these positive trajectories. Don't forget, these charts can be updated simply by clicking on them or saving them to one of your chart lists.
Good luck and good charting,
Martin J. Pring
The views expressed in this article are those of the author and do not necessarily reflect the position or opinion of Pring Turner Capital Groupof Walnut Creek or its affiliates.


