Everyone Has a Plan Until They Get Punched in the Face. Did Jerome Powell Just Get Punched in the Face?
The title of this article may be exaggerated, but, last Friday, the probabilities for an upward reversal in the rate of inflation later this year went substantially higher. That's because the gold price, an inflationary bellwether, broke out from a 4-year trading range to a new all-time high.
Amazingly, it happened with barely a whisper from the financial press, which was busy focusing on the potential for an AI bubble. That lack of public awareness is a far cry from stories of investors forming lines to buy gold at Canadian banks at the January 1980 gold peak. Those prices, when adjusted for inflation, still stand as a record 45 years later.
The Connection Between Gold Prices and Inflation
Last week's gold breakout is important because gold is a leading indicator for commodity, and subsequently CPI, inflation. Chart 1 shows that swings in the gold price act as a barometer for forthcoming movements in commodity prices. The chart displays the long-term KSTfor gold, copper and oil. The arrowsapproximate buy signals, when these individual momentum indicators cross their respective 9-month MAs. The solid arrows connect these points. Their general slanting to the right reflects the lead characteristics of gold and copper. The dashed ones isolate those rare occasions when this relationship is reversed, with gold or copper lagging. As you can see, the vast majority of turning points are spearheaded by gold, because market participants buy it now with the expectation of commodity inflation down the road.
The gold KST reversed to the upside some time ago and had tried to stabilize. However, last week's breakout has enabled it to re-accelerate slightly. All of this suggests that gold's action in the last year is forecasting higher commodity prices. Unfortunately, it does not tell us when.

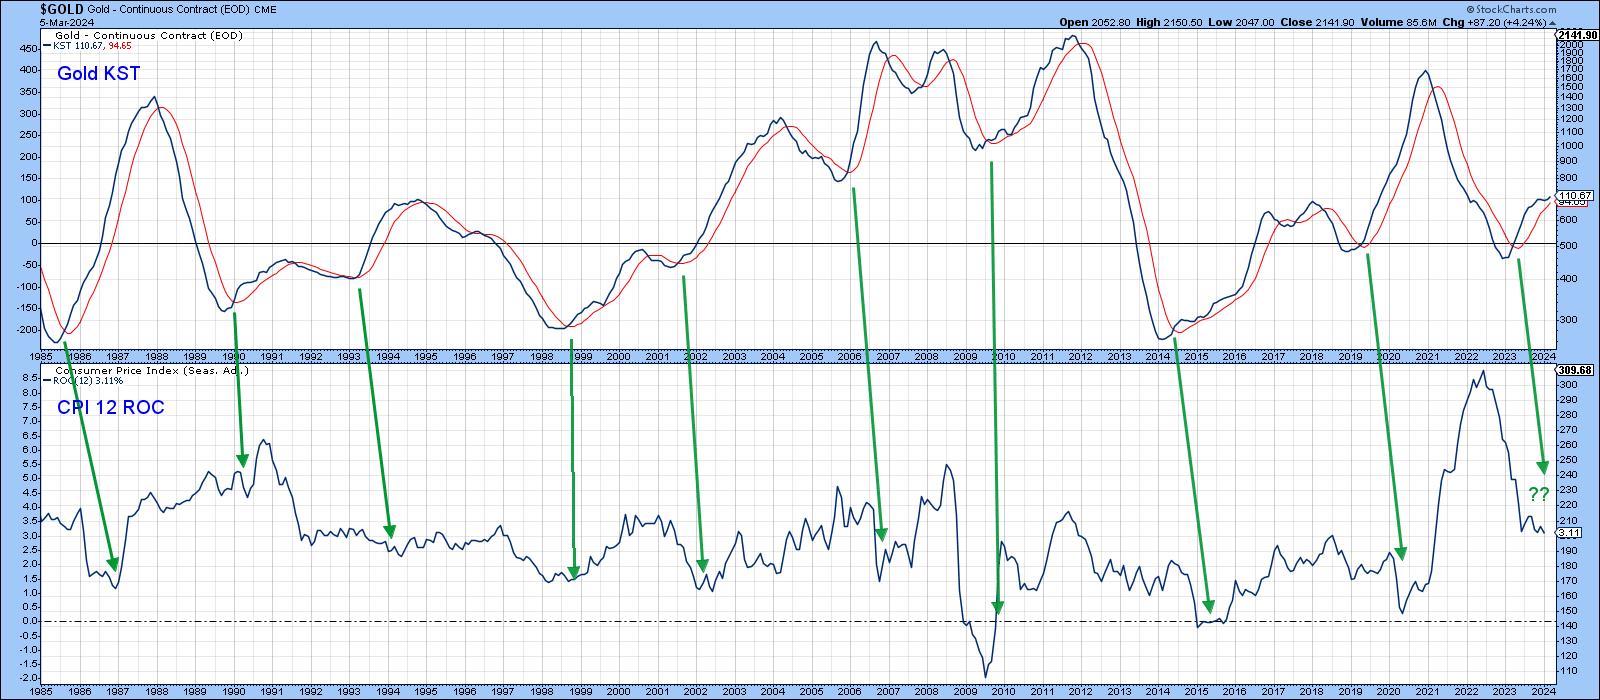
Even so, that's important because commodities often play a leading role for the CPI itself. Chart 2 connects the dots between the KST for the gold price and a momentum indicator for the CPI. Since the CPI tends to lag commodity prices, the lead between the time when gold momentum and CPI momentum bottom is greater. However, when we compare the slow-moving gold KST to a more sensitive 12-month ROC for the CPI, we find that gold KST buy signals usually coincide with or, more normally, lead the CPI. The leads and magnitudes of the CPI rally differ from cycle to cycle, but there can be little doubt that, when gold momentum bottoms, some kind of firming in the CPI follows.
Since the gold KST crossed its MA last summer, and bearing in mind the range of previous lags, the message currently being imparted by the price of the yellow metal is that an upside reversal in the CPI may not be far off. Unfortunately, this relationship does not tell us anything about the size of that move.
The Breakout
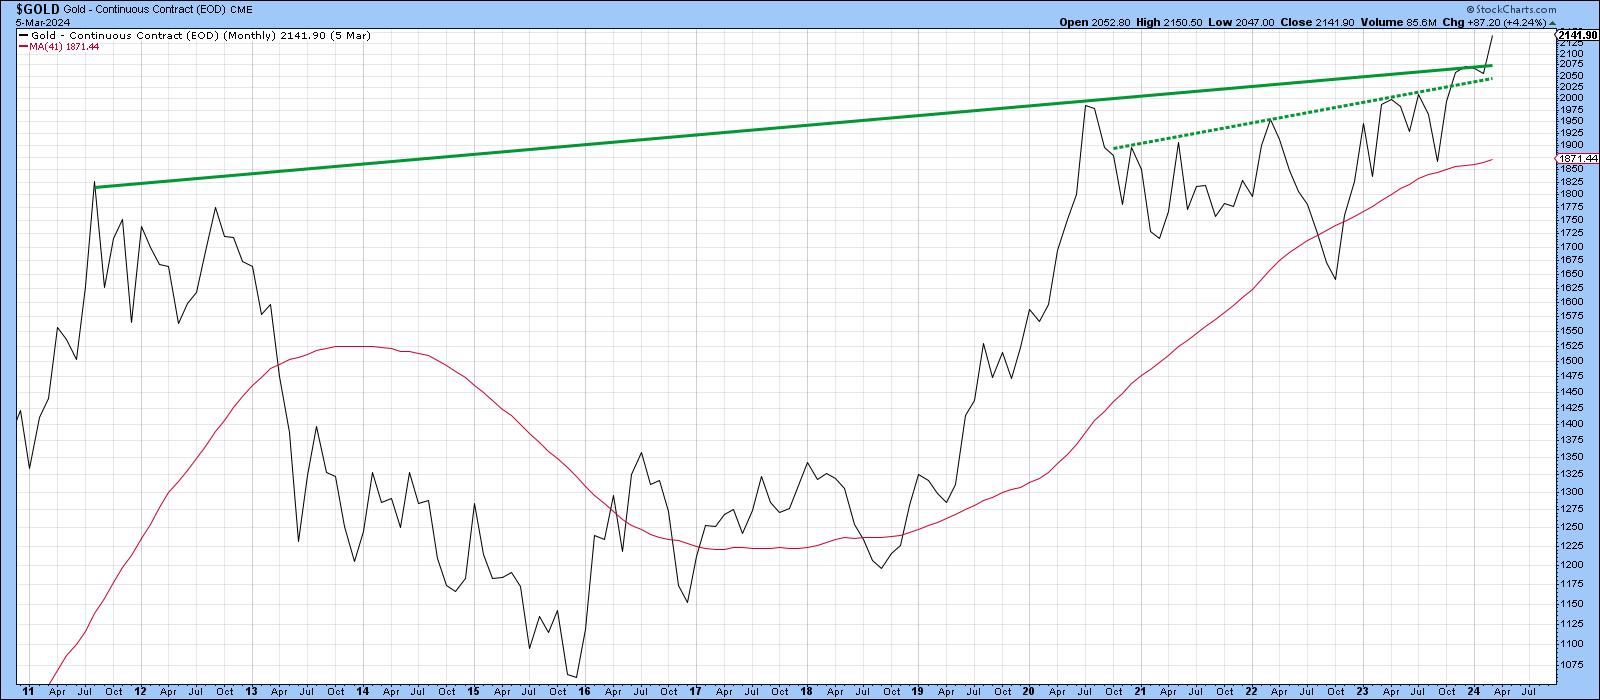
Chart 3 shows that the upside break was fairly significant. First, it completed a multi-year inverse head-and-shoulders by crossing above the dashed neckline. Second, the price also cleared the longer trendline emanating in 2011.
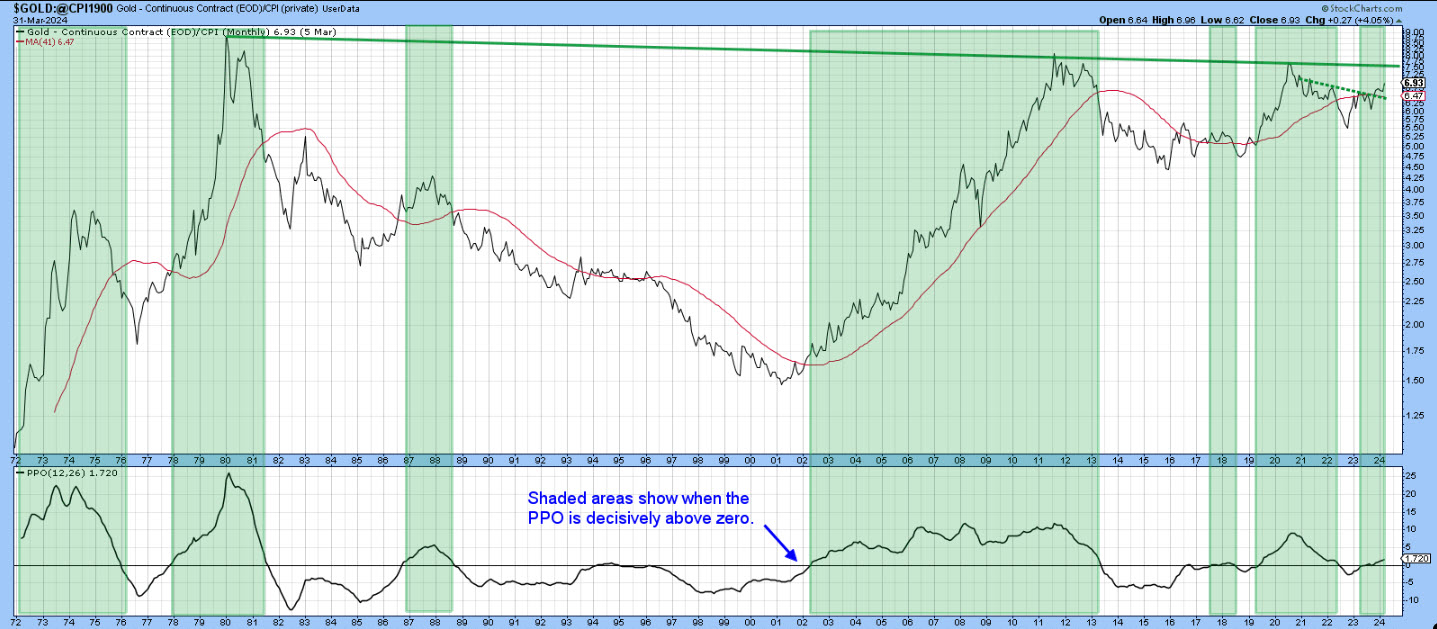
Finally, Chart 4 deflates the gold price by the CPI. As mentioned earlier, the peak price was registered in 1980. Since then, it has found resistance at the trendline connecting the 2020 and 2011 highs. Momentum is currently positive, since the PPO is above zero and rising and the inflation-adjusted price has cleared the neckline of a downward sloping reverse head-and-shoulders. A test of the all-important 1980-2024 resistance trendline appears likely. If it's successful, gold would be sending an even more clear-cut warning of forthcoming inflation.
Good luck and good charting,
Martin J. Pring
The views expressed in this article are those of the author and do not necessarily reflect the position or opinion of Pring Turner Capital Groupof Walnut Creek or its affiliates.


