Is China a Basket Case or a Screaming Buy?
By now it's common knowledge that the Chinese property sector is in crisis, foreign investment has slowed, and youth unemployment is at record levels. Should be time to sell Chinese equities, right? After all, we don't know when the other shoe is going to drop. They also say the time to buy is when (financial) blood is in the street, so how do we know which is the more likely scenario? The answer lies in a closer look at the technical position.
Chart 1 shows monthly bars for the Shanghai Composite since 2015. February's action formed a bullish outside bar. Outside bars occur when the trading range of the latest bar totally encompasses the range of its predecessor. Whenever you can spot one, it's always a good idea to take a closer look at its characteristics, because outside bars are not created equal.
Take the bearish outside bar that signaled the 2015 top. It formed after a substantial rally, which certainly offered something to reverse. It was also a very wide bar, so it reflected a huge battle between buyers and sellers in which sellers triumphed. Furthermore, it closed towards the low, indicating sellers were in control at the close. Finally, it's important to note that this was a monthly bar, which carries far greater significance than if it had it appeared in a daily chart. Outside bars are expected to have an influence from between 5-10 sessions, which in this case implies 5-10 months.

Now refer to the bullish outside bar for February. It certainly follows a nasty decline. Not as impressive as the advance that preceded the bearish pattern in 2015, but a significant one nonetheless. The bar is also quite wide compared to its predecessors. Most important of all, is that it opened not far from the low but closed almost at the high, leaving no doubt as to who was in control going into March.
There is also another wrinkle as to the importance of the bar. That's is because the price closed the month slightly above the extended neckline of a head-and-shoulders top. March action has enabled the Index to surpass the line more decisively, thereby providing additional proof that the downside break will turn out to be a whipsaw. All in all, I would rate this bar as a pretty strong indication that the primary bear trend is over.
That said, a one bar reversal pattern, taken in isolation, is not sufficient evidence to conclude that a primary trend has reversed. What is needed is a break above the 12- and 24-month MAs in the 3,100 area, as that would indicate beyond a reasonable doubt that the January and February drop was a whipsaw. That's important information to have, since false breaks are usually followed by above-average moves in the opposite direction to the break, as market participants scramble to get back to the right side of the market.
Chart 2 displays the Shanghai Composite together with its long-term KST. The flat nature of this momentum indicator over the last year indicates the fine balance between buyers and sellers, not unlike that which preceded the 2015 advance. That suggests that, if the green dashed down trendline is violated, we could well see a violation of the more important secular down trendline between 3,300-3400.
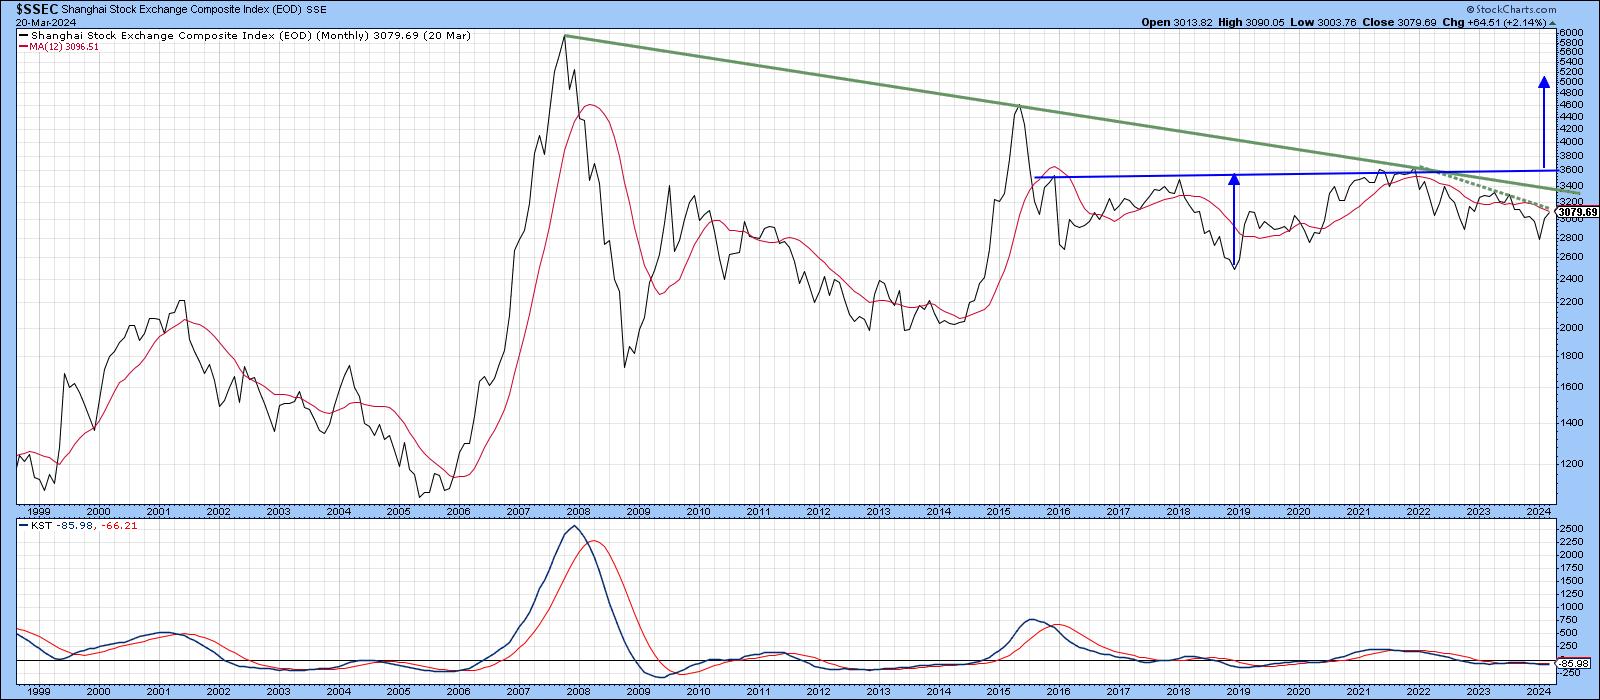
Finally, the blue arrows indicate an ultimate upside objective of around 5,200 in the event that a breakout above the blue line develops.
Two Chinese ETFs
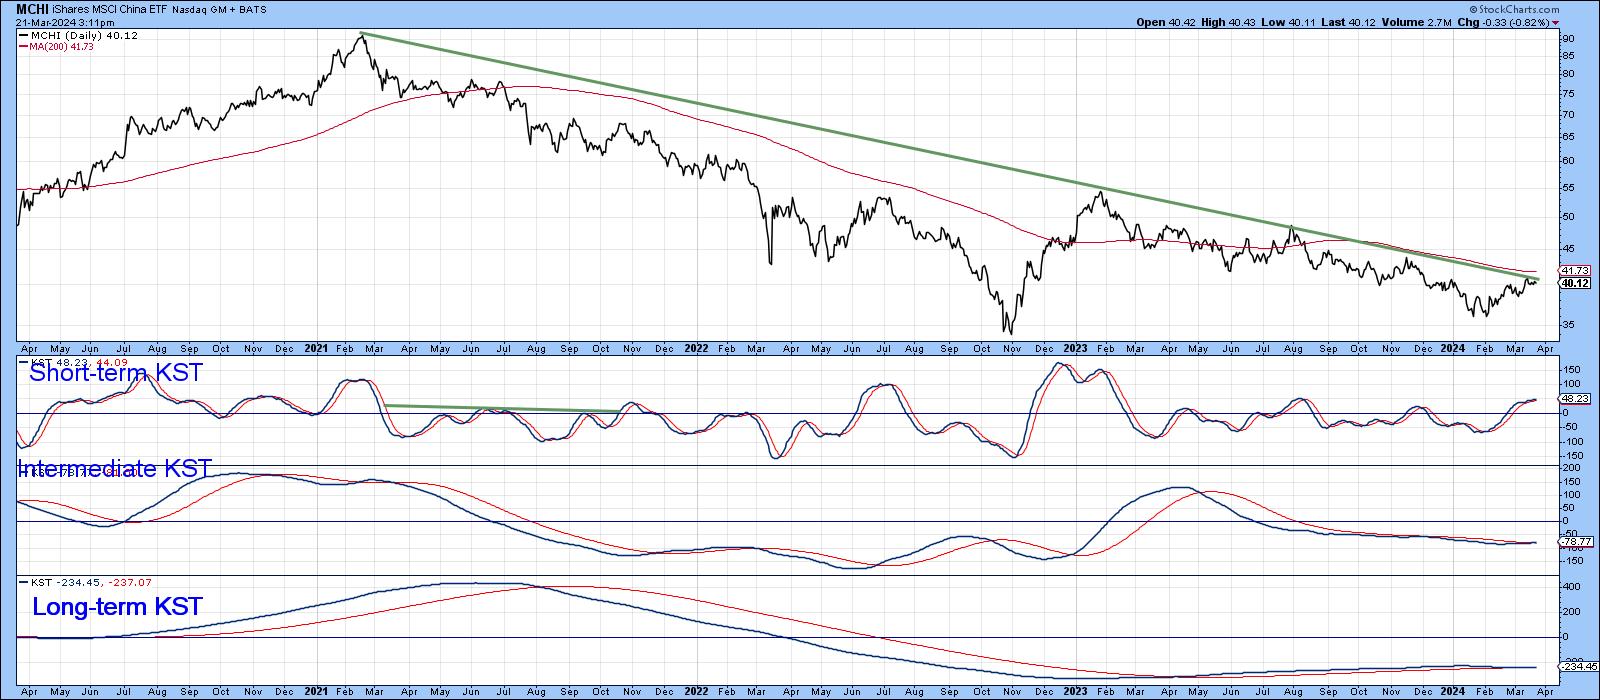
Chart 3 features the broadly-based iShares MSCI China. It is in a downtrend, but is close to the down trendline and 200-day MA. All three KSTs are currently bullish, but marginally so. That means an upside breakout, decisively clearing the MA and trendline, is likely to be followed by a robust rally.
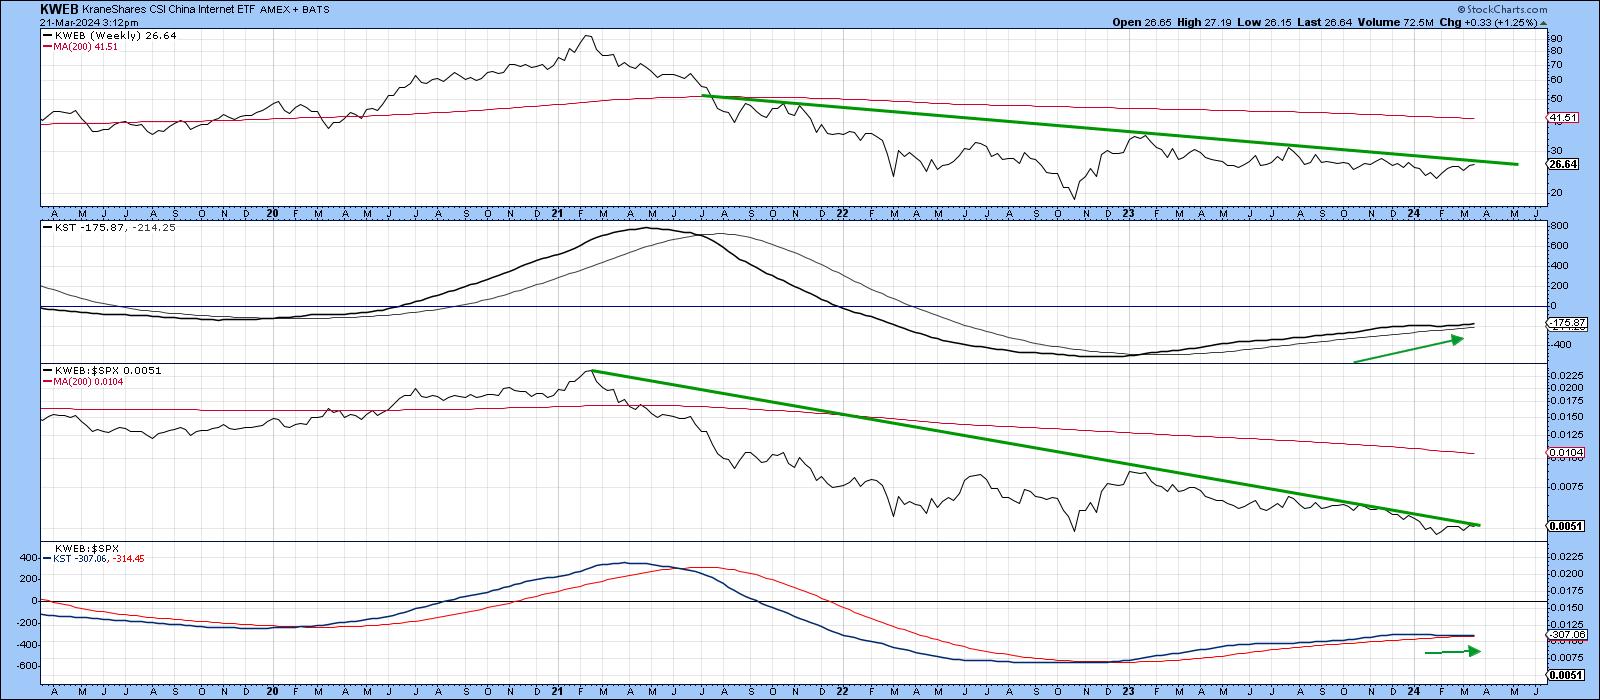
Finally, Chart 4 features the KraneShares CSI China Internet ETF (KWEB) together with its relative performance against the S&P. Both series are in a downtrend, but are literally right at their down trendlines, so a breakout is likely, especially as both KSTs are marginally positive.
Conclusion
The primary trend for Chinese equities is still bearish. However, it would not take much (e.g. a rally above 3,200) to trigger a reversal. A strong outside bar on the monthly charts together with a false downside break is likely to provide sufficient upside momentum to enable such a scenario to take place. Only then will this market become a screaming buy!
Good luck and good charting,
Martin J. Pring
The views expressed in this article are those of the author and do not necessarily reflect the position or opinion of Pring Turner Capital Groupof Walnut Creek or its affiliates.


