The Business Cycle is Edging its Way to a More Inflationary Stage
Last week, I pointed out the inflationary consequences of the recent gold breakout, as gold market participants initially expect prices to firm up in the commodity pits and later the CPI itself. This week, we will take those thoughts a step further by relating swings in industrial commodity prices to the business cycle.
At its core, the cycle reflects a set series of chronological events, which begin during a recession. The first event takes the form of lower interest rates, which in turn stimulate housing. Those houses then need to be furnished with consumer durables, the demand for which finally ends in the establishment of new manufacturing facilities.

Figure 1 features a curve representing the growth path of the economy during an idealized business cycle.
Bonds, stocks, and commodities form part of the chronological sequence, so the letters B, S, and C indicate their primary trend turning points. I would be the first to observe that this sequence does not always work out perfectly, but what it does do is give us an indication as to which assets to emphasize at any particular phase in the cycle. If you are interested in learning about this approach, you can read a full explanation in two educational articles, published here.
In order to establish the current phase of the cycle, we split it into six stages. Barometers or models for bonds, stocks, and commodities, which are published in my monthly Intermarket Review, are then used to determine the prevailing stage. For example, when bonds are the only positive model, a deflationary Stage 1 is indicated; when none are bullish, it's Stage 6; and so forth.
Last month saw the Commodity or Inflation Barometer join stocks and bonds in the bullish camp, thereby indicating a Stage 3. That's all very well, you may say but are the commodity charts consistent with the Barometers?
CRB Spot Raw Industrials
One of my favorite commodity indexes is that for the CRB Spot Raw Industrials, because it mostly reflects the action of commercial traders. Furthermore, of its 18 components, only cotton is traded on a public exchange, and is therefore is less subject to speculation and more influenced by business cycle-induced swings in demand and supply.
Chart 1 shows chronological sequence between upward reversals in the long-term KST for gold, lumber, and the CRB Spot Raw Materials. Note how gold anticipates commodity price inflation by turning first, followed by lumber and, finally, the CRB Spot. Lumber is a leading commodity due to its strong connection to the interest-sensitive housing industry. Gold turned up some time ago, with lumber following through fairly recently. The CRB, which has gone flat, should be the next to turn, assuming the sequence progresses according to plan. Bottom line: commodities are positioned for a bull market.
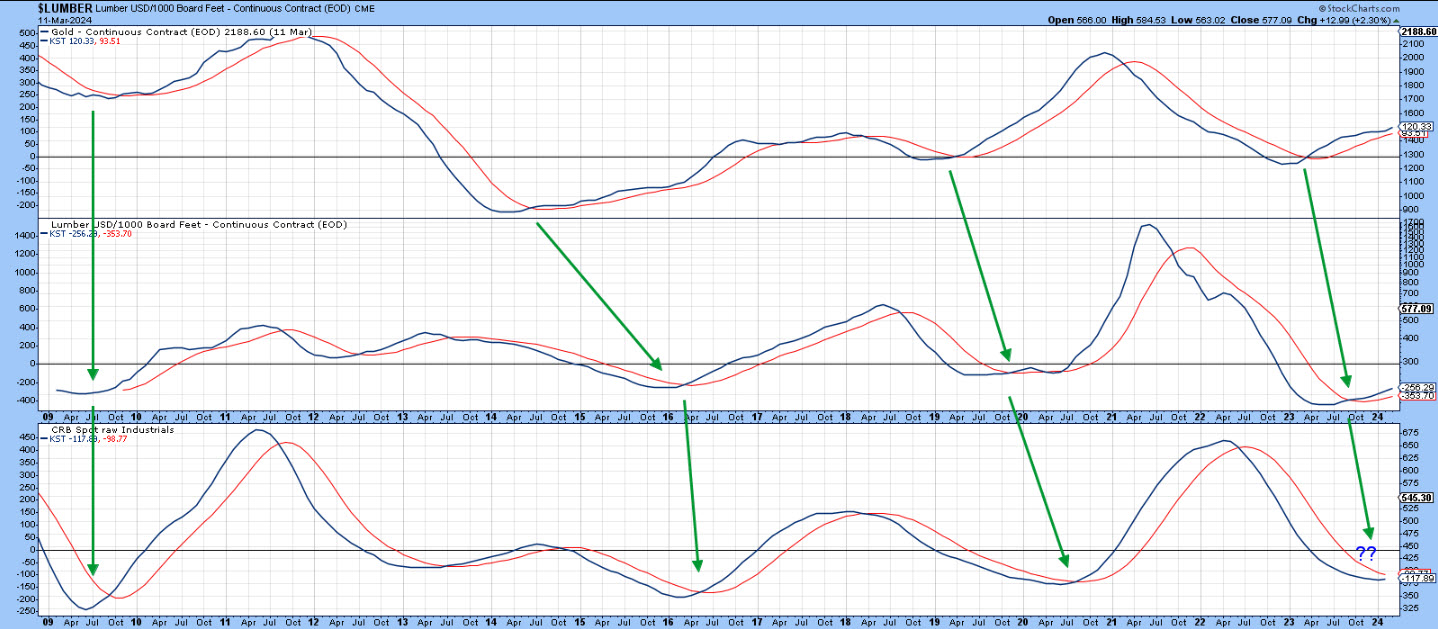
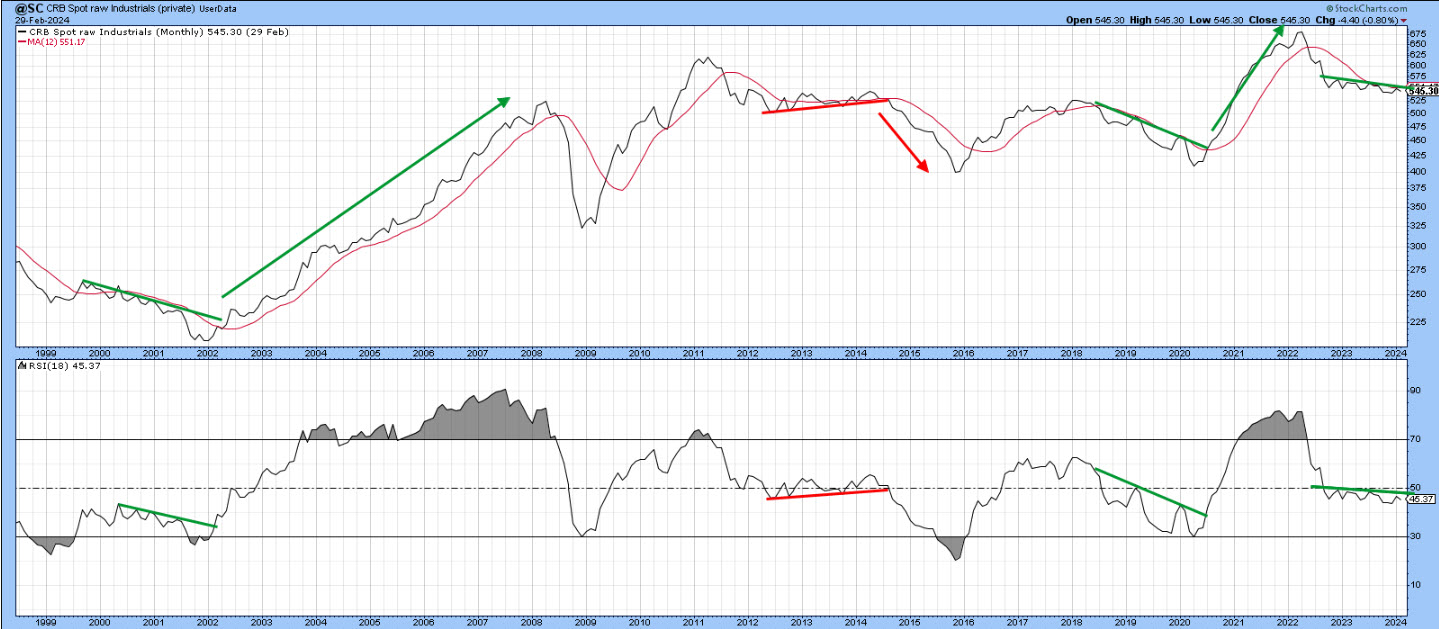
Chart 2 shows that the Index has been trading in a very narrow band during the last year, as has its 18-month RSI. The technical position is not yet bullish, but it would only take a swing of 10 points or so to tip the balance to the bullish side. Three joint trendline setups since the turn of the century were followed by a strong move, two up and one down.
Clearly, the Index is set up for a nice rally. All that is required is a trigger of some kind. After all, the cycle is in Stage 3, and the leading characteristics of gold and lumber are consistent with a new bull market for industrial commodity prices. That said, commodity bull markets have traditionally got underway after a cyclical drop in interest rates has taken place. That's a missing ingredient in the current situation, implying a smaller bull market than normal.
What follows is a series of commodities that are in a position to benefit from a commodity bull market.
Copper
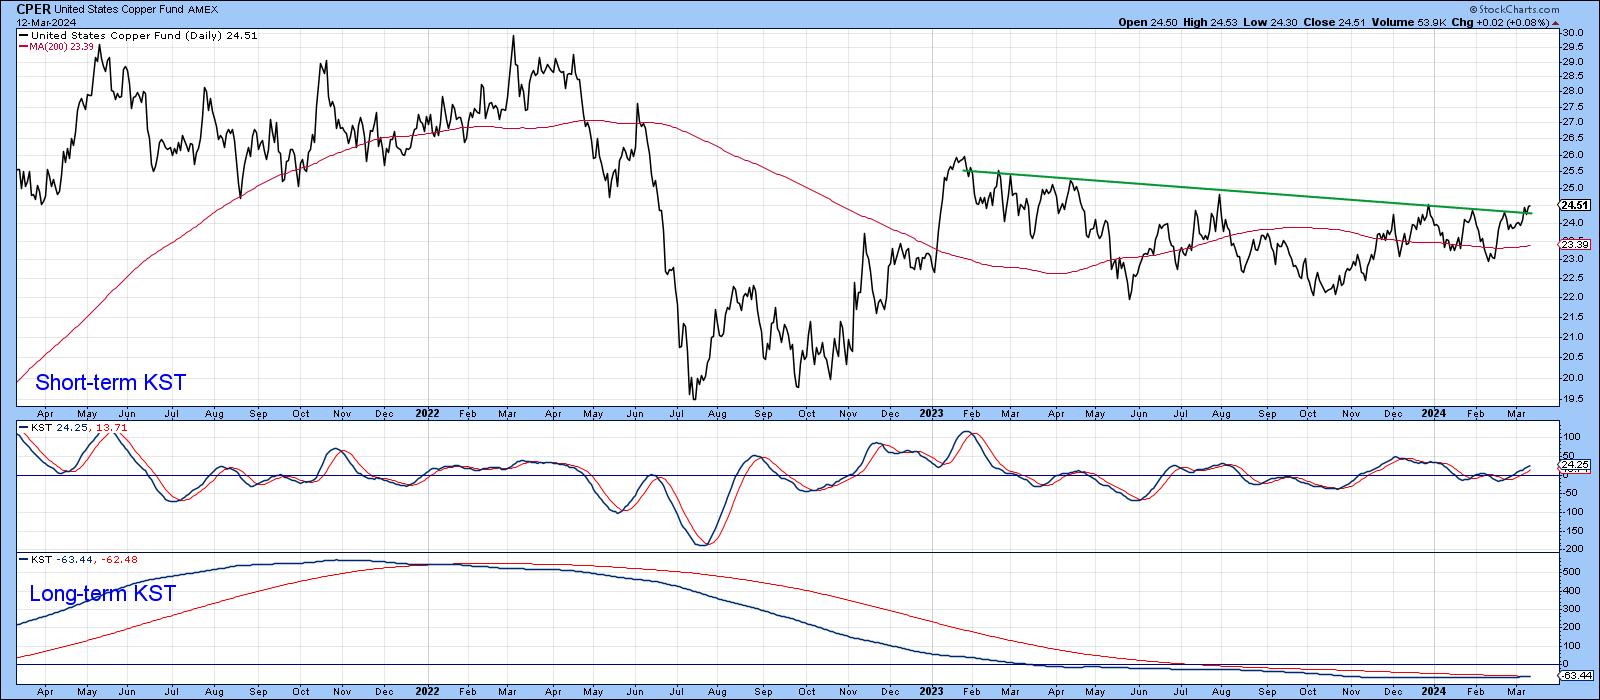
Chart 3 features the copper price, which is on the verge of a decisive upside breakout. That's probably going to happen, because the short- and long-term KSTs are currently positive.
Crude Oil
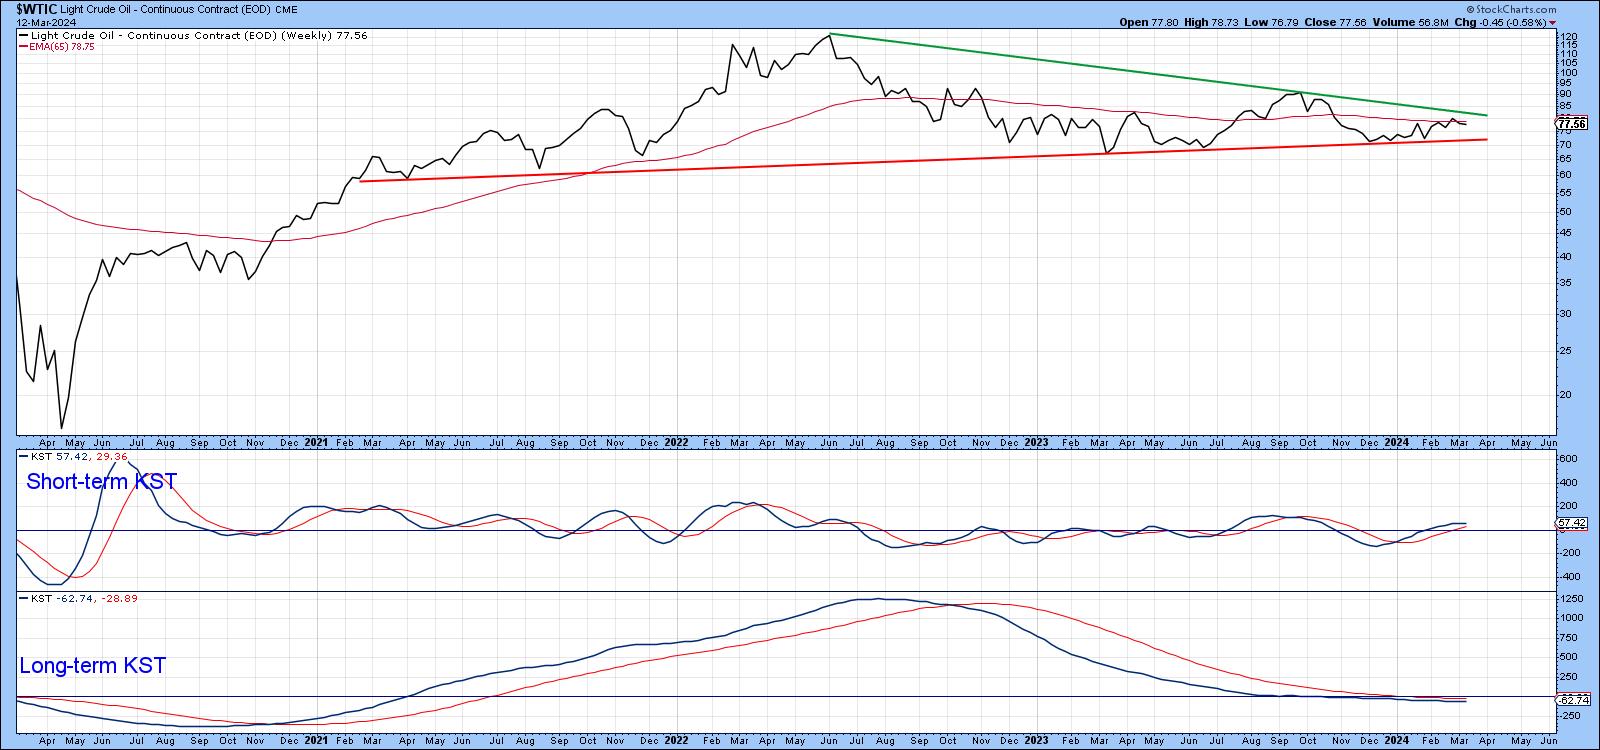
Another key commodity, which usually lags copper, is crude oil in Chart 4. If it falls below the red line, it will have completed a head-and-shoulders top. That seems unlikely, though, as the short-term KST is bullish and it wouldn't take much effort to surpass its green bear market trendline. There is no dispute that it faces a challenge at this resistance, and that provided by the 65-week EMA.
Agricultural Commodities
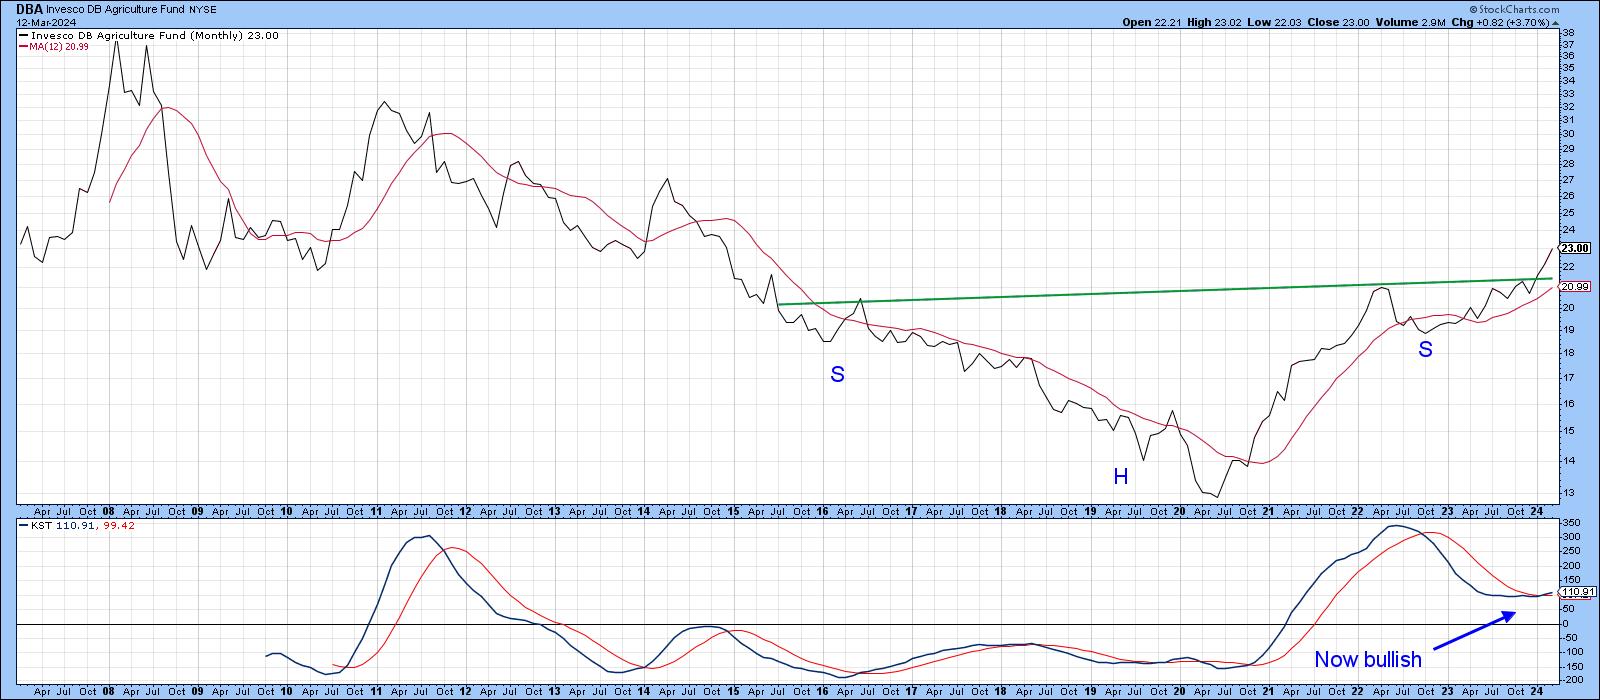
Chart 5 features a commodity sector that is already in a bullish phase, the Invesco DB Agricultural Fund. That's because it has completed a base, crossed decisively above its 12-month MA, and began experiencing a bullish long-term KST.
Hail Silver?
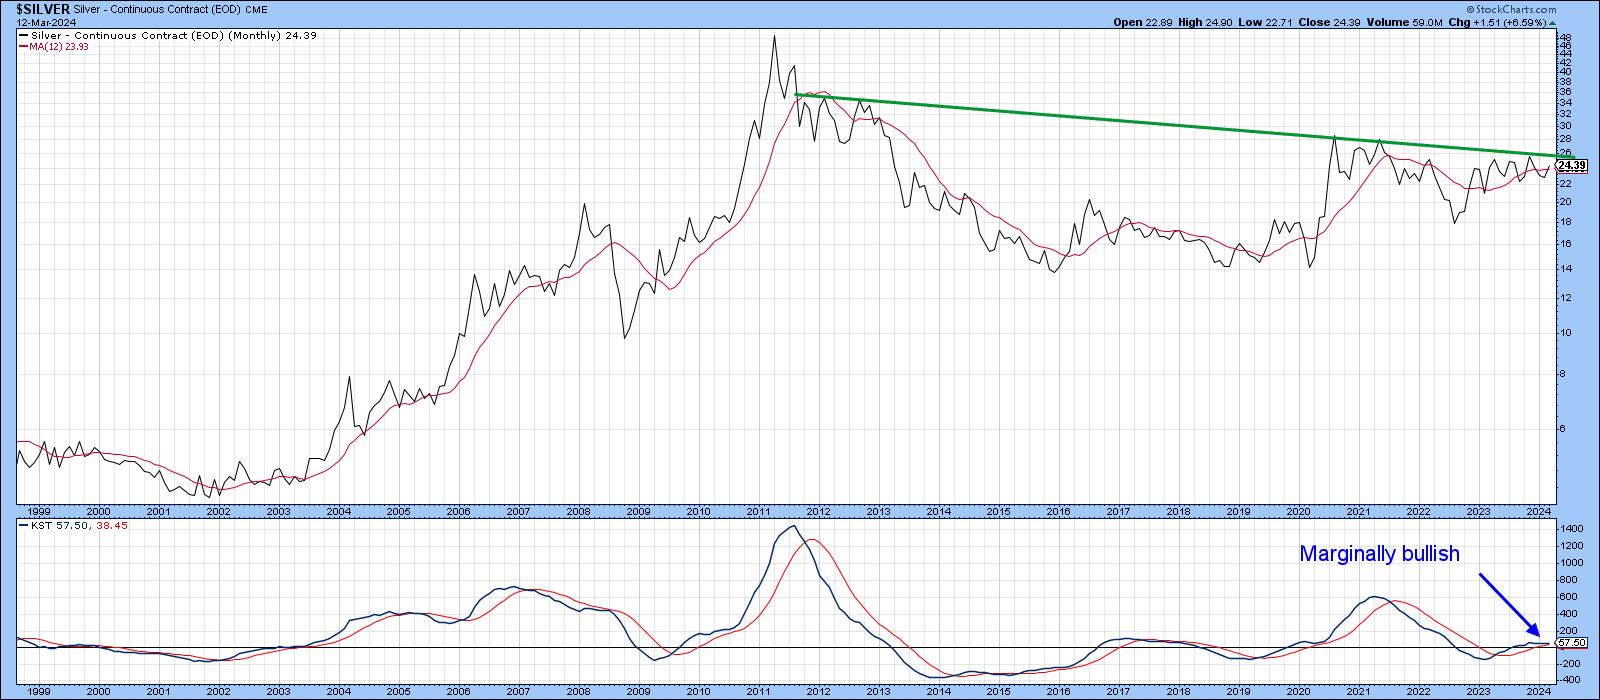
Finally, silver is starting to look interesting following 12 years in a consolidation phase. The price is slightly above its 12-month MA and the long-term KST is positive. However, it really requires a month-end close above $27 to confirm what could be a very exciting breakout.
Good luck and good charting,
Martin J. Pring
The views expressed in this article are those of the author and do not necessarily reflect the position or opinion of Pring Turner Capital Groupof Walnut Creek or its affiliates.


