Are We There Yet?
Back in early February, I wrote an article entitled "Only a Fool Would Try to Call a Correction in a Bull Market, So Here Goes". In it, I was trying to point out that counter-cyclical corrections are notably difficult to identify, as they often terminate just at the point where most participants have begun to realize one is underway. In a primary bull market, short-term oscillators are very sensitive to oversold conditions and tend to shrug off overbought ones, often leading the unwary to sell prematurely for a downturn that never materializes. I also made the point that corrections can be broken down into two buckets, internal and index. Internal corrections begin as breadth oscillators peak out and participation becomes more selective, only later extending to the S&P Composite itself.
Ironically, people tend to look at the S&P as their icon in judging whether a downside or sideways correction is underway. That's fine for those solely exposed to its principal components; however, if an internal correction is underway, it means fewer and fewer stocks are participating on the upside, thereby making the task of stock selection that much more difficult. In short, don't believe everything the indexes are telling you.
Chart 1 tells us we have been in an index correction since late March, but the internal one started way back January, as that's when the 10-day MA of NYSE stocks trading above their 50-day MA peaked. It's now dropped quite a bit and is just above its oversold zone.

The question now is whether that's sufficient or if we are likely to see further downside.
Our first step is to query whether the primary trend is still positive, as its direction will greatly influence the magnitude and duration of any correction. The vast majority of primary trend indicators I follow are still bullish. The long-term KST for the relative strength of financials, in Chart 2, is one example. Consequently, I am assuming a brief and truncated counter-cyclical move.
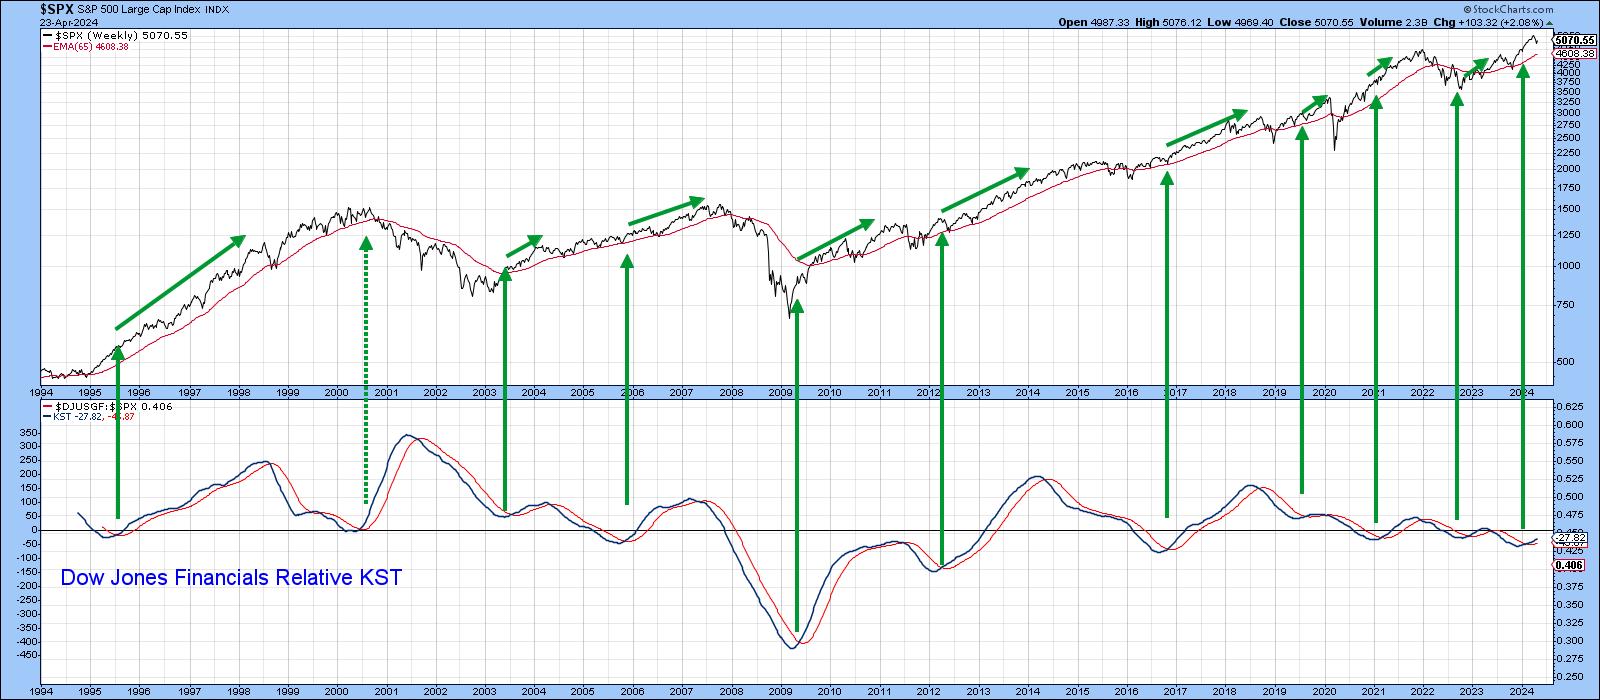
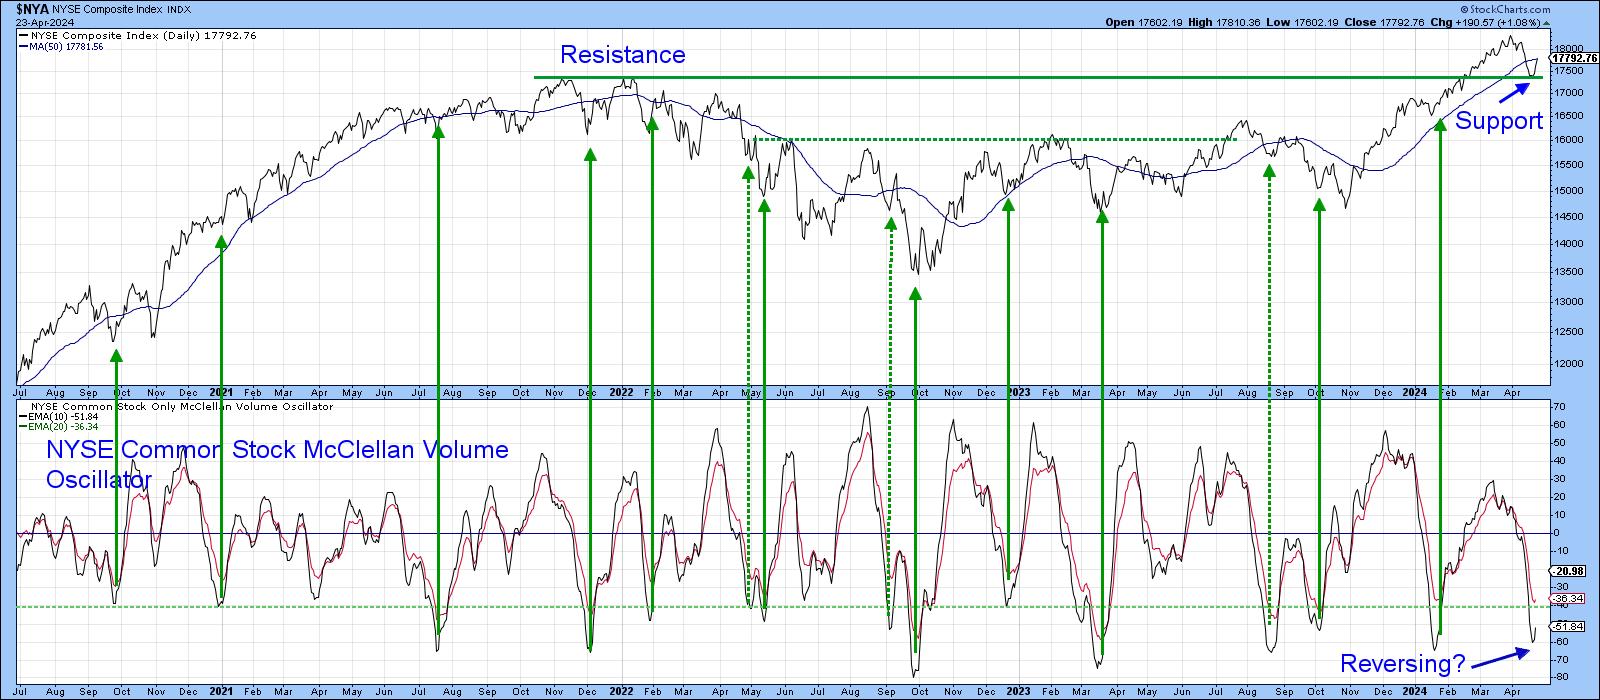
Chart 3 offers some preliminary evidence that the correction may be over, at least in terms of maximum downside for the NYSE Composite. That's because the Index has fallen back to support in what was previously resistance at its 2021 high. Furthermore, the 10-day EMA of the McClellan Common Stock Volume Oscillator has begun to turn up from a deeply oversold condition. The solid green arrows indicate that this kind of action has typically been followed by a rally. However, a couple more sessions are needed to make sure the indicator's reversal is genuine.
A deeply oversold condition is nice to see, but it doesn't always pan out when the correction develops under the context of a primary bull market. Currently, my Dow Diffusion indicator is close to such a reading, but is still declining. Even so, a reversal from its current reading has proven sufficient to signal a new rally under bull market conditions. That happened several times between 1220 and 2021. Note also that the DIA also bounced from support in the area of its extended breakout trendline.
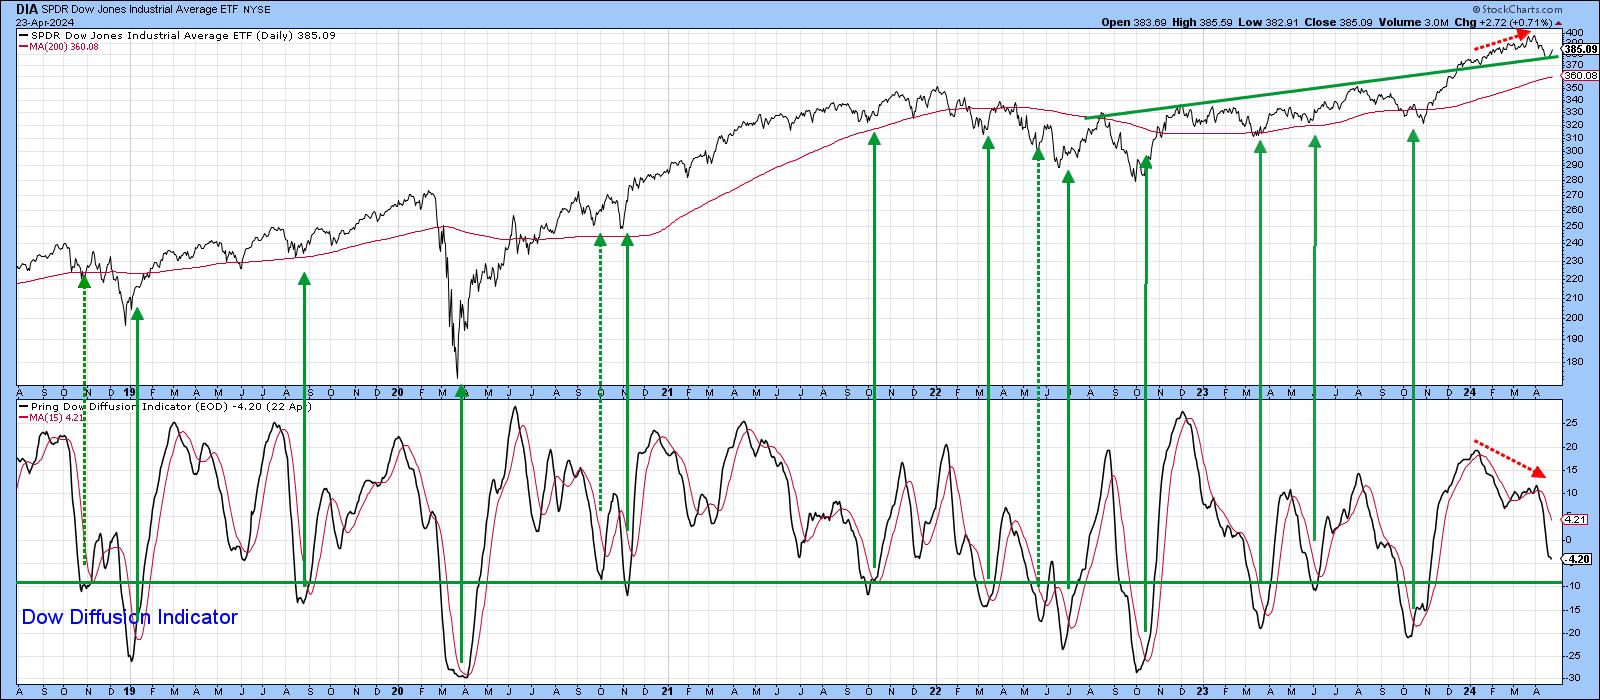
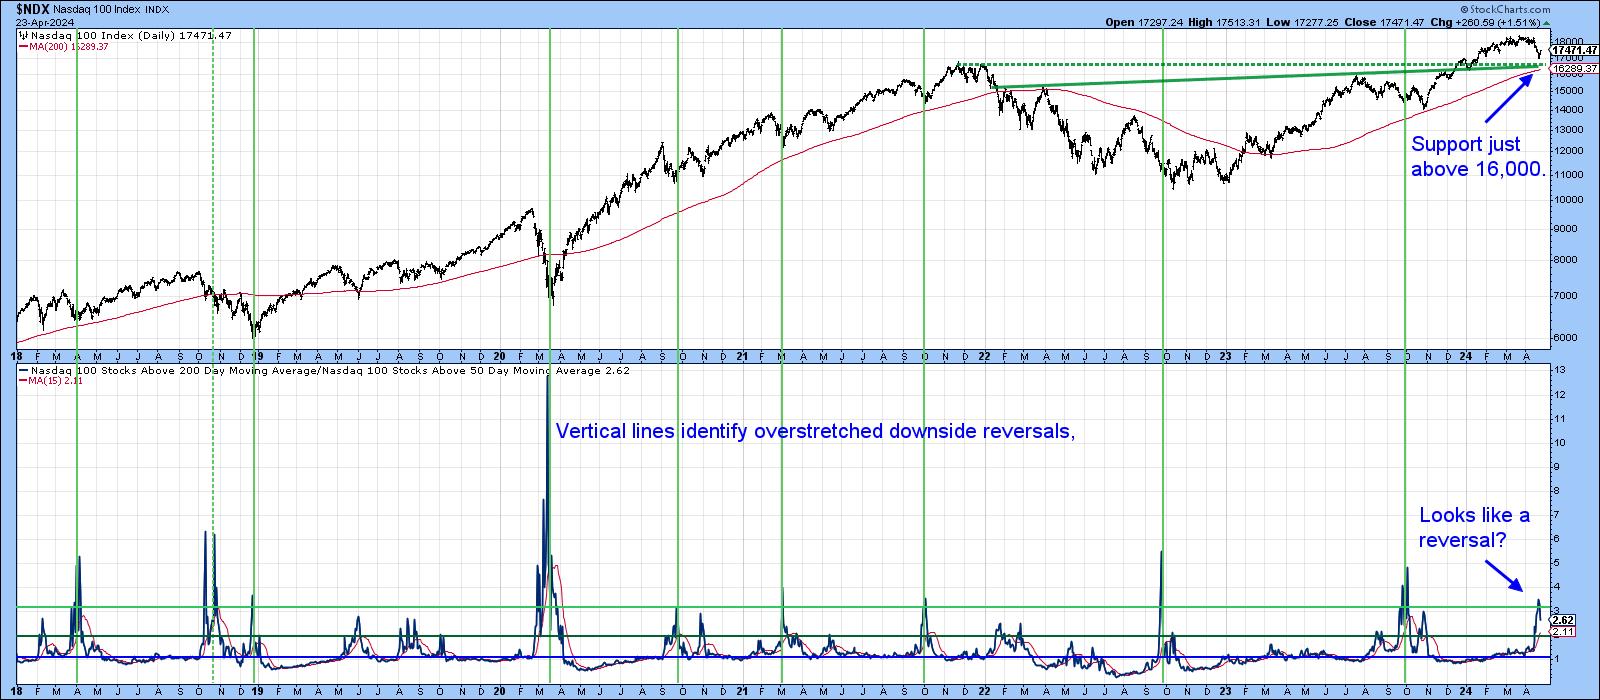
Chart 5 shows an indicator that subtracts the number of NASDAQ stocks above their 50-day MA from those above their 200-day MA. A high reading indicates an unusually fast and sharp decline, so that when it reverses to the downside, this is typically followed by a rally. Examples have been highlighted by the vertical lines. It has experienced only one false positive since 2018, and that occurred in 2018, so its recent reversal is a very encouraging sign.
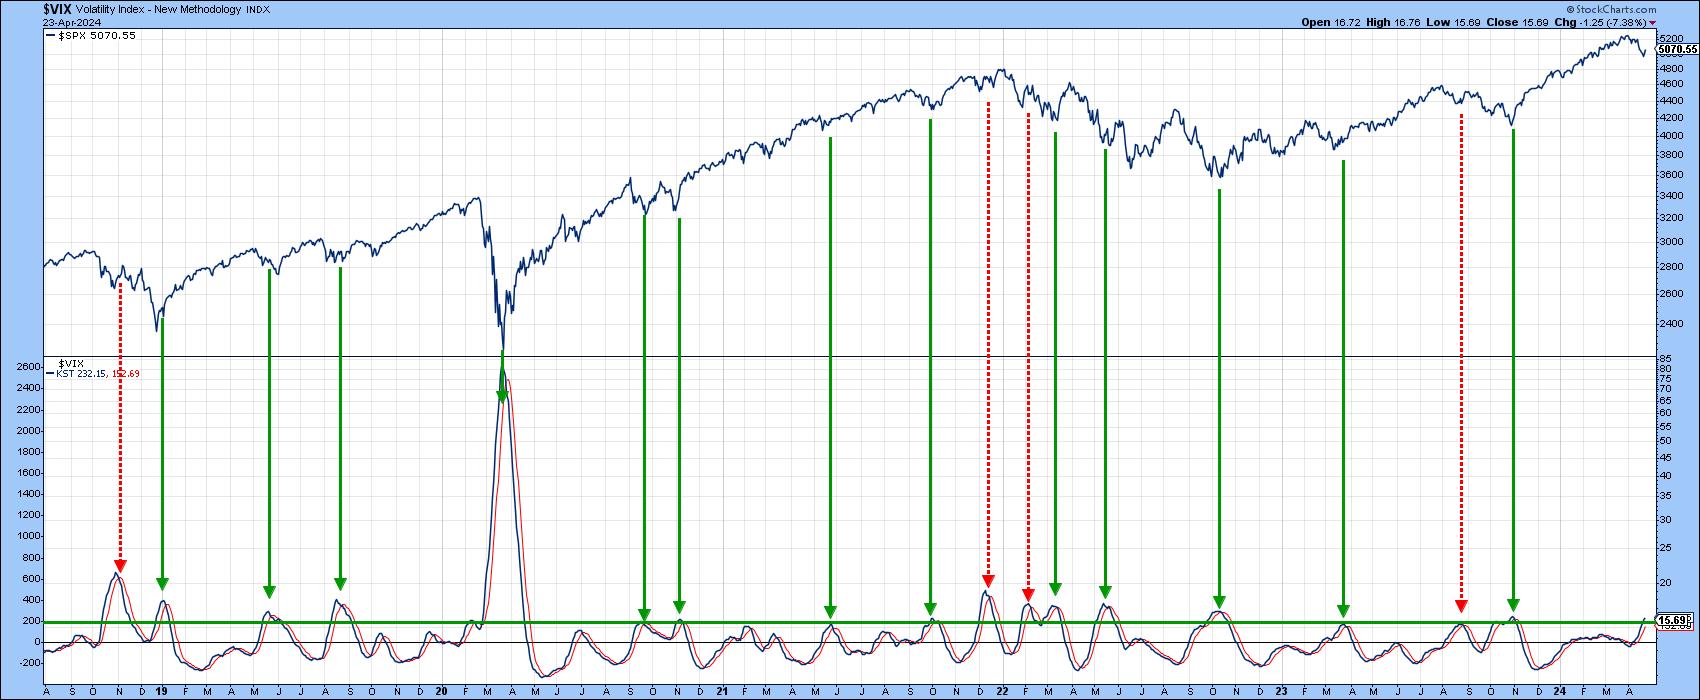
Finally, Chart 6 features the daily KST for $VIX. It shows that whenever this momentum indicator reverses to the downside from a position at or above the green horizontal line, a rally usually develops. It's not a perfect indicator, as testified by the red dashed arrows. However, in a bull market environment, the odds of its success are greatly enhanced. There is just one problem; it has reached the green line, but is still rising.
Conclusion
The DIA and NYSE Composite have reached support and bounced. Since several short-term indicators are looking positive and most primary trend indicators are bullish, this is not inconsistent with a short-term bottom. However, Charts 1 and 4, featuring the percentage of stocks above their 50-day MAs and Dow Diffusion indicator, diverged negatively at the March peak and are not yet seriously oversold. This influence may well result in a trading range, as these two indicators drop to overstretched readings and the market works through a post-1901 moderately weak election year seasonal into mid-May. Don't forget, you can update any of the charts in this article simply by clicking on them.
Good luck and good charting,
Martin J. Pring
The views expressed in this article are those of the author and do not necessarily reflect the position or opinion of Pring Turner Capital Groupof Walnut Creek or its affiliates.


