Precious Metals Reach Exhaustion
In the last couple of weeks, I have been reading stories about shoppers picking up gold bars in, of all places, Costco. According to Gemini, the AI branch of Google, "Reports indicate they may be selling up to $200 million worth of gold bars every month."
Normally, thin reed indicators of unusual investment activity like this are a subtle indication of a frothy market. However, I did not think much about it, as the gold uptrend seemed pretty healthy except for the fact that gold shares had been dragging badly since their 2020 peak.
And then Friday happened, and we were presented with major signs of exhaustion for both gold and silver on the daily and weekly charts.
Chart 1 features weekly candlesticks for the SPDR Gold Shares (GLD) and shows that last week's action formed a gravestone doji. These are unusual and bearish patterns. Gravestones should open near the low, rally up sharply on intrabar trading, but close near the opening price. This action results in a very small real body that forms well off the high. As a result, most traders who bought during the period covered by the bar go home with a loss. Candles are expected to have an effect for between 5-10 bars; it's often much more.
In this case, we are looking at weekly data, so the gravestone's negative influence should last between 5-10 weeks. This one formed after a strong rally, so there is lots of potential for taking profits. The heavy volume emphasizes the huge battle between buyers and sellers, again enhancing its significance.

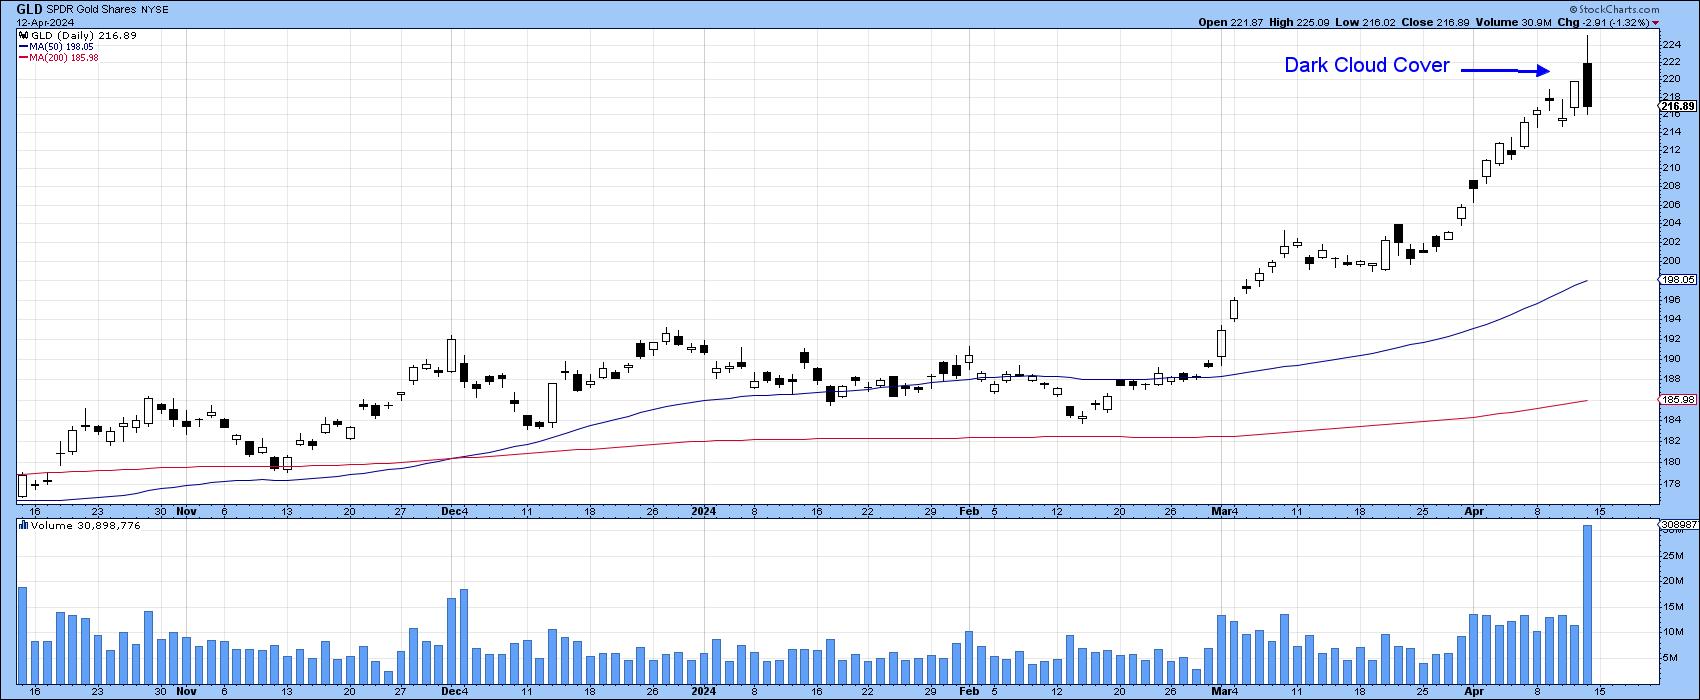
The daily chart also shows a candlestick reversal pattern in the form of dark cloud cover. This pattern also indicates buyer exhaustion, as Friday's price gapped higher at the opening but closed more than halfway down Thursday's white real body. The width of the candle and the volume accompanying it also adds to its potential power.
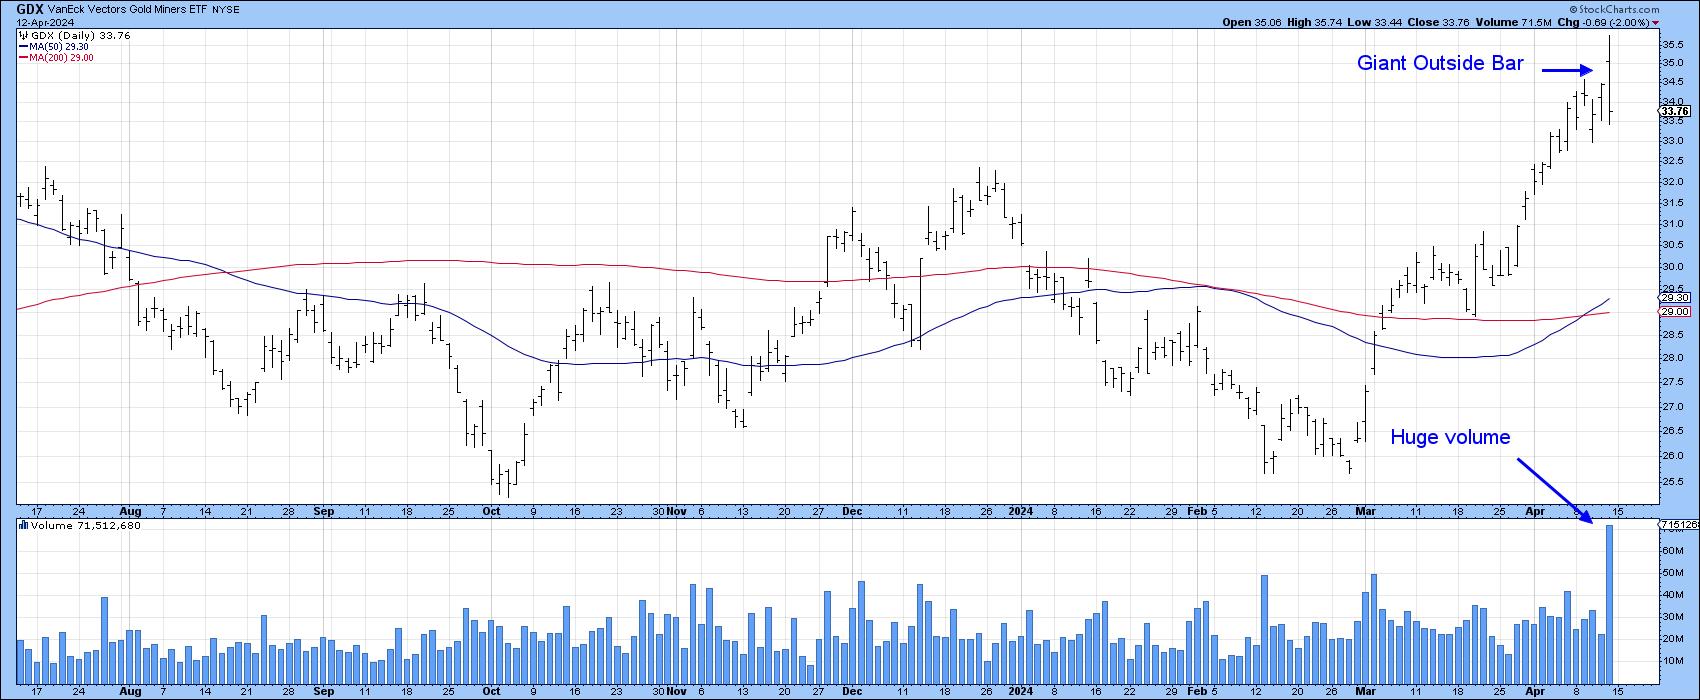
Gold shares (Chart 3) have also been rising sharply since the beginning of March. They, too, are now showing signs of exhaustion. Friday's price action totally encompassed Thursday's to form an outside bar, or, in this case, an outside day.
Four things enhance the significance of such patterns. First, the price should close in the lower half of the bar to indicate seller dominance. If it opens in the upper half, so much the better. Second, the wider the bar relative to its predecessor, the greater the battle between buyers and sellers. Third, the sharper the preceding rally, the greater the potential for profit taking. Finally, the heavier the volume, the bigger the battle between buyers and sellers. This pattern scores on all four fronts.
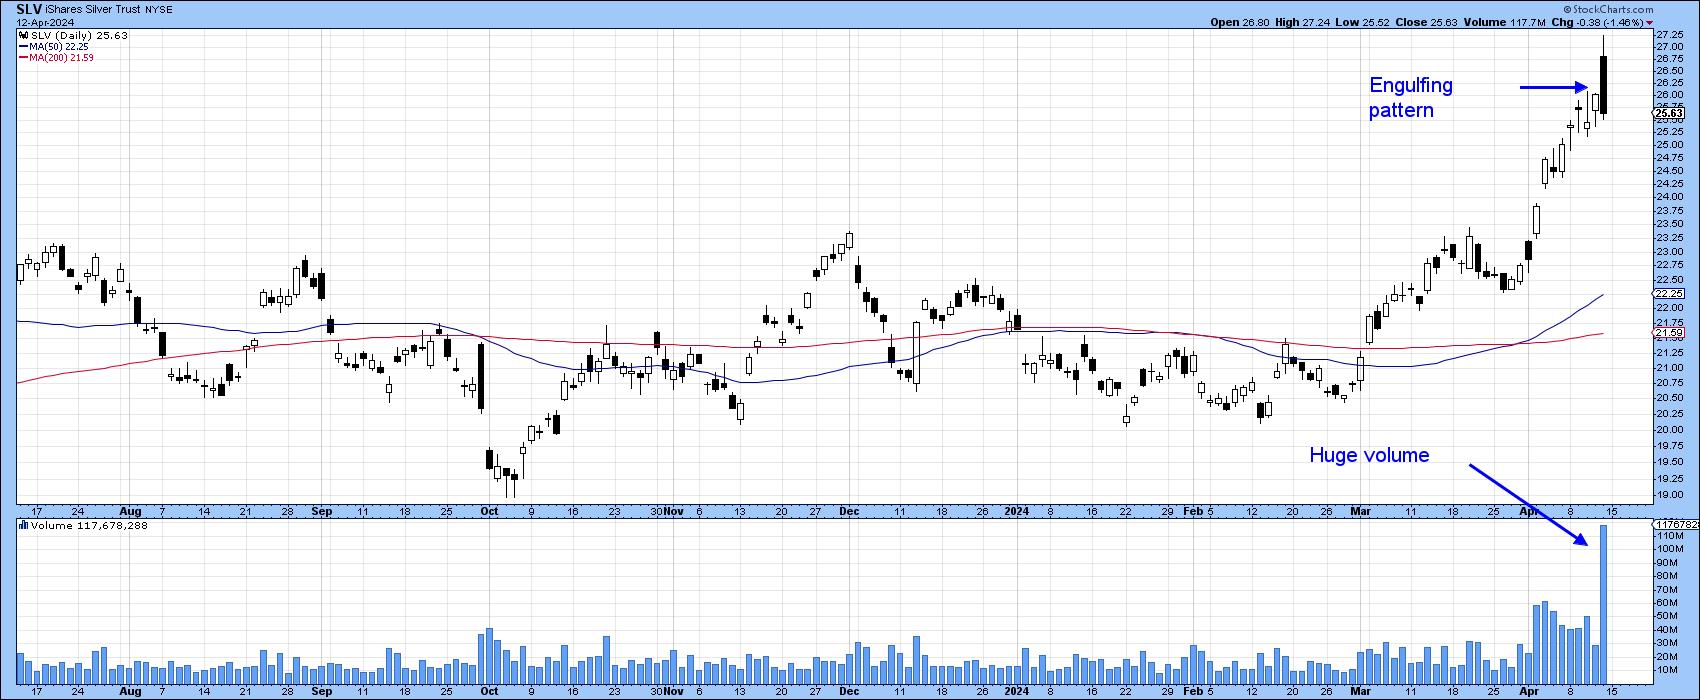
Silver, which has been playing catchup to gold, is also showing signs of exhaustion, in that Friday's extremely wide trading range completed an engulfing pattern. Here again, we see a very wide bar and humongous volume in a clear sign that sellers are now dominant.
A Note of Caution Against Being Too Bearish
Bearish one and two bar patterns and candlesticks, as described here, are only expected to have a negative effect for between 5-10 bars. That said, they often appear at critical turning points not due to their own power, but because they are the first domino in an otherwise vulnerable technical structure. There is no doubt that Friday's reversal phenomena are very significant from a short- or arguably intermediate-term aspect. However, positive longer-term indicators, combined with a recent breakout from large bases for both gold and silver, suggest that any weakness will run counter to the on-going uptrend.
Finally, one or two bar or candlestick formations do fail from time-to time. This most commonly occurs when their signals go against the direction of the prevailing main trend. That's also true for regular price patterns. At this point, most of the long-term indicators are bullish for precious metals. However, if Friday's intraday high is decisively bettered and prices hold there for a couple of sessions, these patterns will be cancelled. Normally, I would place low odds on such an outcome, given their strong characteristics. However, since unpredictable events in the Middle East, rather than the fundamentals, are currently driving prices, new highs cannot be ruled out. Nonetheless, in the absence of black swan events, prices look as if they want to head south for a while.
Good luck and good charting,
Martin J. Pring
The views expressed in this article are those of the author and do not necessarily reflect the position or opinion of Pring Turner Capital Groupof Walnut Creek or its affiliates.


