This Sector is Breaking Up and Down Simultaneously
This may seem like a contradiction, but it is possible for two different things to be true at the same time.
What I am referring to is the fact that the health care sector (XLV) recently broke out from a consolidation reverse head-and-shoulders pattern, as we can see from the weekly plot in Chart 1. It now looks as if some form of retracement is underway, because the short-term KST has gone bearish, and its more dominant intermediate counterpart has also started to turn. Bearing in mind support in the area of the extended breakout trendline and 65-week EMA is still intact, what we are seeing is a perfectly normal and acceptable correction. If that support is violated, the whole breakout scenario would have to be questioned. There is one major factor that could threaten it, but I'll get to that later.
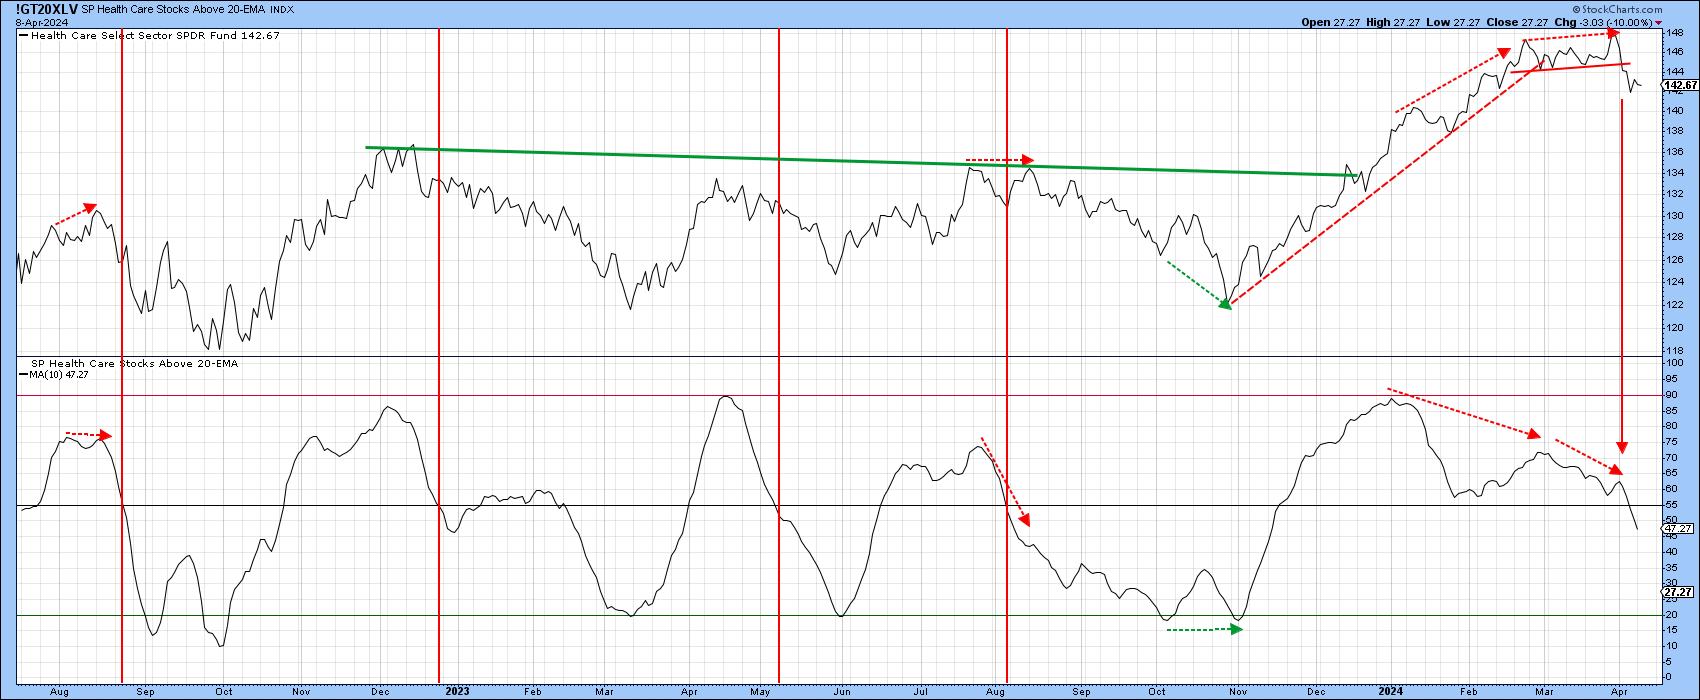
In the meantime, a couple of internal healthcare indicators suggest further near-term downside is likely.

Chart 2 shows an indicator that monitors XLV components trading above their 20-day EMAs. StockCharts provides a similar indicator for all the sectors and major indices, which I find to be very useful short-term indicators that augment price momentum. The vertical lines show that, when the indicator drops below the 55 level, a decline of some kind in the XLV typically follows. As is evident, this indicator recently experienced another negative zero crossover.
Occasionally, the indicator diverges with the price, as was the case for a negative divergence last August and a positive one in November. A far more egregious discrepancy recently formed between the start of the year and late March. This has been confirmed by a November/March up trendline violation and the completion of a small top. None of this suggests the potential for anything more significant than a short-term decline. Where, then, you may say, lies the problem?
Relative Action
The answer does not so much lie with the technical structure of the price, but more with its relative action. This is featured in Chart 3, where you can see the RS line has broken below a key support trendline and, therefore, severely diverged with the price. That's because the RS line peaked at the end of 2022, whereas the high for the price was set last week. The downside break is not cast in stone, as the RS line is not far from its green down trendline and could easily push back through it. Moreover, the daily KST does not appear to have much downside momentum going for it. However, as it stands right now, the evidence points to a breakdown in relative action.
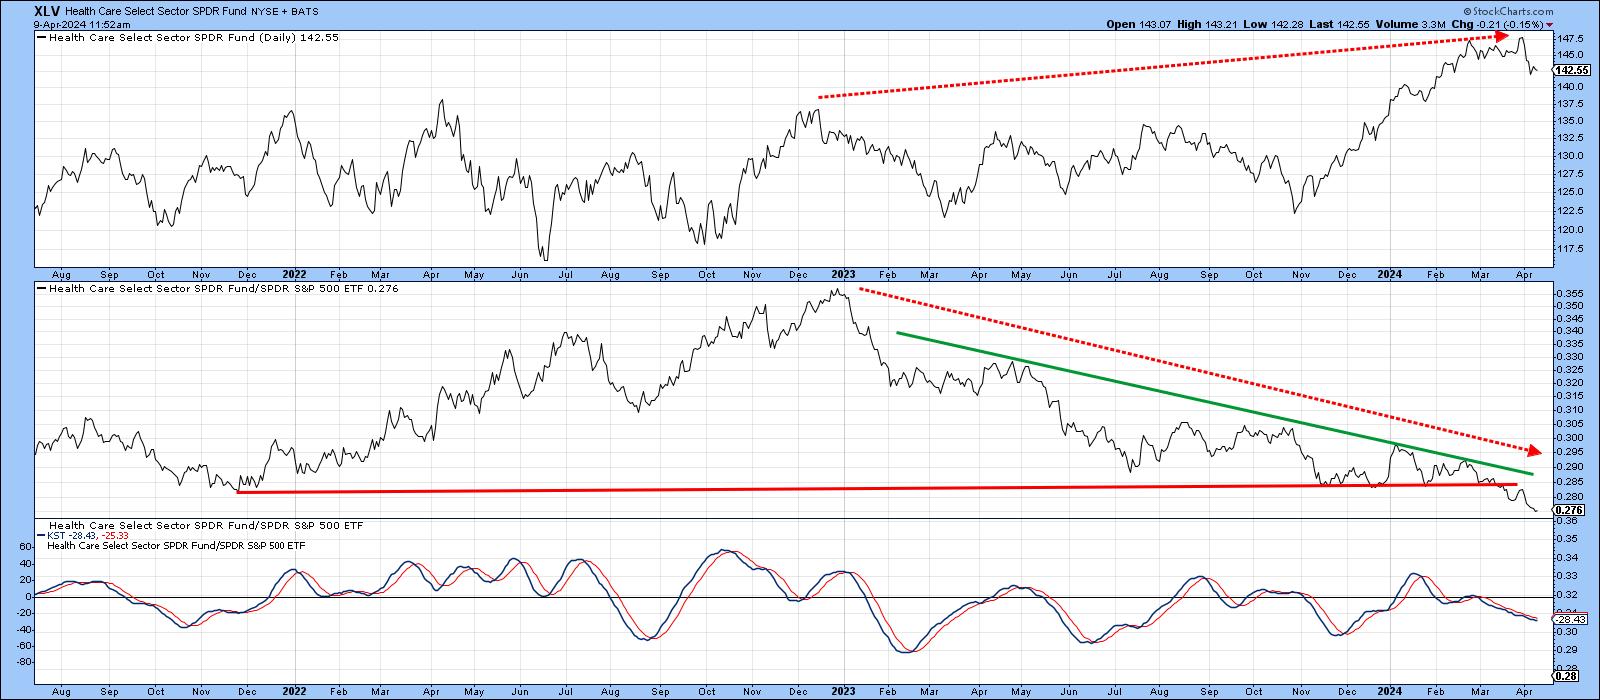
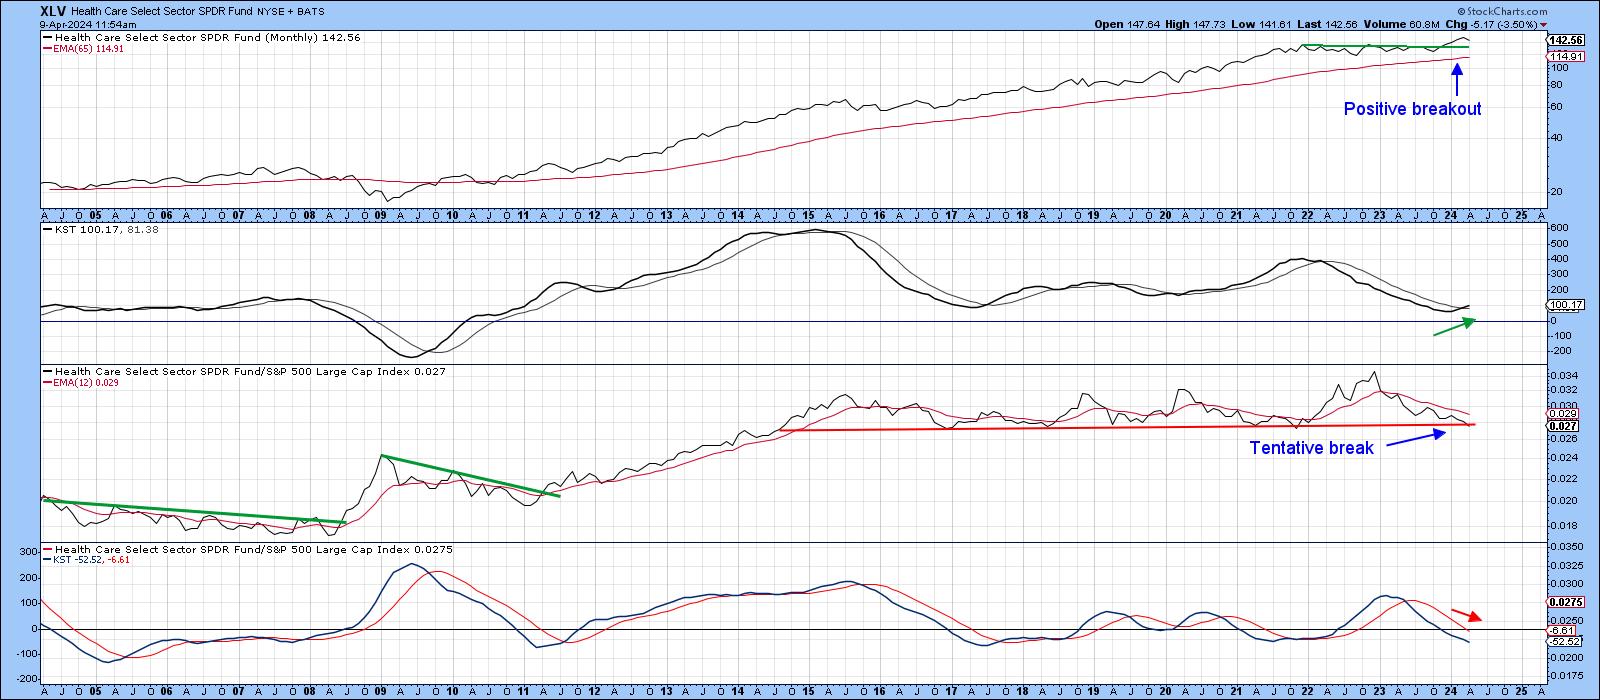
Chart 4 tells us this RS breakdown has the potential to be far more significant since monthly action has tentatively breached a 9-year support trendline. Adding to its relative woes is the long-term KST in the bottom window, which is in a negative mode.
It's important to note two things. First, the penetration is very marginal and could easily be reversed. Second, this chart plots monthly data and requires a monthly close in order to be an official data point. This means any break prior to that is really just an "estimate". Countering that argument is the fact that a decisive violation has already taken place in Chart 3 featuring daily data.
Conclusion
Once the current short-term correction is over, the long-term indicators are suggesting that healthcare will go on to register new highs. Whether the XLV will outperform the market in the process is an open question. However, given the evidence we have right now, it seems unlikely.
Brokers are Breaking Out
The technical picture for brokers is similar to healthcare in that both have broken to the upside. However, in the case of the iShares Broker Dealer ETF (IAI) the relative action is more constructive, in that the RS line has bounced from its extended 2008-2021 breakout trendline. Furthermore, the long-term KST for relative action has just turned bullish.
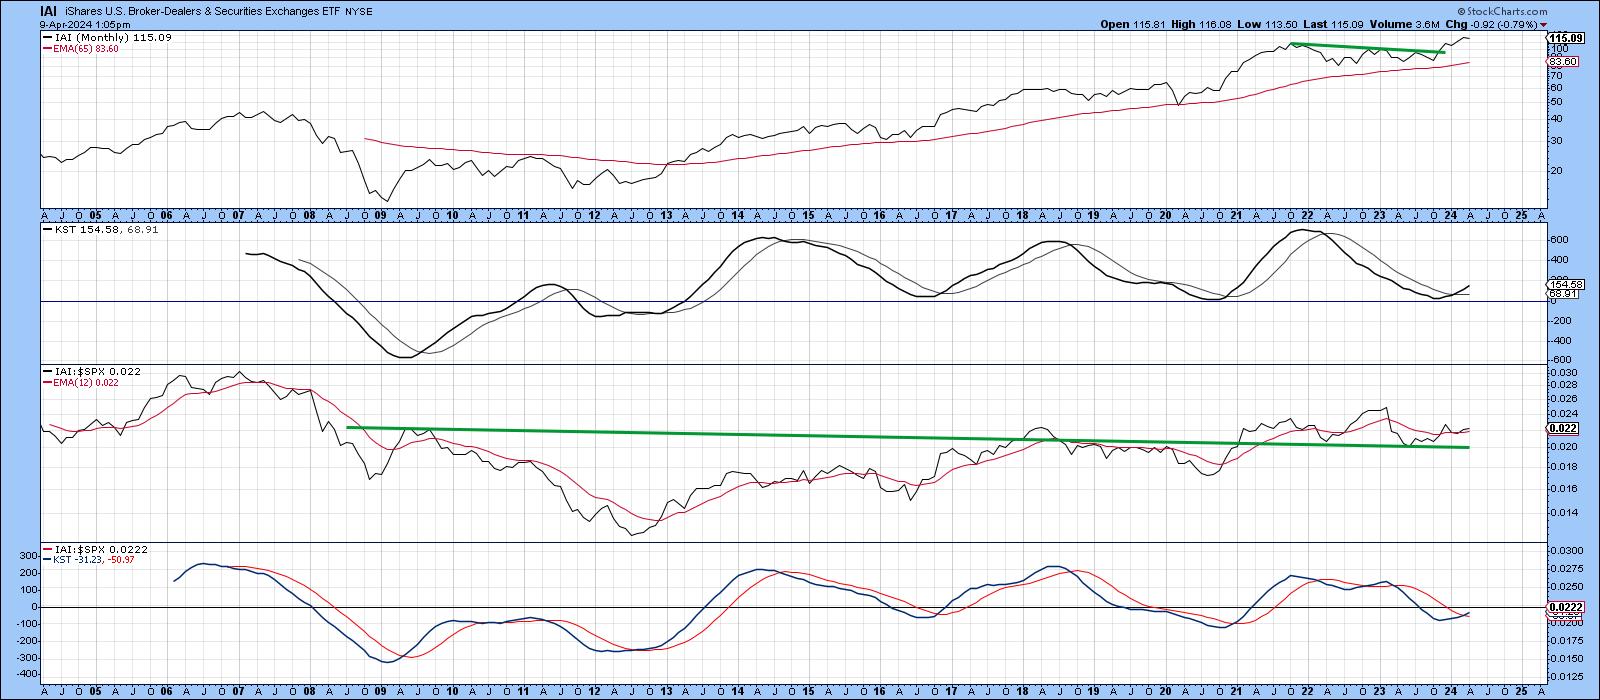
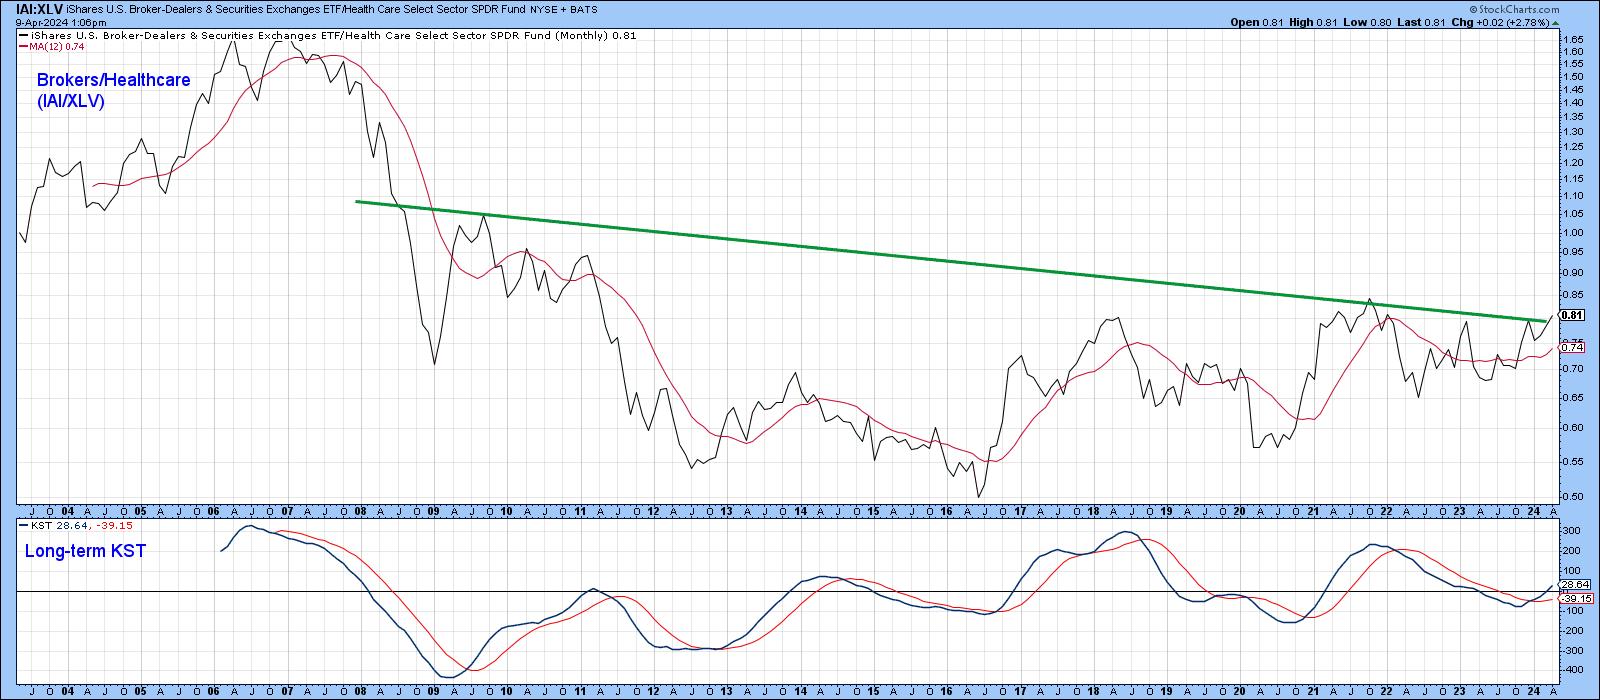
What is intriguing is the ratio between the IAI and the XLV, which is right at a 16-year resistance trendline. The positive KST hints at an upside breakout favoring brokers. If so, it would represent be a significant long-term signal of superior broker performance over healthcare.
Good luck and good charting,
Martin J. Pring
The views expressed in this article are those of the author and do not necessarily reflect the position or opinion of Pring Turner Capital Group of Walnut Creek or its affiliates.


