Four Reasons Why Emerging Markets are Headed Higher
Last February, I wrote an article on emerging markets, using the iShares MSCI Emerging Markets ETF (EEM) as my benchmark. I pointed out that this sector was close, but had not quite broken out to the upside. Now it has, and the outlook is favorable for at least a 4-6-month time horizon.
Chart 1 sets the scene for the EEM, as the price cleared its bear market trendline and 65-day EMA late last year. In the last couple of weeks, it has broken above the horizontal dashed trendline, marking the top of a 2-year base. The extended line should now act as support for any retracement move that might take place. That seems unlikely, as all three KST time frames are in a bullish mode. The blue arrows tell us the minimum ultimate upside objective from the base is for a weekly closing price of around $52. That's not far from the 2021 bull market high of $54.

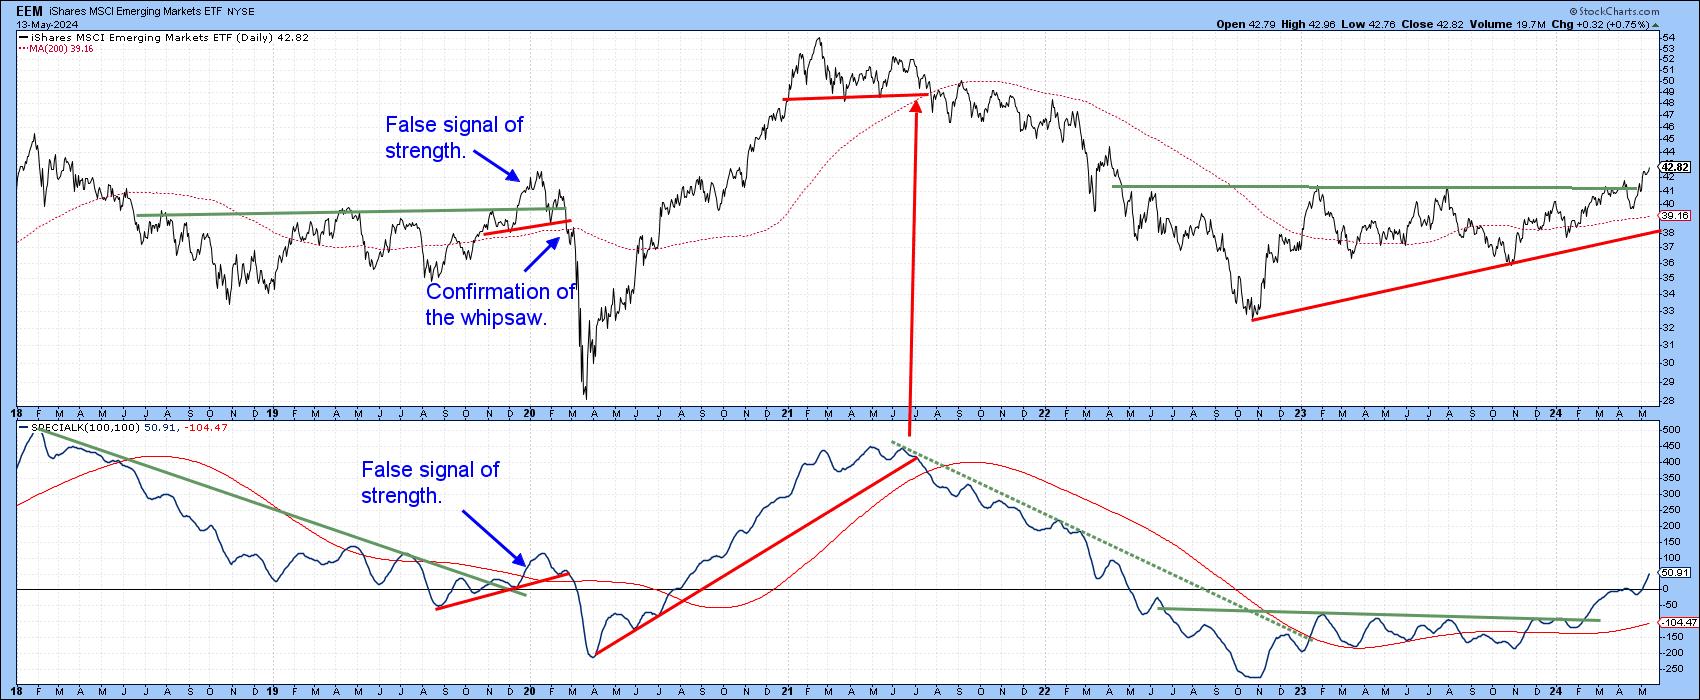
Chart 2 features the Special K (SPK), which you can read about here.This indicator, which summates short-, intermediate- and long-term momentum into one series, tends to peak and trough with bull and bear market turning points in the price itself. The trick is to identify when the SPK has reversed, hence the incorporation of trendlines and the red signal line into the analysis.
This momentum indicator recently broke out from a base and has started to trace out a series of rising short-term peaks and troughs. It is also well above the signal line, thereby offering a strong signal that the price breakout is genuine. There are four other factors supporting this view.
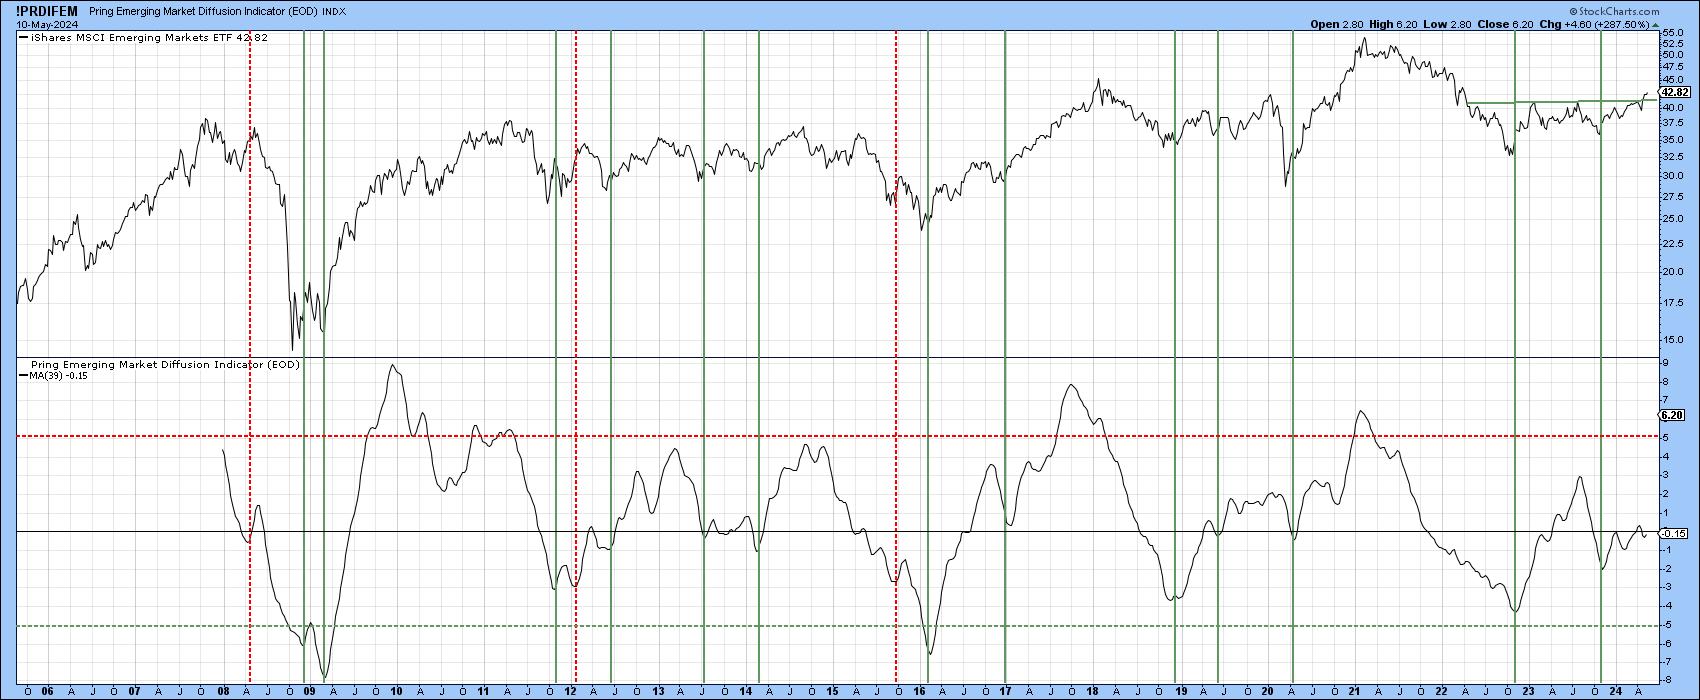
1. The Breakout is Broadening
Chart 3 features a 39-week MA of my emerging market diffusion indicator. The vertical lines show when this oscillator decisively reverses to the upside from a subzero position. It has been zig-zagging higher since its most recent December 2023 reversal and remains in a rising mode. One of the things I like is that it is not overextended in any way, which indicates a higher probability of a valid breakout than if it were currently overstretched.
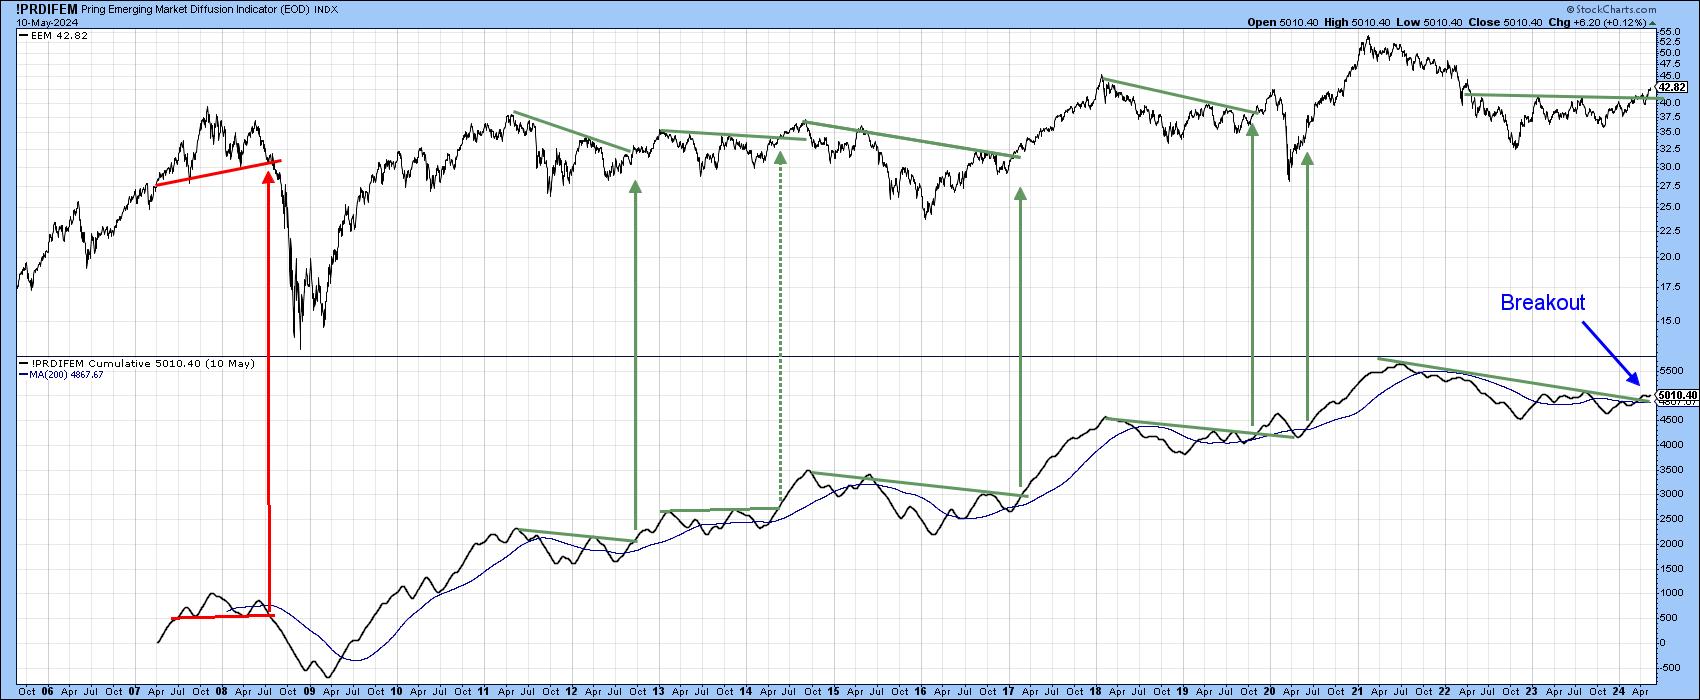
That same data can be used in a cumulative format, which we see in Chart 4. In this instance, the indicator has just broken above its bear market trendline and 200-day MA. Previous trendline/arrow combinations were followed by a rally or reaction by the price, depending on the direction of the breakout. The latest trendline violations clearly support the idea of a rally, possibly testing the 2021 high.
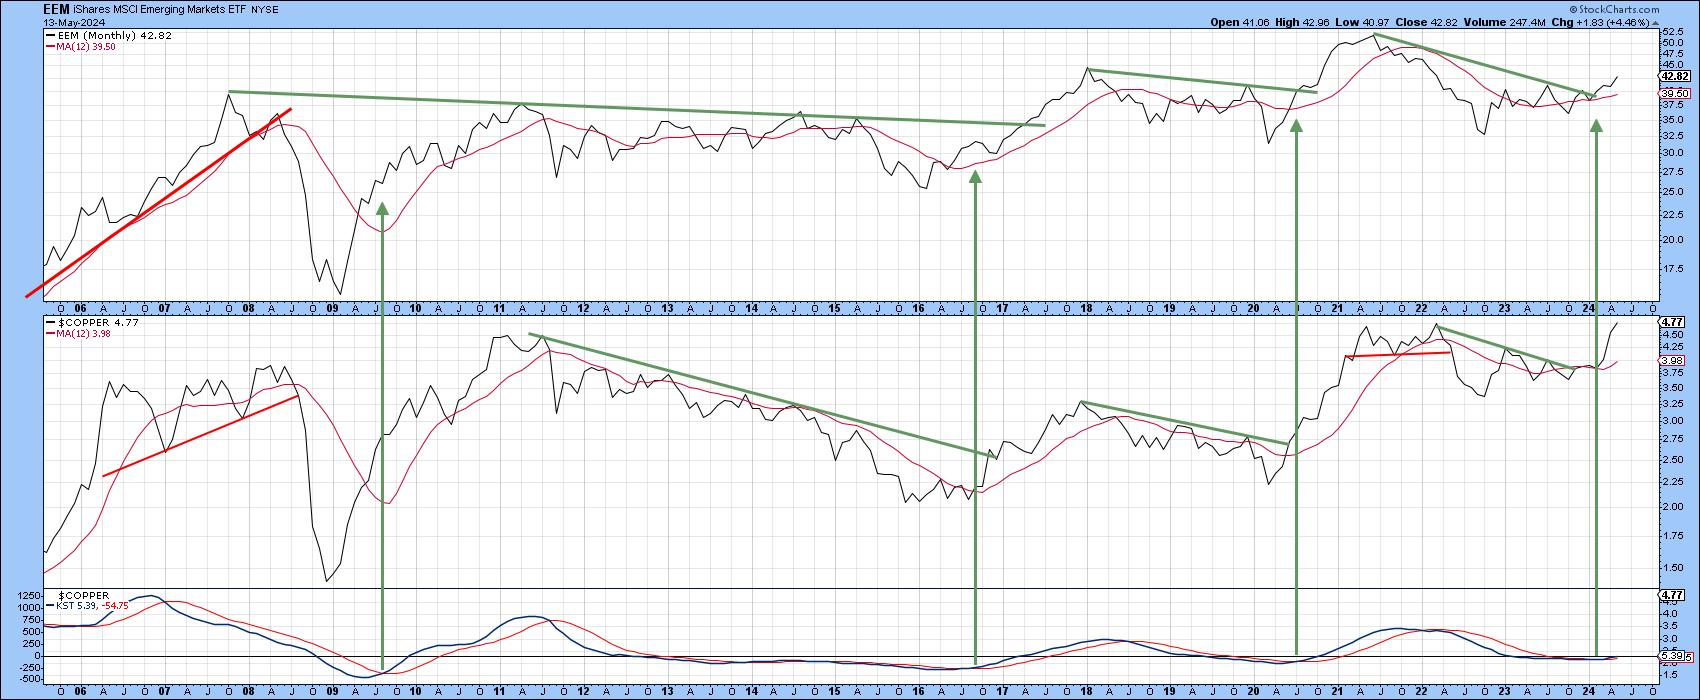
2. Emerging Markets are Correlated with the Copper Price, and That's Bullish
Not all emerging markets are resource-sensitive, but Chart 4 shows a strong connection between the copper price and the EEM. The arrows point up instances where the KST for copper has reversed direction and crossed above its 9-month MA. There have been three such examples since 2009; each has been followed by higher EEM prices. The last two examples were accompanied by a positive trendline break in both the EEM and copper price, thereby adding further strength to the KST signals. That same combination has repeated in 2024, which is another reason for suspecting the EEM rally will extend.
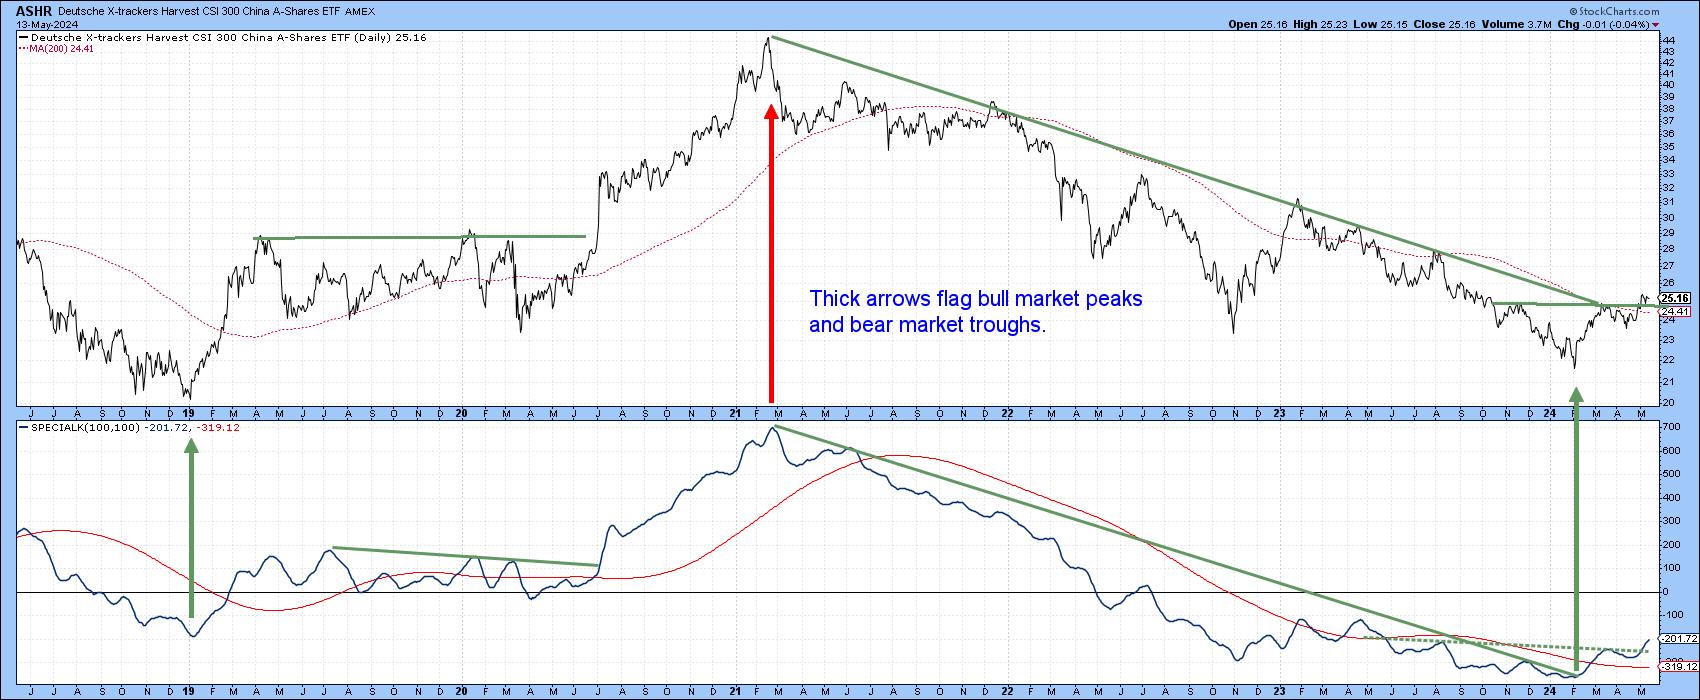
3. China Enters a Bull Market
It's worth noting that Chinese equities make up an approximate 20% weighting in the EEM, and have acted as a drag on the Index in the last few years. Chart 6 shows that the Deutsche X-trackers China A Shares ETF (ASHR) has violated its bear market down trendline and completed a small base. The SPK has also cleared its signal line and completed a small base. The thick arrows identify the primary trend turning points of the last few years and show how they normally line up with major SPK turning points. All of this should mean that China will no longer hold the EEM back, but reverse that role by helping power it to greater heights.
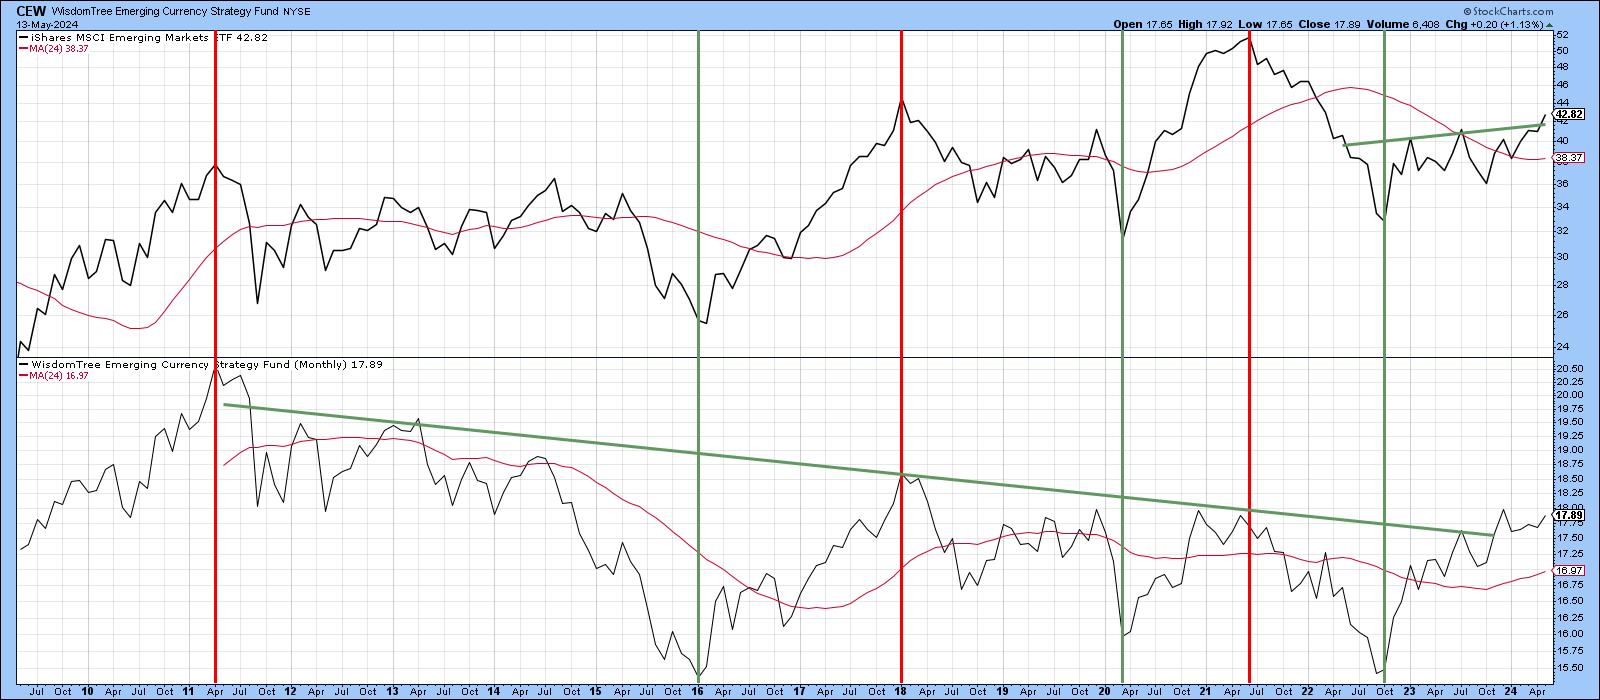
4. Emerging Market Currencies are Firming
The vertical lines in Chart 7 show that the important turning points for the EEM since 2010 have also been associated with those for the WisdomTree Emerging Currency Fund (CEW). A rising currency is clearly associated with a firmer EEM. Since the recent violation of the 2011-2023 down trendline for the CEW is a very positive factor for its components, this is also likely to spill over to a stronger price for the EEM.
Good luck and good charting,
Martin J. Pring
The views expressed in this article are those of the author and do not necessarily reflect the position or opinion of Pring Turner Capital Groupof Walnut Creek or its affiliates.


