Time for a Pause in the Ongoing Dollar Bull Market? Or Full Steam Ahead?
I last wrote about the dollar in December, where I came to the conclusion that a limited rally was a likely possibility in what was assumed to be a primary bull market. I am still of the view that the bull market is alive and well, but it's possible a limited decline may be in the cards. In the long run, though, it will not matter, because the technical position calls for a far higher dollar. Let's begin with the big picture and work our way down.
Secular and Primary Trend Are Bullish
Chart 1 features a quarterly chart of the Dollar Index compared to its Coppock Curve. The green shading tells us when the oscillator is above its 16-quarter average. This is by no means a perfect indicator, but, most of the time, it gives us an objective feel as to when the Index is in a bull or bear trend. The green shadings capture most of the really big moves on the upside, the bearish white areas accomplishing the same feat on the downside.
In 2022, the Index violated the two secular down trendlines and triggered a positive MA crossover for the oscillator, thereby signaling a secular, or very long-term, bull market.

Chart 2 is focused on the primary trend. The shadings tell us when its 6-month is above its 15-month EMA or more simply put, when the PPO is above zero. The upward-pointing blue arrows indicate that the equilibrium level often turns back attempts at its violation. That has happened twice in the last year, as the "bull" market has morphed into a trading range.
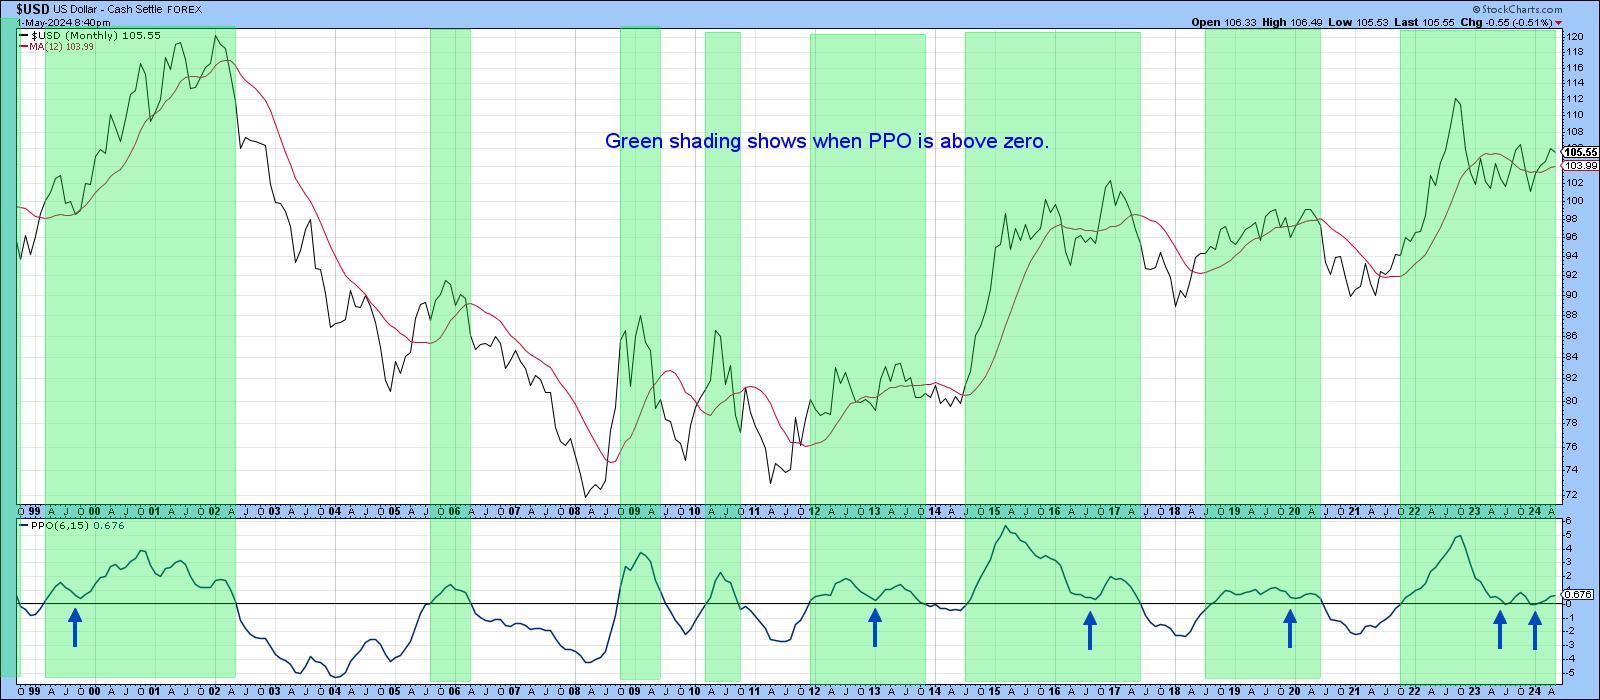
The Short- and Intermediate-Term Picture
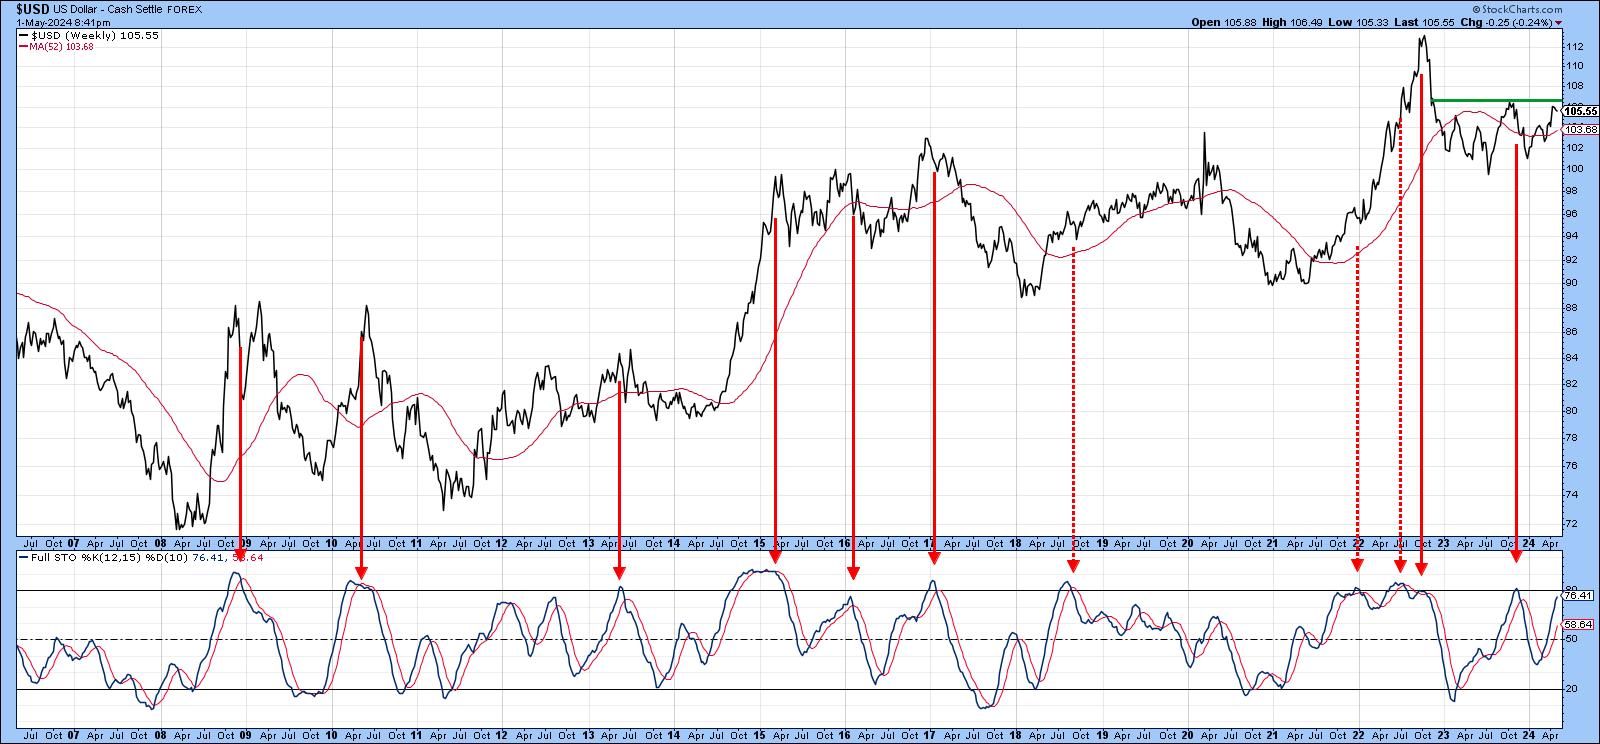
Now the Index is at resistance at the top of that range, and Chart 3 shows that the weekly stochastic is at an overbought reading, The red arrows demonstrate that a reversal from such levels, which has not yet happened, is typically followed by a dollar decline. Consequently, this combination of an overbought market running into resistance could be followed by weakness.
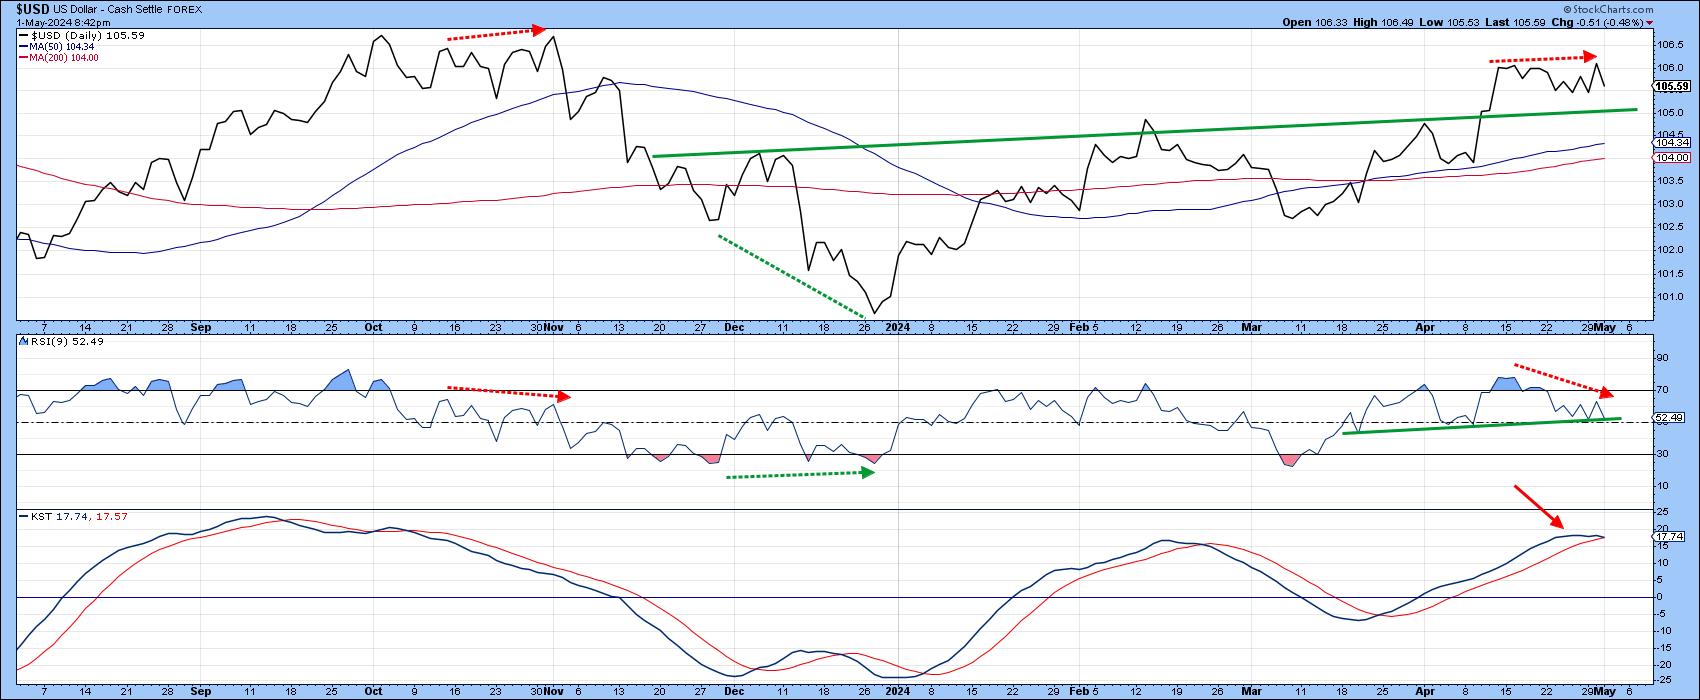
The stochastic may not have reversed to the downside, but Chart 4 suggests vulnerability. That's because the RSI has diverged negatively with the price and the daily KST is about to trigger a sell signal. Like any other technical phenomenon, these momentum discrepancies need to be confirmed by the price. In this instance, I would look for a break below 105, since that is where the extended breakout trendline is currently residing.
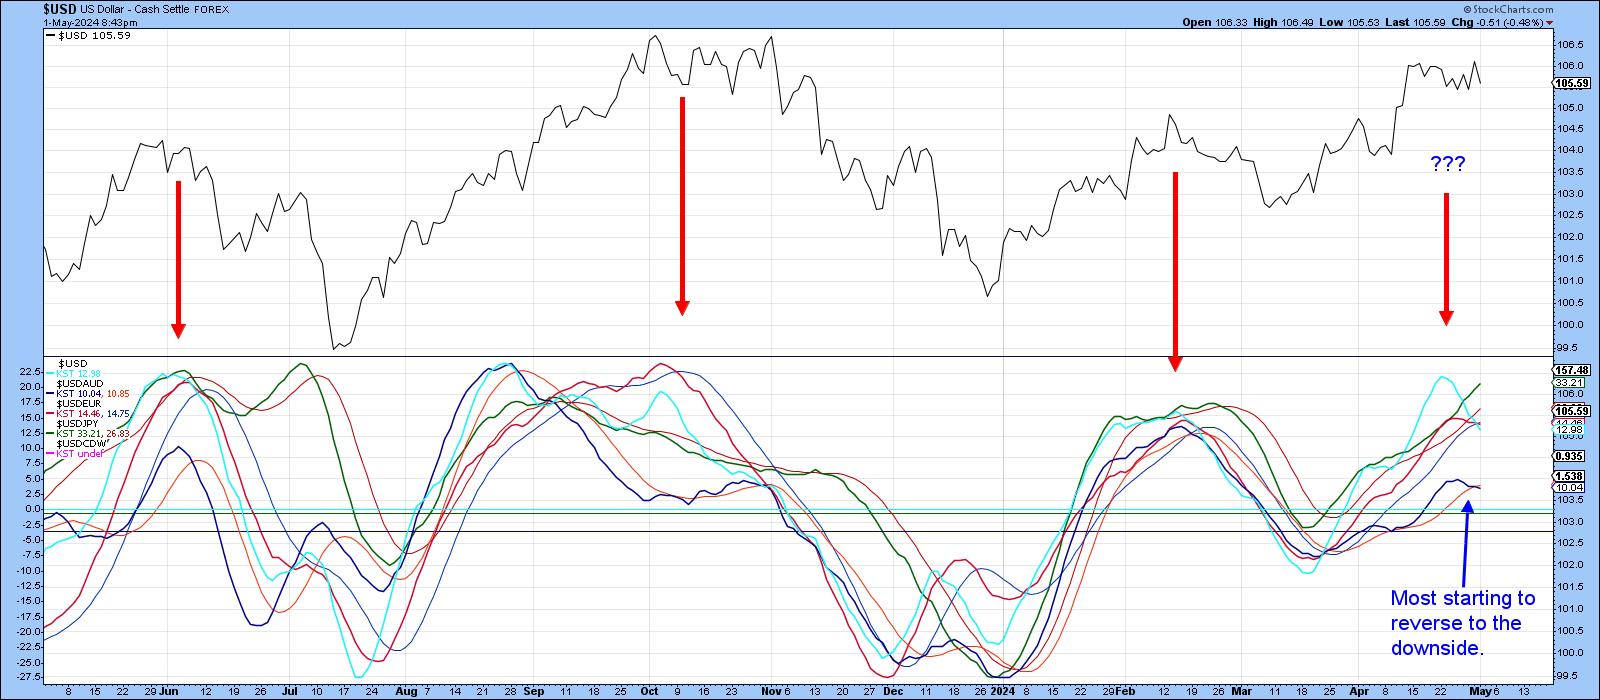
Finally, on the short-term trend, Chart 5 compares the short-term KST for the Dollar Index (in cyan) to several other cross rates. The red arrows approximate those times when momentum for the Index itself is peaking alongside the majority of cross rates. It looks as if four of them are currently in the process of turning, which again hints at the potential for a short-term correction.
Why the Bull Market is the Thing to Focus On
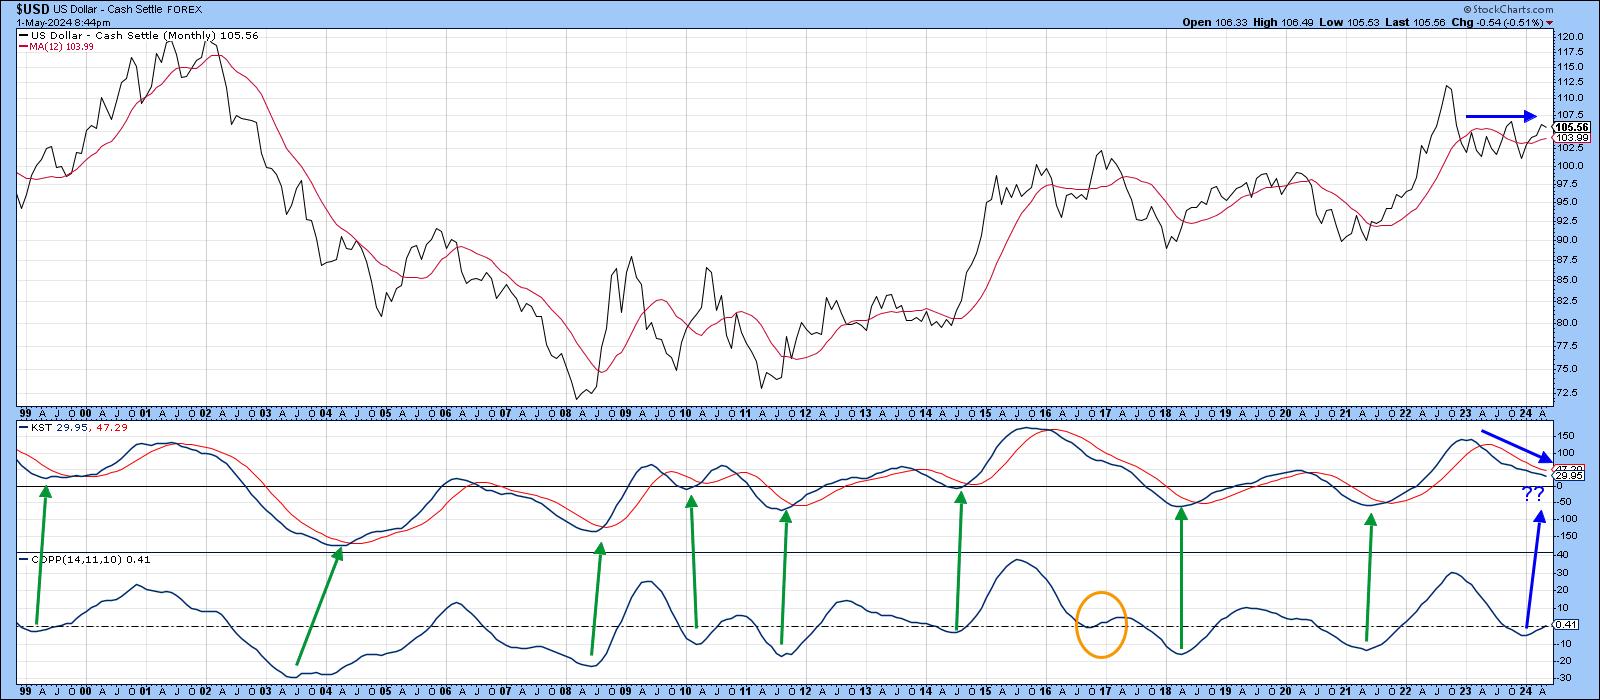
Chart 6 tells us that the long-term KST has been dropping since its peak in early 2023. This has been one of the headwinds affecting the Index, resulting in a trading range rather than a robust advance. It's still in a gently declining phase, but you can also see that the Coppock indicator, in the bottom window, has already turned up. That's important, since the green arrows demonstrate that the Coppock normally leads or coincides with the KST. Its recent upward reversal is therefore a vote for a forthcoming KST rally.
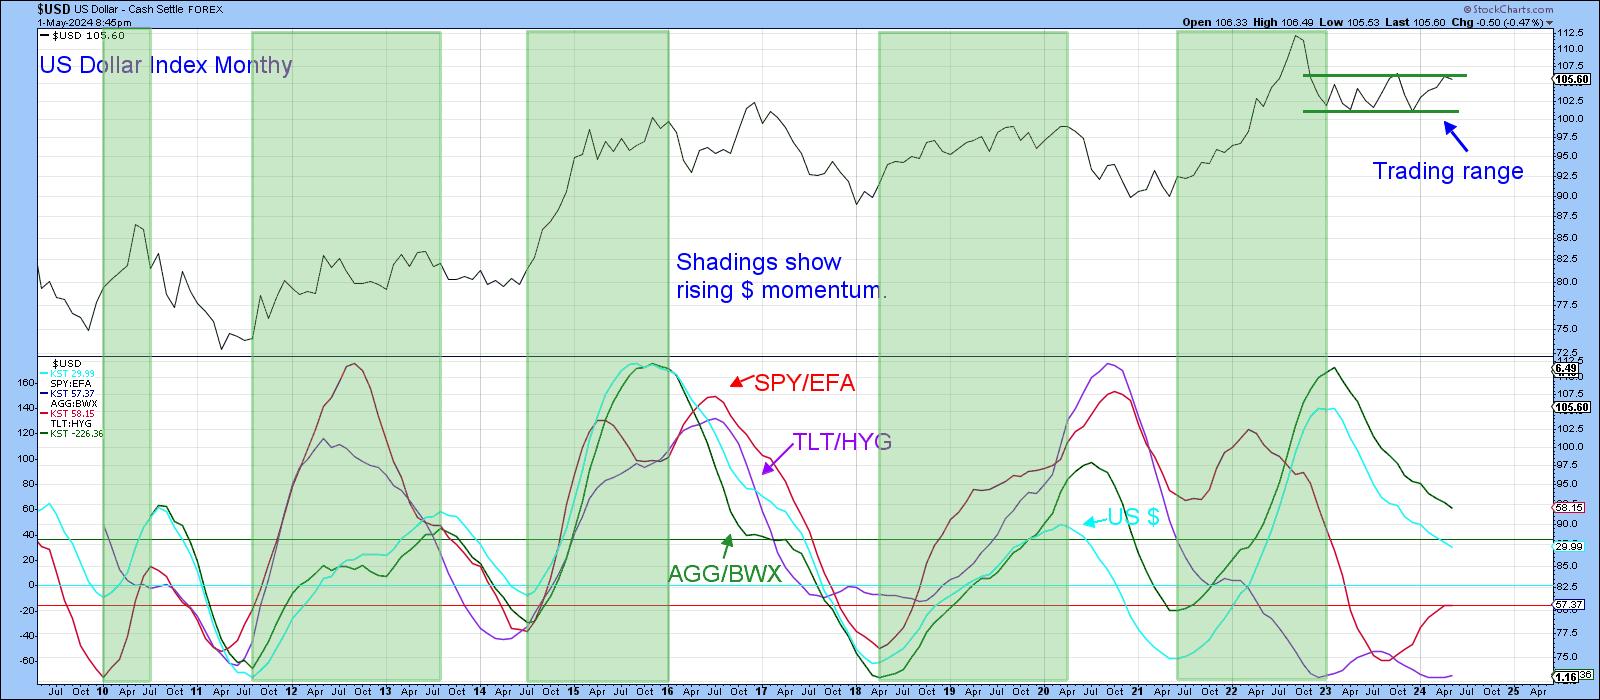
Finally, Chart 7 features the long-term KST for several ratios that tend to move with the dollar. I call these "Dollar Sympathy Relationships" and like to see as many of these momentum series move in a similar direction as possible. Bearing in mind the Dollar Index itself is displayed in cyan, the other relationships are 1) the SPY against the Europe Australia Far East ETF, 2) government vs. high yield bonds, and 3) US bonds against the rest of the world.
I show the chart for two reasons. First, when the dollar KST is rising or falling, stronger trends tend to emerge when it is accompanied by all series moving in tandem. Second, two oscillators have already reversed. The other two have corrected to the point where an upside reversal could easily take place. Note that most of them were declining as the trading range was being formed. Consequently, an upside reversal by the Index itself and the US/World bond spread (AGG/BWX) may well usher in a more robust phase for the bull market, as the Index breaks out from its 2023-24 trading range.
Good luck and good charting,
Martin J. Pring
The views expressed in this article are those of the author and do not necessarily reflect the position or opinion of Pring Turner Capital Groupof Walnut Creek or its affiliates.


