Dow Transports Are Set for a Short-Term Rally, But Will It Be Enough?
The Transportation Sector has been one of the weaker brethren of late. That's important, as this market average forms part of the Dow Theory, which many observers believe is currently signaling a bear market. However, back in January, I wrote a piece on the Dow Theorythat came to a more upbeat conclusion.
Under Dow Theory, a bull market is signaled when both series trace out a series of rising intermediate peaks and troughs. That uptrend remains in force until both the averages reverse these conditions. One of the problems with the theory is that its interpretation is highly subjective; one analyst's intermediate advance might be another's short-term rally.
Chart 1 presents the averages in a more objective way, using Stock Chart's ZigZagtool, a technical tool which automatically filters out price moves of a specific percentage. In this instance, I have chosen a 7.5% setting as an attempt to approximate intermediate price moves. The intermediate moves have been labeled sequentially from the October 2022 bear market bottom. Note that the Transports at 7 failed to take out the previous high at 5, thereby setting up a Dow Theory non-confirmation, but not a sell signal.

My conclusion in January stated, "In order to generate a sell signal, it would be necessary for the current Transport rally to fail at some point below its August 2021 peak (5), followed by a subsequent drop below its October bottom." I also concluded that "no corresponding intermediate turning point for the Industrials is apparent, since the Index is at an all-time high." Those conclusions remain unchanged, as the Industrials reached a record reading in May and the Transports never violated last October's low.
What Do the Transports Look Like Technically?
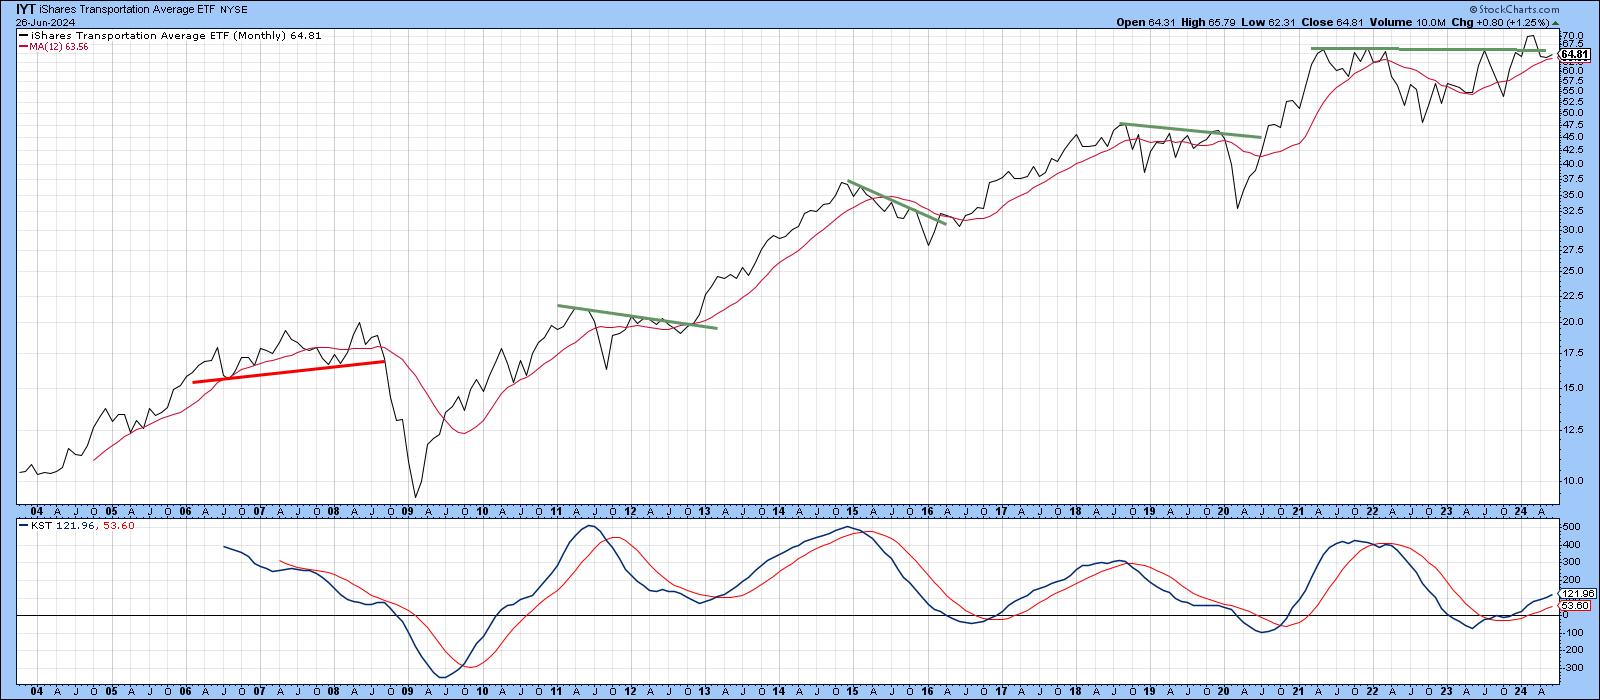
Chart 2 supports the idea that the primary bull market is intact, as the KST and Index are both above their respective moving averages. The Index has also broken out from a multi-year consolidation, and has recently experienced a normal retracement move back to the extended trendline marking the breakout point. It has clearly reached crucial support, which is reflected in the combined form of the MA and extended trendline.
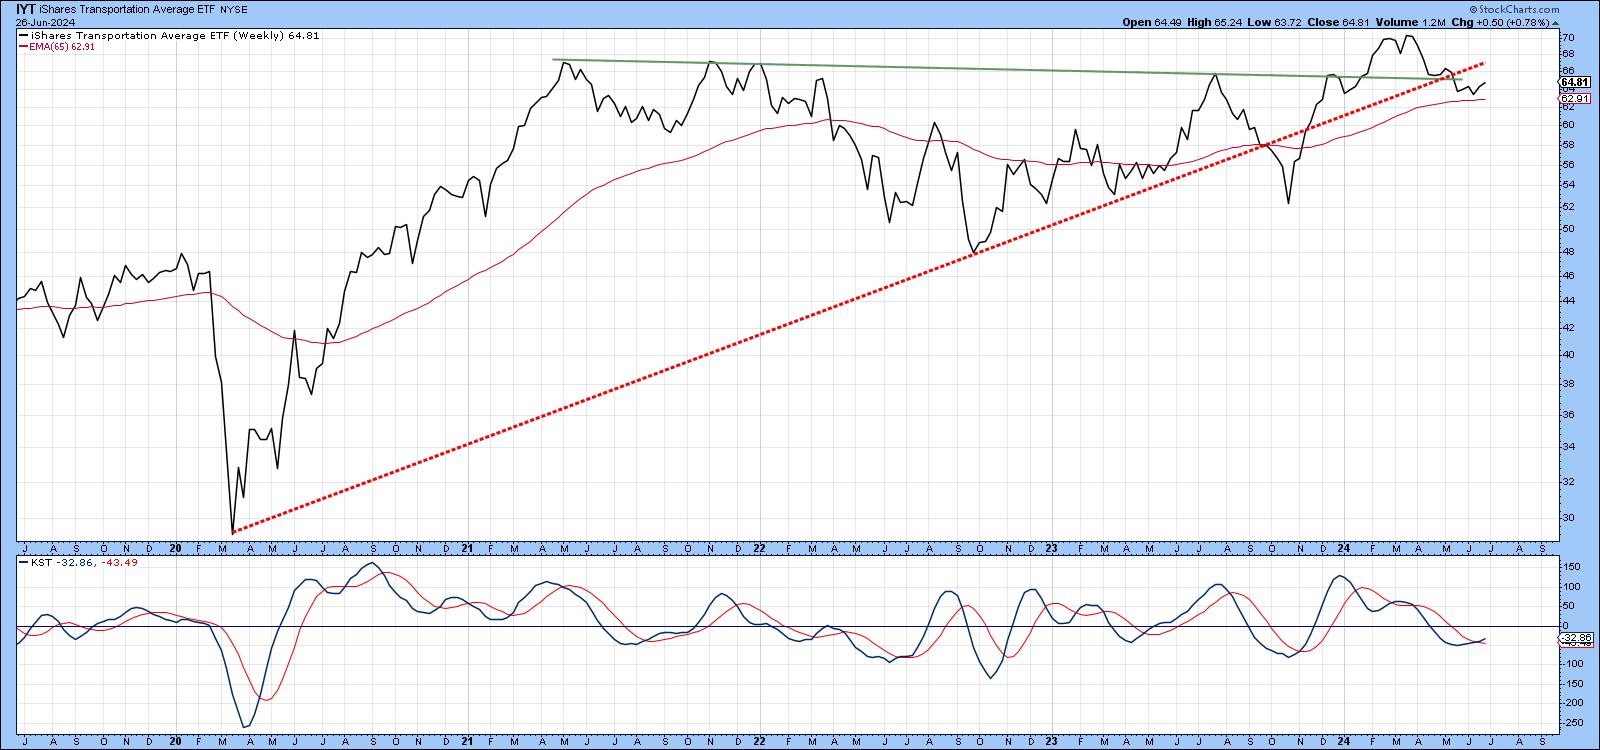
That support is exemplified by weekly data displayed in Chart 3, where we can see that the 65-week EMA remains intact. The problem is that this chart tells us the Index has fallen below both its post-2020 up trendline and the extended breakout trendline. That said, the short-term KST has just gone bullish, so it's possible the indicated rally could enable the Index to surpass the two extended trendlines again.
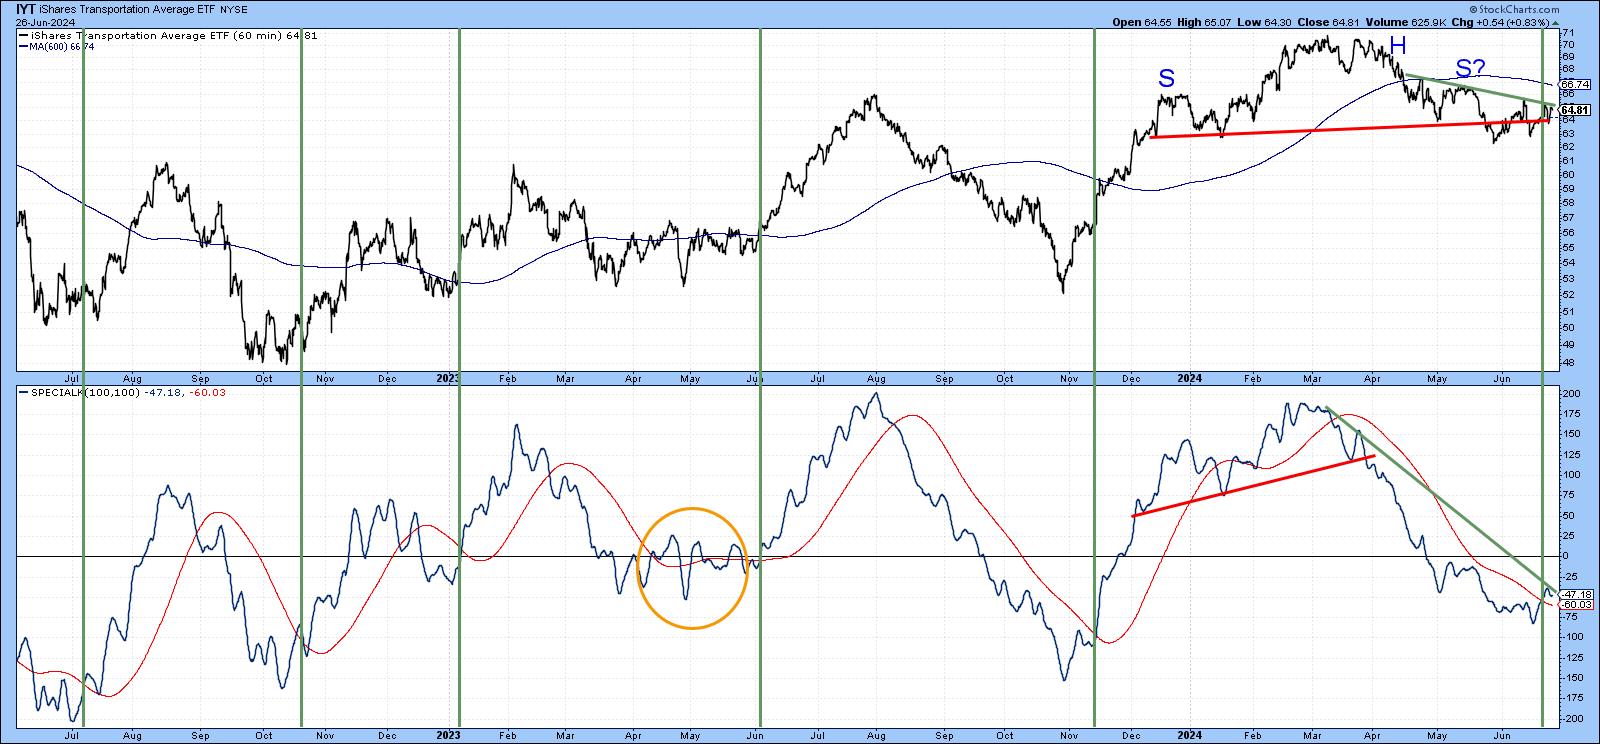
That's the kind of message being transmitted by the Special K in Chart 4. This is an hourly chart, and is therefore useful from the point of view of assessing intermediate trends. The vertical green lines tell us when this oscillator crosses above the red signal line a rally typically follows. The orange ellipse is there to remind us that this is not a perfect approach. We can also see the Index has crossed through the extended head-and-shoulders neckline several times, thereby reflecting a tight balance between buyers and sellers. The fact that the signal line has gone positive, but the Special K remains below its trendline, underscores this point.
Charts 5 and 6 are already pointing to a higher Index. The first features the number of transportation stocks above their 20-day EMA. This series is not only rising, but the two dashed green arrows draw our attention to a positive divergence with the Index.
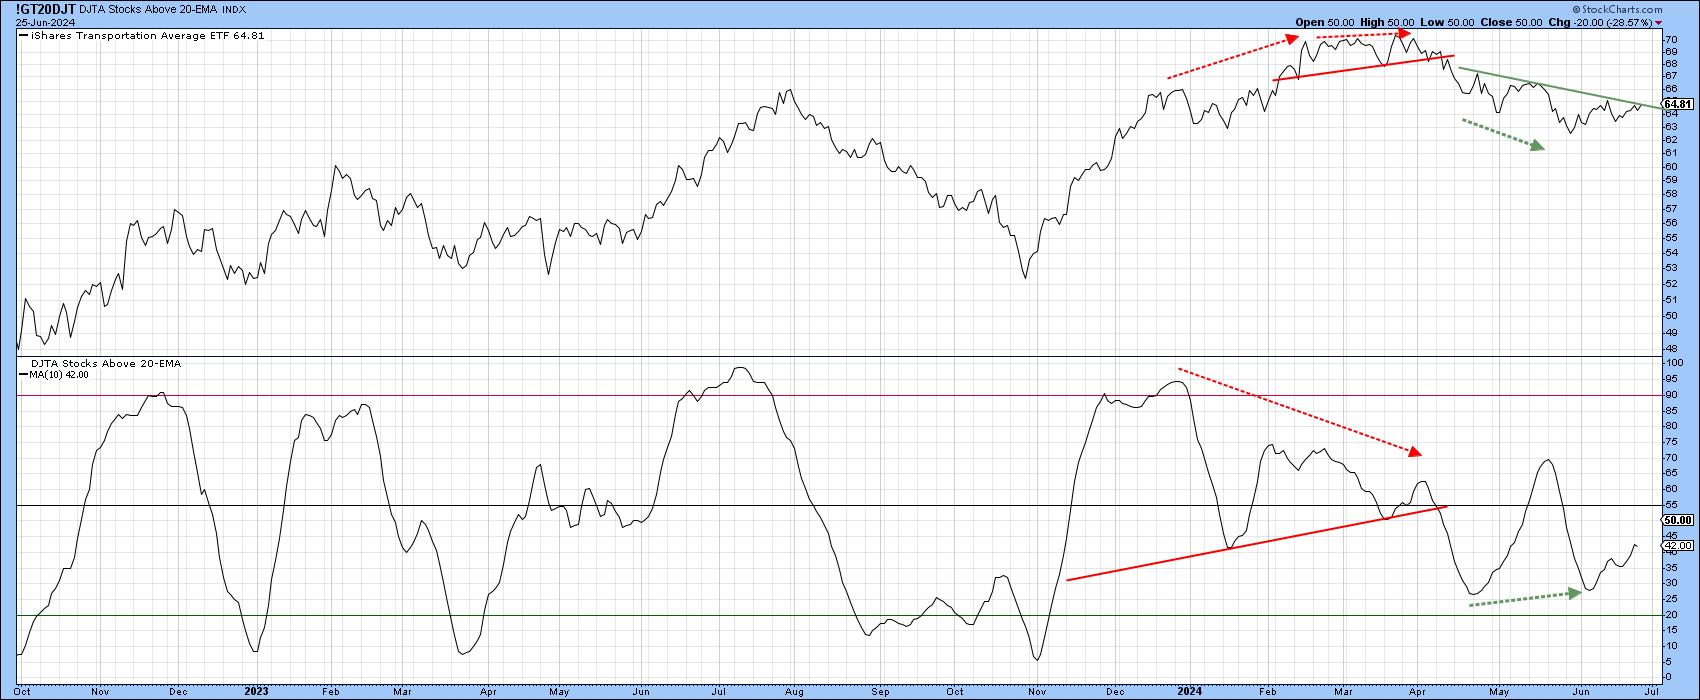
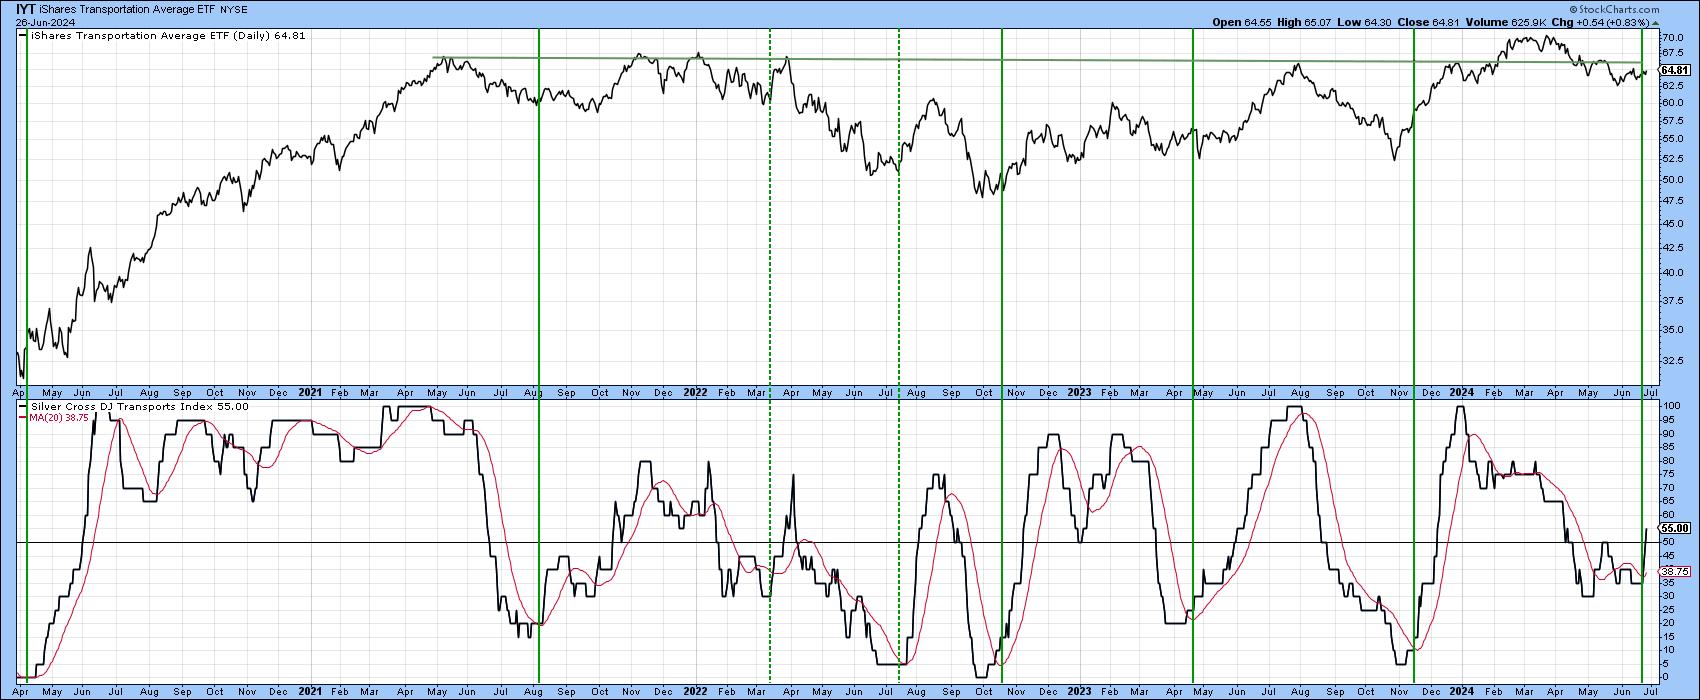
Chart 6, on the other hand, monitors the number of transportation stocks experiencing a positive silver cross. In this instance, the vertical green lines demonstrate when the oscillator crosses decisively above its red 20-day MA from a sub-50 level. Most of the time, the Transportation Index rallies, but the dashed vertical lines show that this is not always the case. This week, the indicator crossed above its MA once again, thereby offering a firm undertone to the short-term technical position.
If the Transports Rally, Can They Keep Up with the Market?
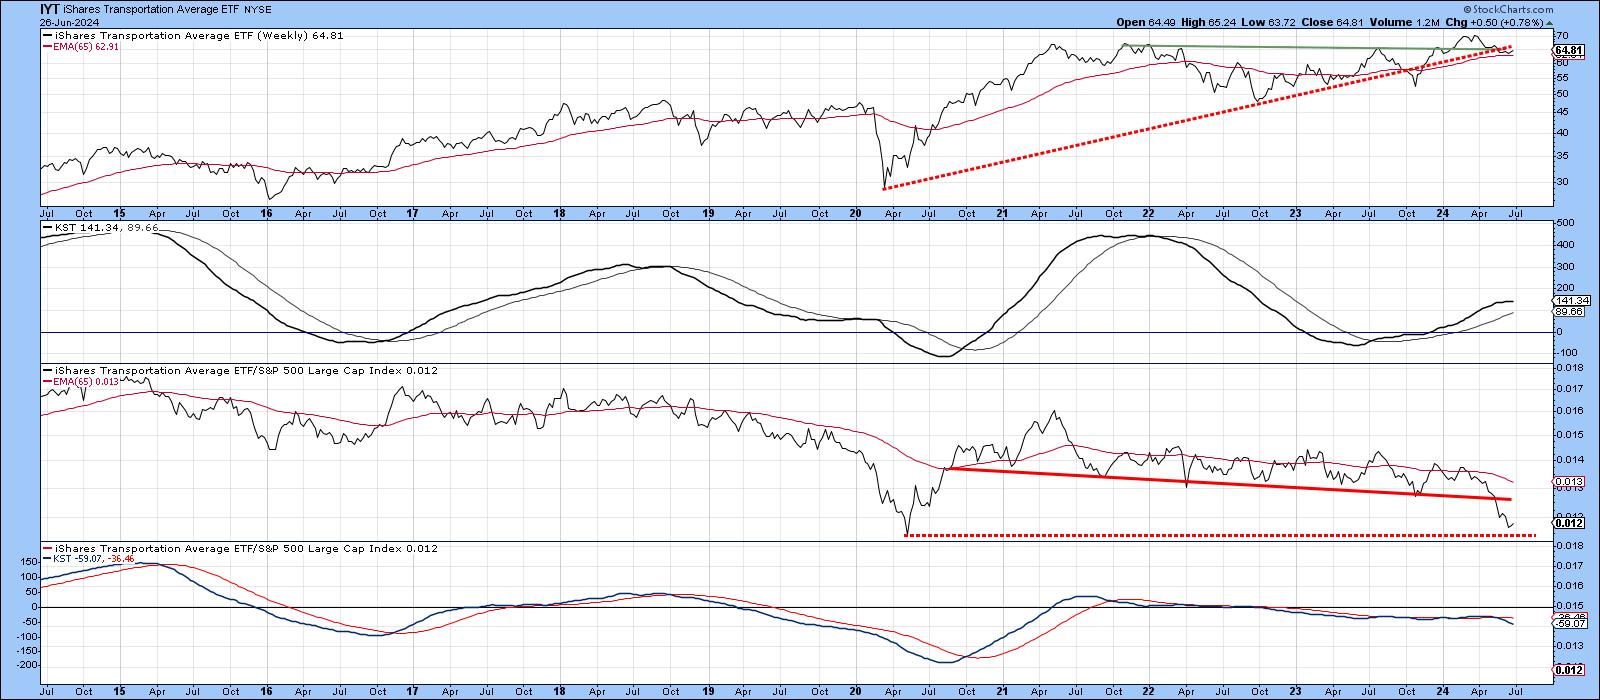
The third window in Chart 7 demonstrates that the RS line for the Transports recently broke down from a 4-year trading range. This move was also supported by the long-term KST for relative action in the bottom window. The RS line is clearly overstretched and well due for a bounce over the near-term. Further out, though, this sector will face a steeper uphill climb, and likely have difficulty outperforming the S&P Composite, regardless of whether Dow Theory is bullish or bearish.
Good luck and good charting,
Martin J. Pring
The views expressed in this article are those of the author and do not necessarily reflect the position or opinion of Pring Turner Capital Groupof Walnut Creek or its affiliates.


