Has Housing Topped Out for the Cycle?
Residential housing is not important for its size relative to GDP, which, according to Copilot, is about 3-5%. Rather, due to its interest rate sensitivity, housing is significant because it is the first sector of the economy to turn at the end of a recession, and the first to turn down following a recovery. Housing equities also have leading tendencies from a sector rotation aspect.
The problem for housing starts, from a forecasting point of view, is that the period between their peak and the beginning of a recession is quite variable and often extremely long. Consequently, it is not particularly helpful for pinpointing when a recession is likely to get underway.
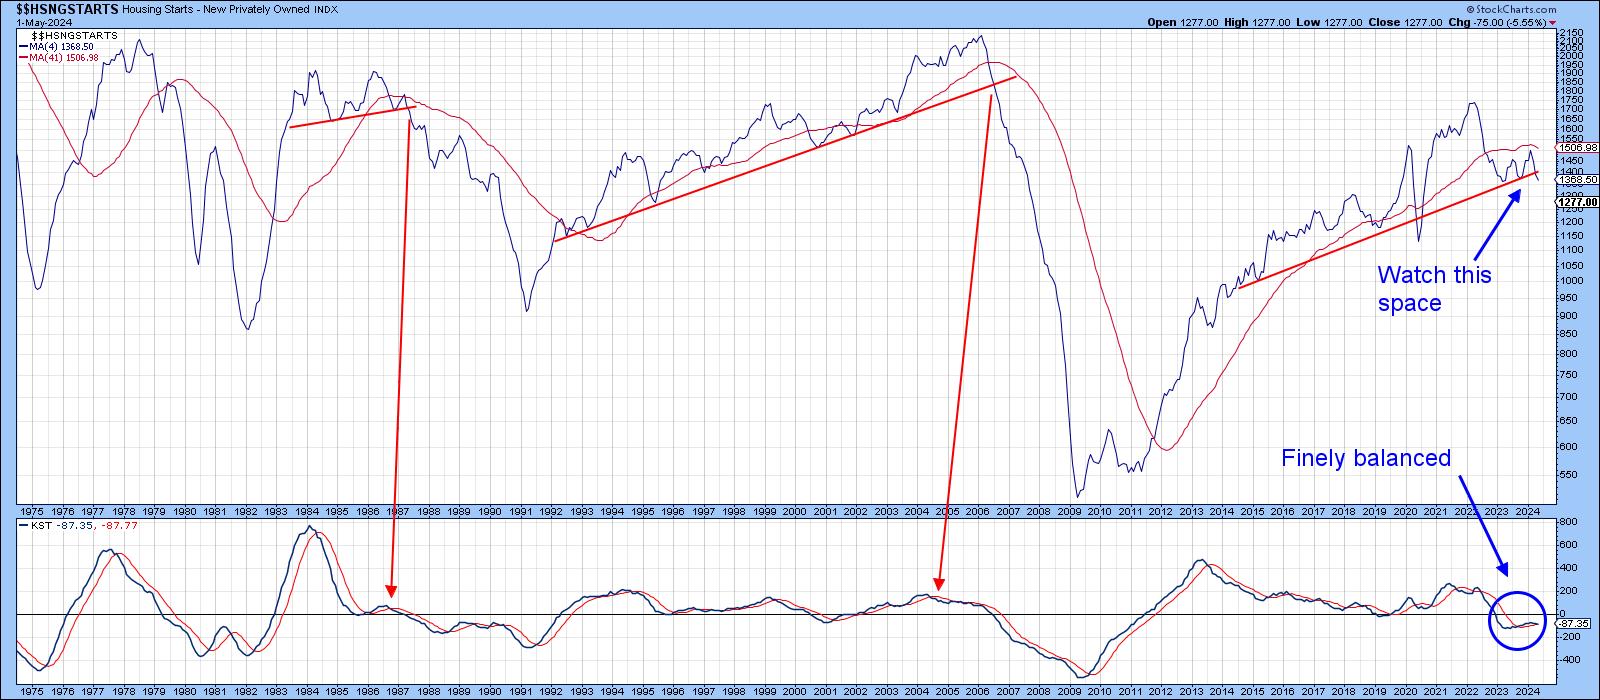
What's interesting for me is the close connection between housing starts and the Philadelphia Housing Index ($HGX). In that respect, Chart 1 compares a 4-month MA for starts against the $HGX. It's not a perfect correlation, to be sure, but there is rarely a major swing in the Index that is not replicated in the start numbers. In the case of the latter, we see a peak in early 2022, with a gentle declining zigzag ever since. This series has also dropped below its 24-month MA and (dashed) bull market trendline. The latest reported data places it slightly under the solid secondary 2021-2024 up trendline; no question, it is precariously balanced at the moment. The $HGX on the other hand, shows no such weakness, so which one is lying?

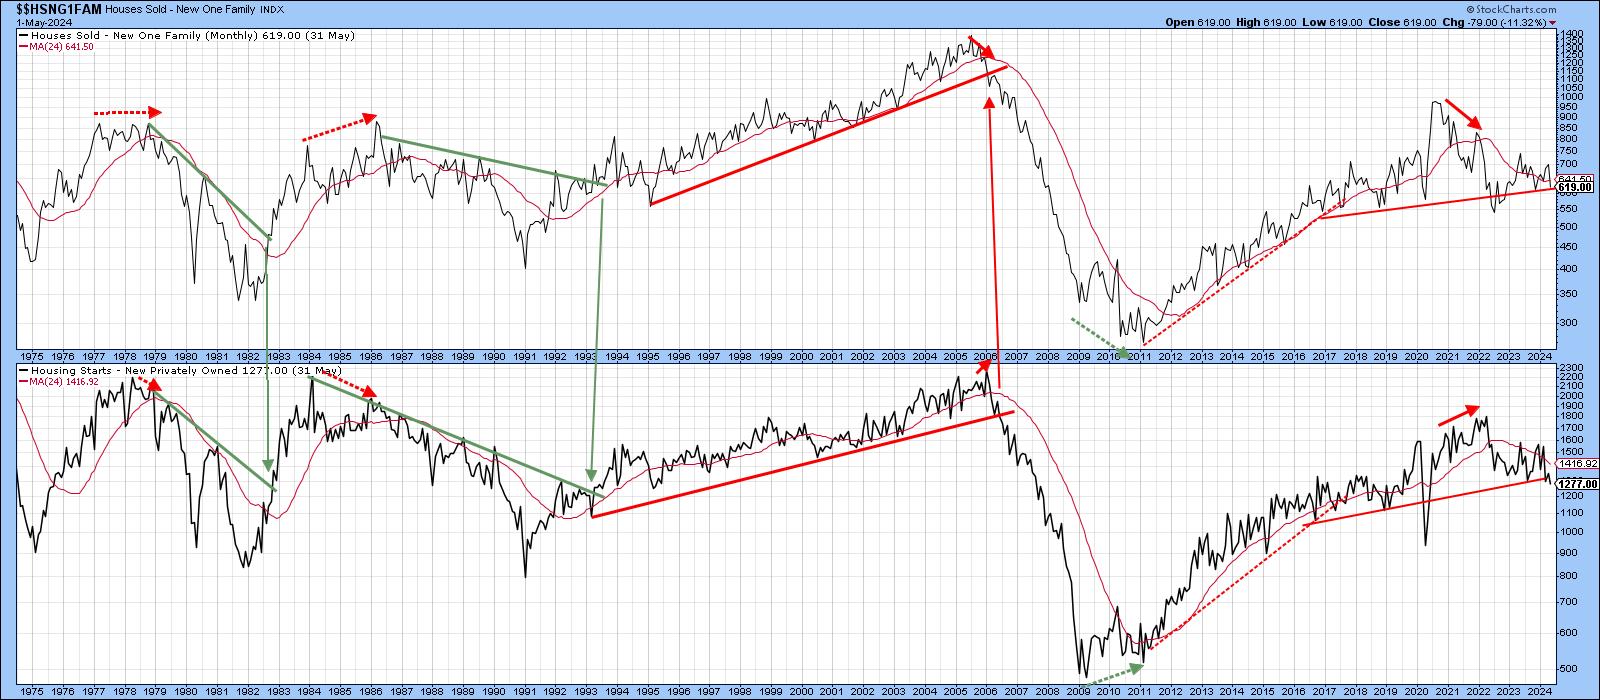
Chart 2 gives the housing start number some credibility, since it continues to move consistently with new homes sold. It would be nice to say one of these series consistently leads the other, but the small dashed and solid arrows indicate neither is dominant in this respect. The dashed ones indicate when starts lead, and the solid ones when they lag. Currently, both are consistent, since they are hovering at support in the form of a trendline.
Normally, the position and direction of the long-term KST can be of help, but Chart 3, featuring this momentum indicator for starts, shows that it has been basically flat since the start of 2023. Right now, it is declining slightly, but above its MA. Bottom line, it could easily swing in either direction, a move which is likely to be influenced by the next important move in interest rates. So, what of the Philadelphia Housing Index?
Housing Equities in Absolute Terms
Chart 4 tells us that the uptrend dating from 2022 is intact, as are the series of rising intermediate peaks and troughs. However, the long-term KST in the lower window is very overstretched, thereby hinting that a decline, such as that which took place after early 2021, could be in the cards.
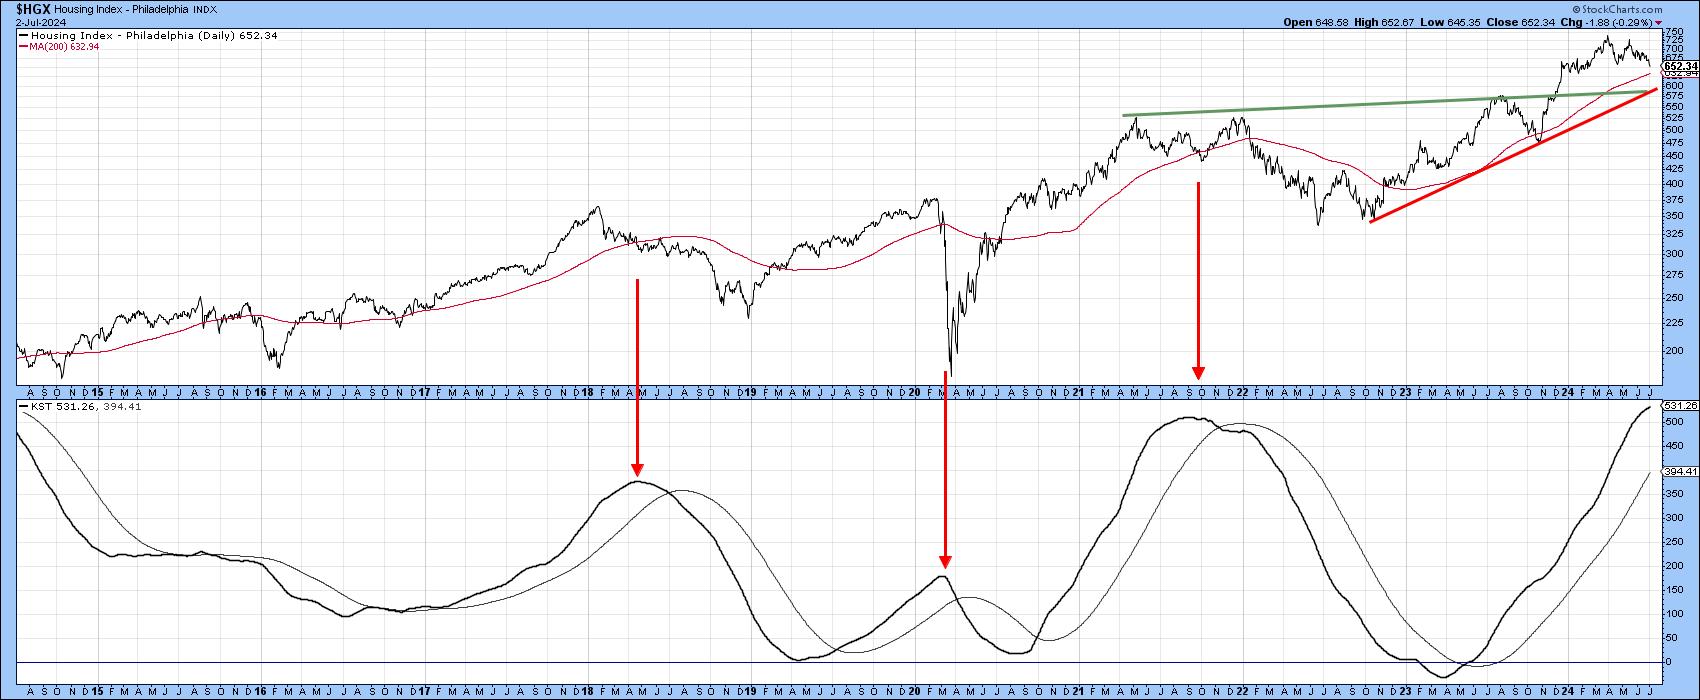
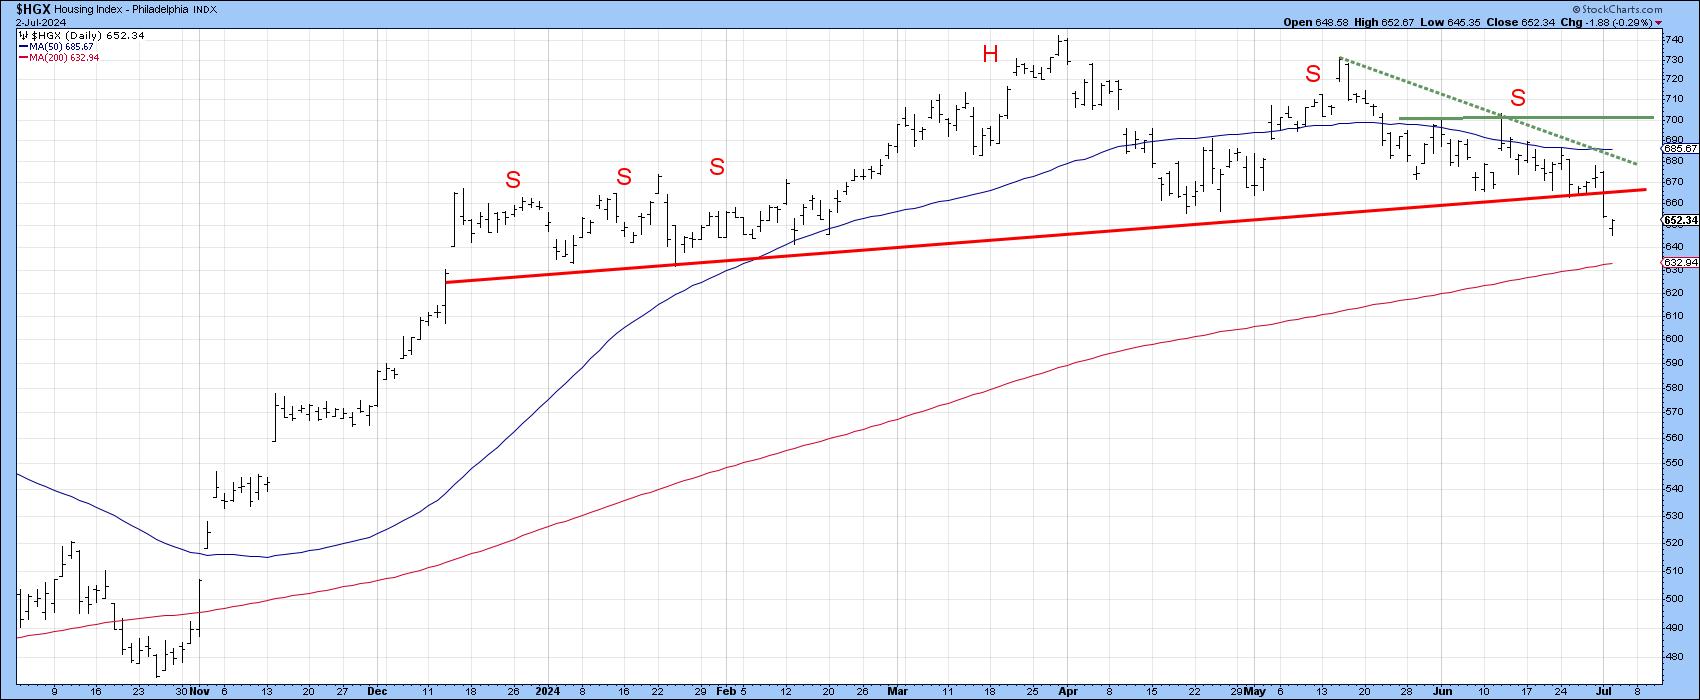
Chart 5 features the Index on a daily basis. It has recently completed and broken down from a head-and-shoulders top. I am assuming the bearish implications from that formation are in force until proven otherwise. The first step for the all clear would be a break above the dashed down trendline joining the peaks of the two right shoulders. A more convincing reversal would come with a move above the horizontal solid line joining the May and June peaks.
Don't forget you can update any of the charts in this article simply by clicking on it.
In conclusion, the major trend is still positive, but likely to be threatened if the head and shoulders is allowed to do its work.
Housing Index Relative Action
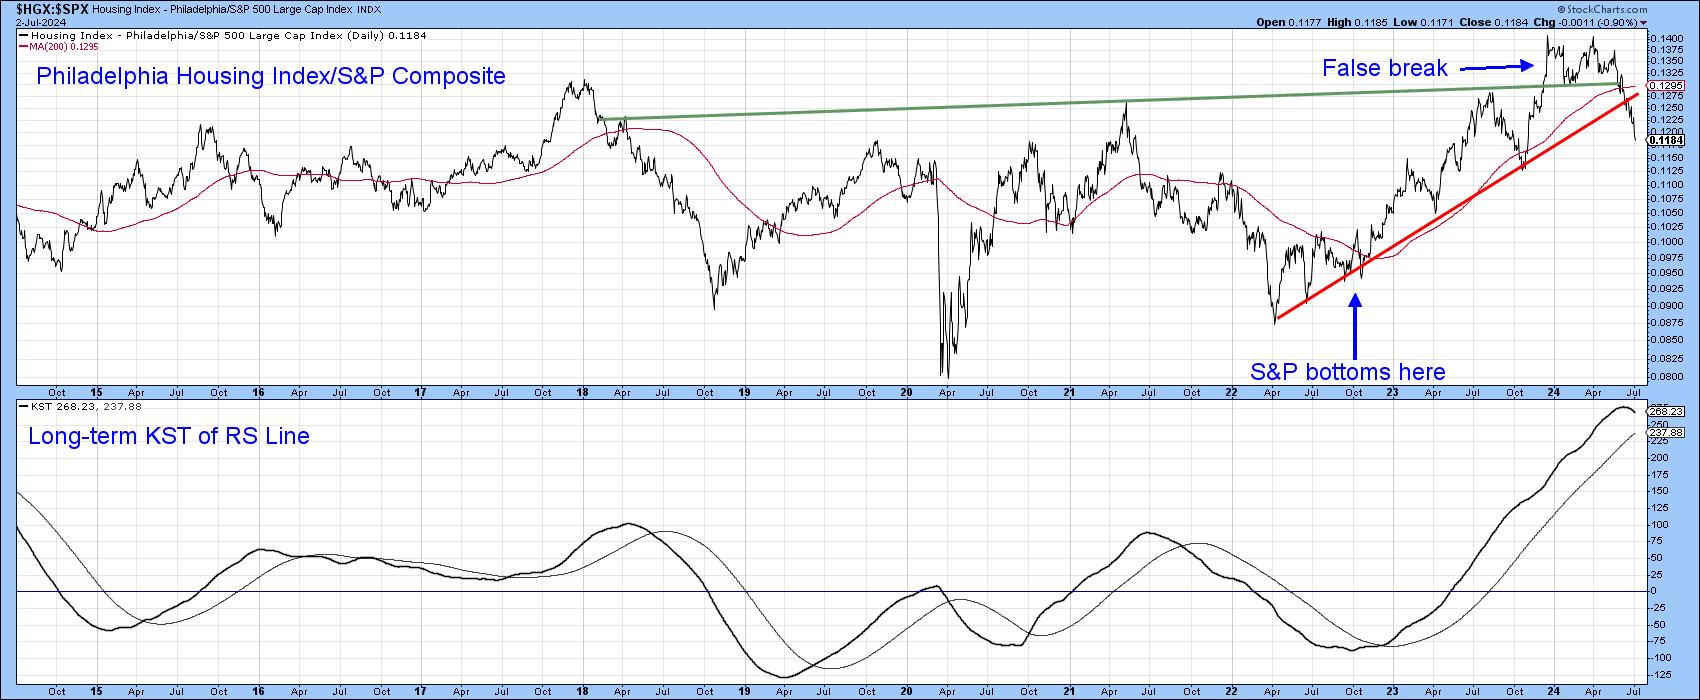
Since housing is a leading economic indicator, we would expect to see equities that are most sensitive to housing developments tending to lead the market at cyclical tops and bottoms. For example, the $HGX RS line bottomed out in late April 2022, whereas the S&P reached its bear market low several months later in October.
There are several reasons for concluding that the relative strength of the Housing Index peaked at the end of last year. First, the rolling over action of the relative long-term KST. Second, the false beak above the extended green breakout trendline. Third, confirmation of the failure through a downside break of the 200-day MA and finally, the rupture of the post 2022 bull market up trendline.
As July trading opens, the RS line clearly finds itself in an overstretched position, thereby making a retracement move highly likely. However, due to the reasons just cited, we would expect it to be just that, a retracement rather than a launch pad for a new relative high.
Good luck and good charting,
Martin J. Pring
The views expressed in this article are those of the author and do not necessarily reflect the position or opinion of Pring Turner Capital Groupof Walnut Creek or its affiliates.


