Time for a Pause That Refreshes Stocks and Gold?
Most weekends, I run through a chart list featuring weekly bars and candlesticks of bonds, stocks and commodities to see if any one or two bar patterns or candlestick formations have developed. Last week produced a crop of bearish messages from the major averages and some sectors. Before you rush off and sell everything, please note that these are not end of the world patterns, but are only expected to have a negative effect for between 5-10 bars, significant for traders, but not investors. In the case of weekly charts, we are looking at 5-10 weeks before the high of the formation is likely taken out.
That said, it is possible for these patterns to appear at critical turning points, not because they are that powerful, but because such patterns are the first domino in an otherwise vulnerable technical structure. Since most of my longer-term indicators are still bullish for the primary trend, I don't see that here.
The Major Averages
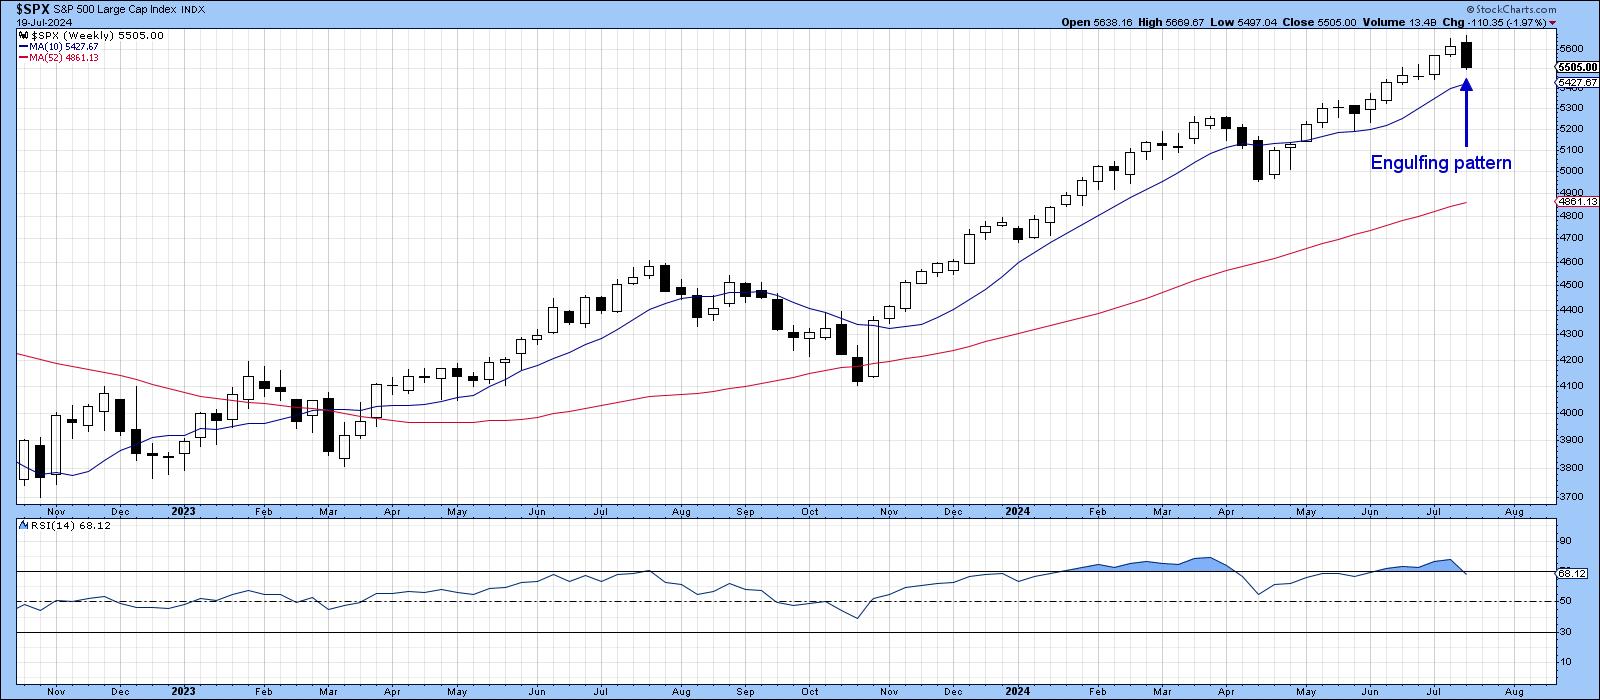
Chart 1 shows that the S&P Composite formed a bearish Outside Bar last week. It also shows up as an engulfing pattern in Chart 2 displaying candlesticks. Outside bars totally encompass their predecessor's trading range. It's also important that they are preceded by a strong persistent rally. These bars reflect a battle between buyers and sellers, where buyers have the upper hand at the start of the week. By the end, though, the price closes in the lower end of the range, demonstrating that sellers are now in control.
The strength of an outside bar as a signal is enhanced first by the steepness and perseverance of the preceding advance, meaning greater potential to take profits. The bigger the width of the bar, the wider and more encompassing the greater the battle between buyers and sellers and the greater its significance. In this instance, the bar scores well on number one and less so on the width characteristic. All one- and two-bar patterns and candlesticks should also be confirmed by some additional technical evidence. In the case of the S&P, that would be a break below 5400, which would take the Index below the red up trendline and its 10-week MA.

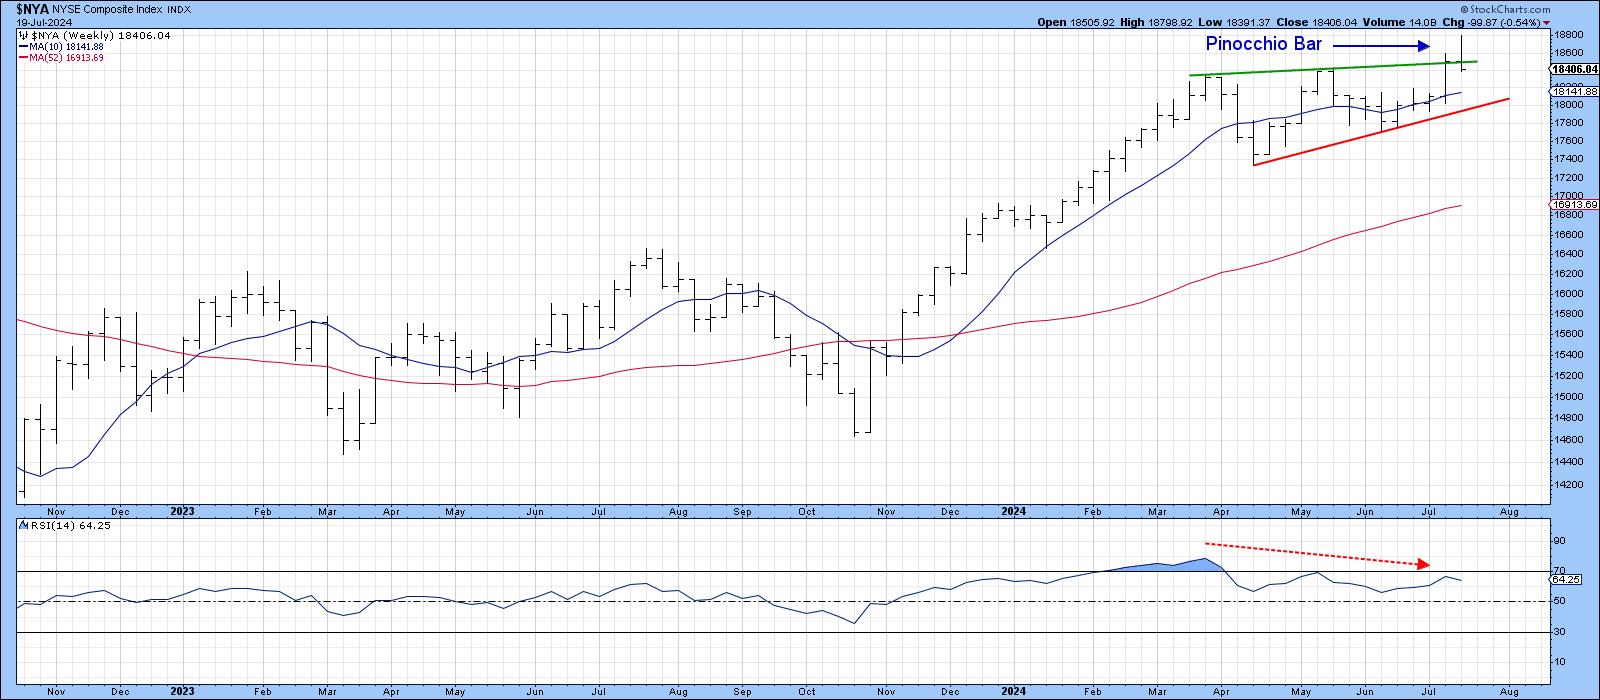
Over at the NYSE, last week's intraweek action pushed the Index above a resistance trendline, but it failed to stay there, resulting in a whipsaw move. Neither the open nor close formed above the line, so last week's action qualifies as a bearish Pinocchio Bar. Generally speaking, the longer the "nose", i.e. the size of the false break, the stronger the signal, because it indicates a lot of traders have been trapped at higher levels. This specific bar certainly qualifies, but still needs to be confirmed with a break below the red support trendline and 10-week MA.
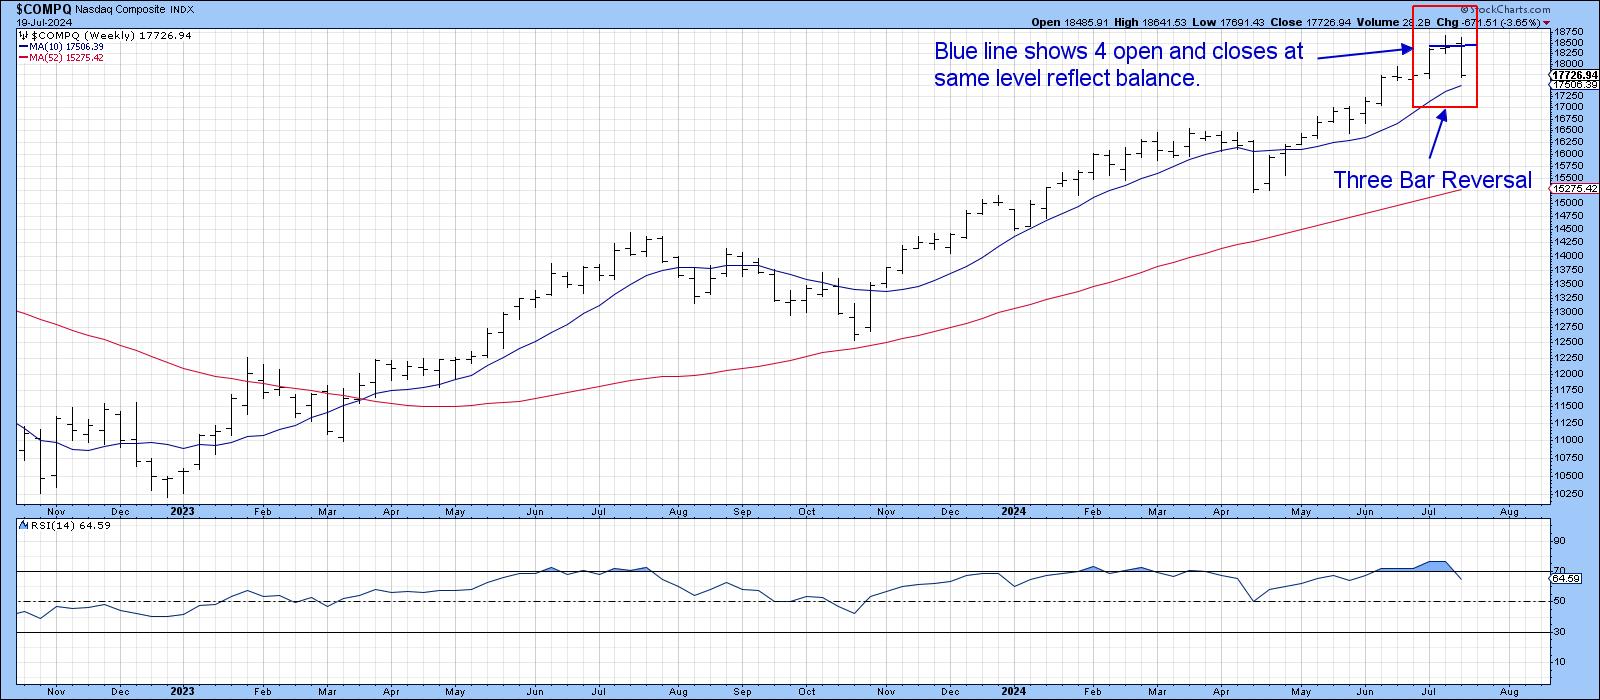
The NASDAQ, in Chart 4, does not escape retribution either, because has completed a Quiet Three Bar Reversal. These formations develop after an advance, with a wide bar that opens near its low and closes near its high. This indicates buyer dominance. The second (quiet) bar is far narrower, where the open and close are more or less identical. This tells us the buyer/seller balance is evenly matched. The third bar, which is a wide one, opens near the previous close but ends the session well below it, thereby reflecting the dominance of sellers. The wider the two bars, the greater the supply demand battle and therefore the more significant the pattern. Since this is also a weekly formation, the implication is that new NASDAQ highs are unlikely to be seen for at least several weeks.
Sectors
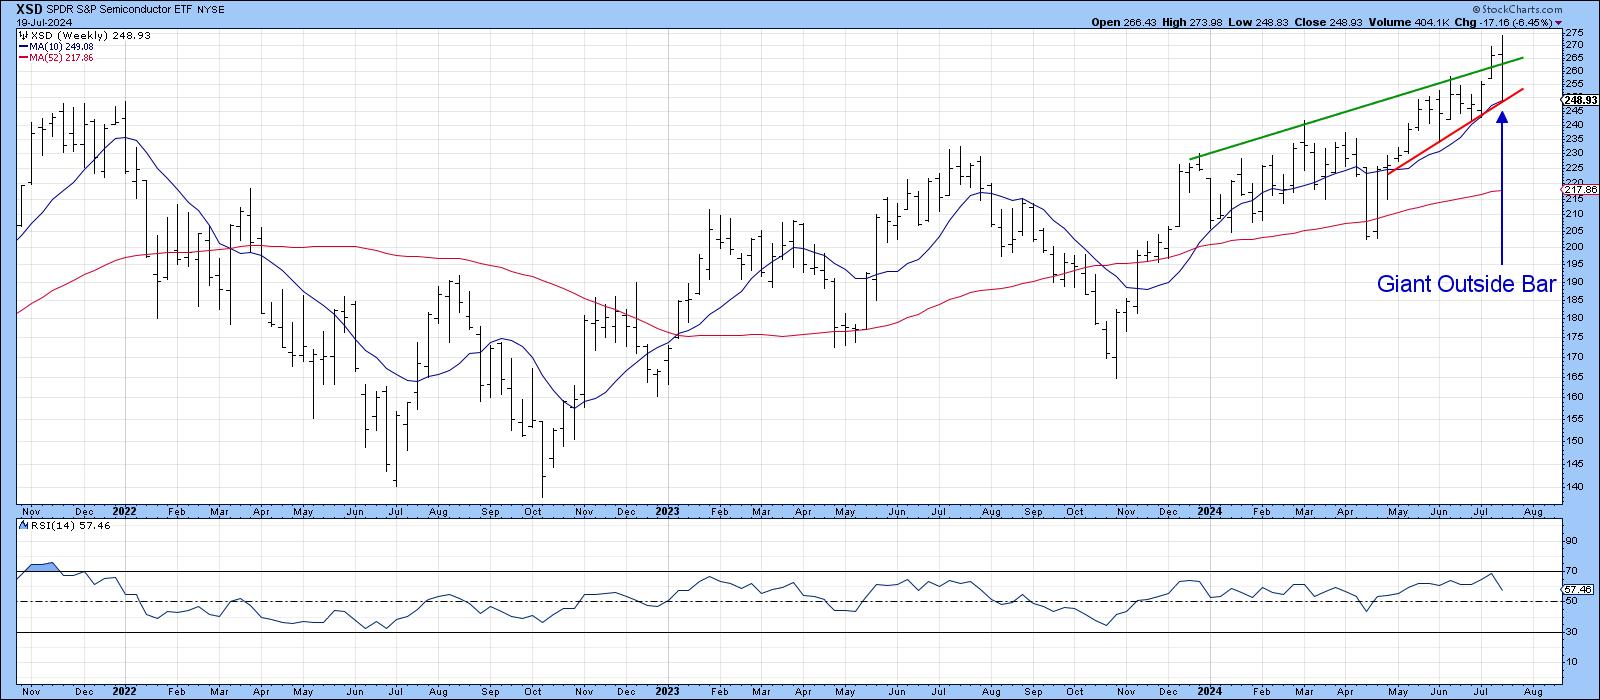
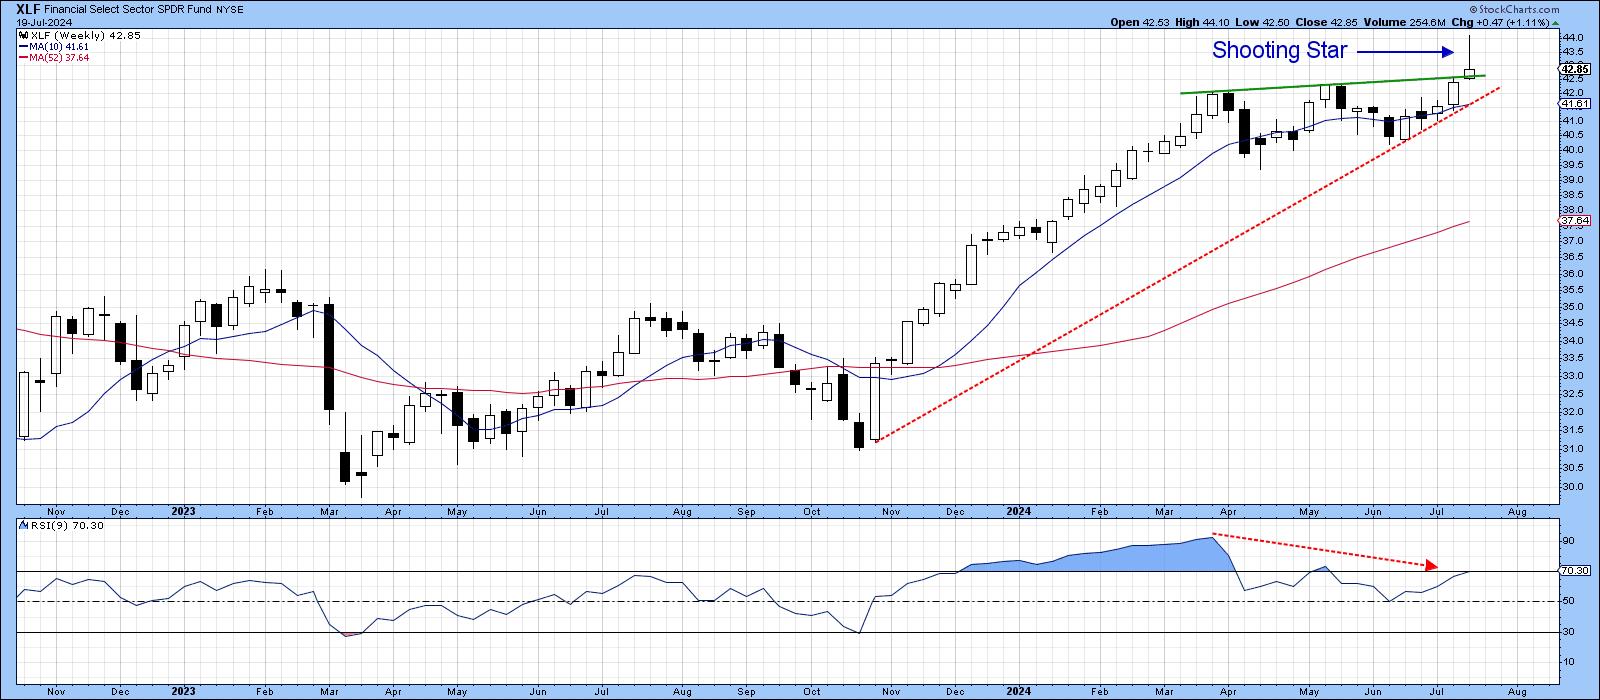
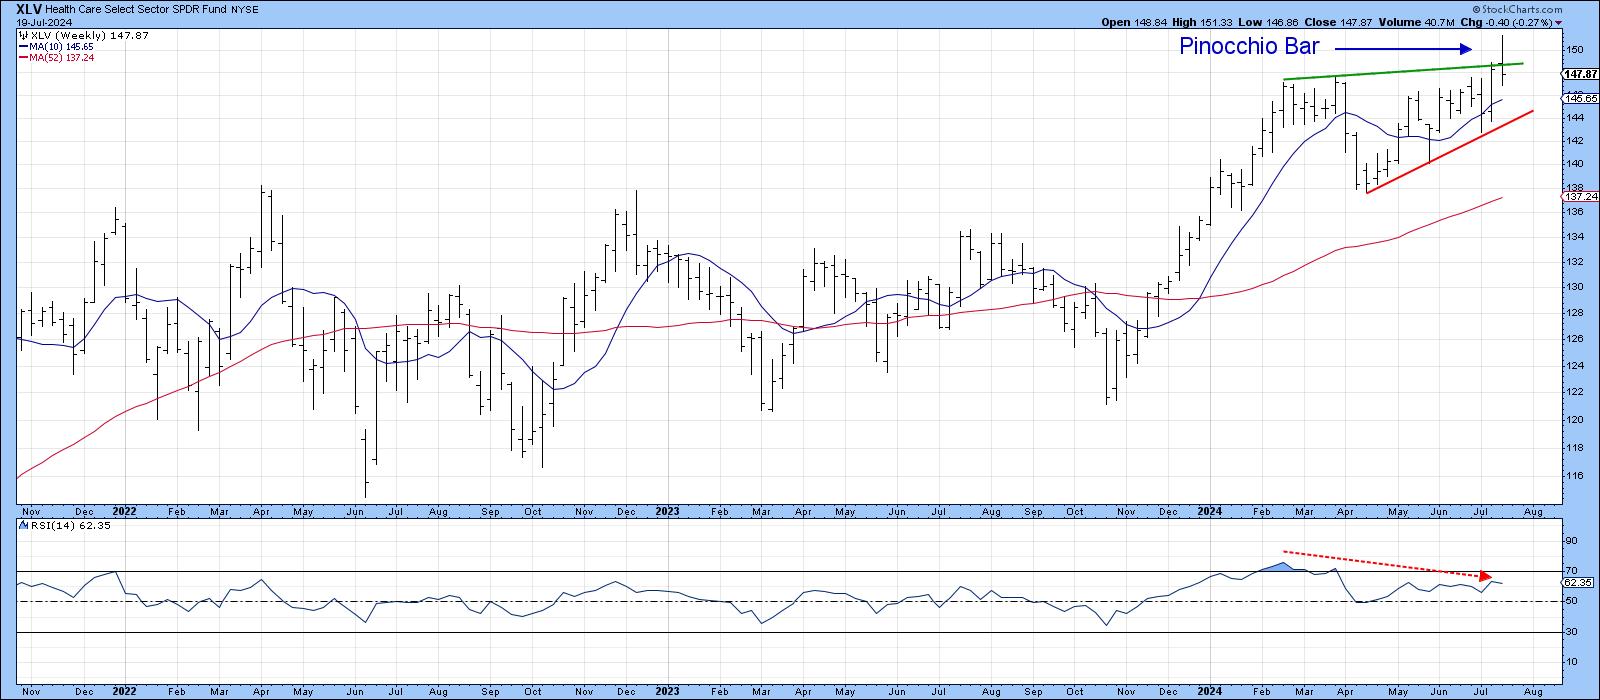
Charts 5, 6,and 7 show various one and two bar reversals for the SPDR Semiconductors (XSD), Financials (XLF), and Healthcare (XLV). The XSD is sporting a very wide outside bar, the XLF, a Shooting Star and the XLV a Pinocchio. Confirmation would come with a decisive break below the three support trendlines.
Gold
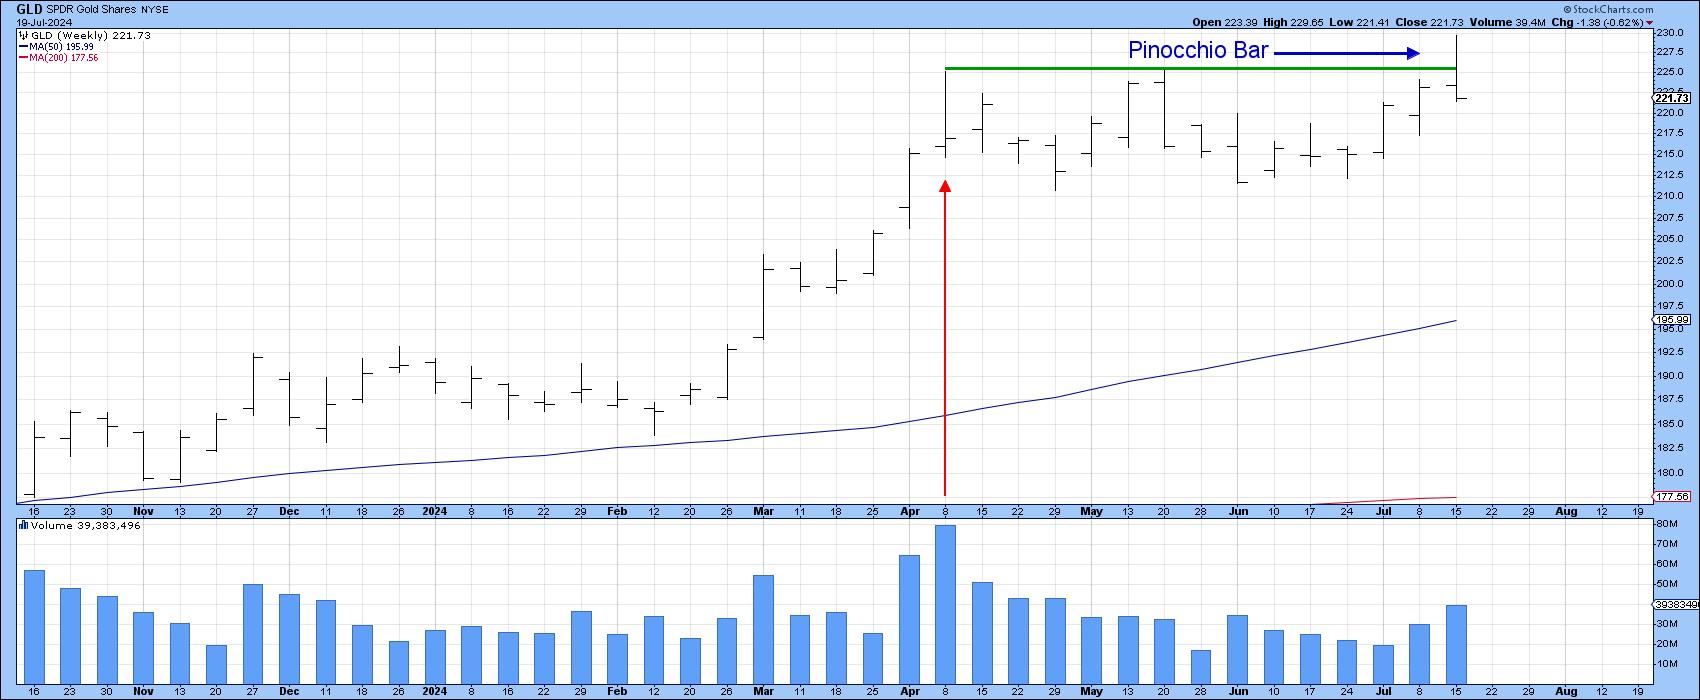
Finally, the SPDR Gold Trust experienced a Pinocchio bar. Confirmation of this bearish pattern would come with a decisive Friday close that took the GLD below its red up trendline and 10-week MA at $217. Chart 8 also indicates last week's action to be a Shooting Star, one which also took the price back to the range of April's Shooting Star, thereby demonstrating the potential strength of such weekly patterns.

Final Thoughts
One or two bar or candlestick formations, like regular price patterns, do fail from time to time. This most commonly occurs when their signals go against the direction of the prevailing main trend, which all of these do. Consequently, if any of the intraweek pattern highs are decisively bettered and prices hold there for a couple of sessions, they would be invalidated. Nonetheless, and notwithstanding the occasional retracement move, prices look as if they want to head south for a while.
Good luck and good charting,
Martin J. Pring
The views expressed in this article are those of the author and do not necessarily reflect the position or opinion of Pring Turner Capital Group of Walnut Creek or its affiliates.


