Four Sectors That Have Just Experienced Bearish Weekly Action
Most weekends, I flip through a chartlist featuring weekly bars and candles for sectors, country ETFs, currencies, bonds and some commodities. The idea is to see whether any of these entities are showing signs of bullish or bearish reversals. Most of the time, this fishing exercise does not uncover a lot. However, last week's action revealed four sectors that have done well in the last few months, but have now formed bearish two bar reversal patterns.
Two Bar Reversals
Two bar reversals reflect a sharp reversal in sentiment and appear in the charts at both tops and bottoms. Figure 1 shows an example of a bearish pattern and its principal ingredients. I tend less to think about these formations as buy and sell signals, and more in terms of the quality of individual signals. Regarding quality and strength, any given pattern should contain some or all of the following elements.
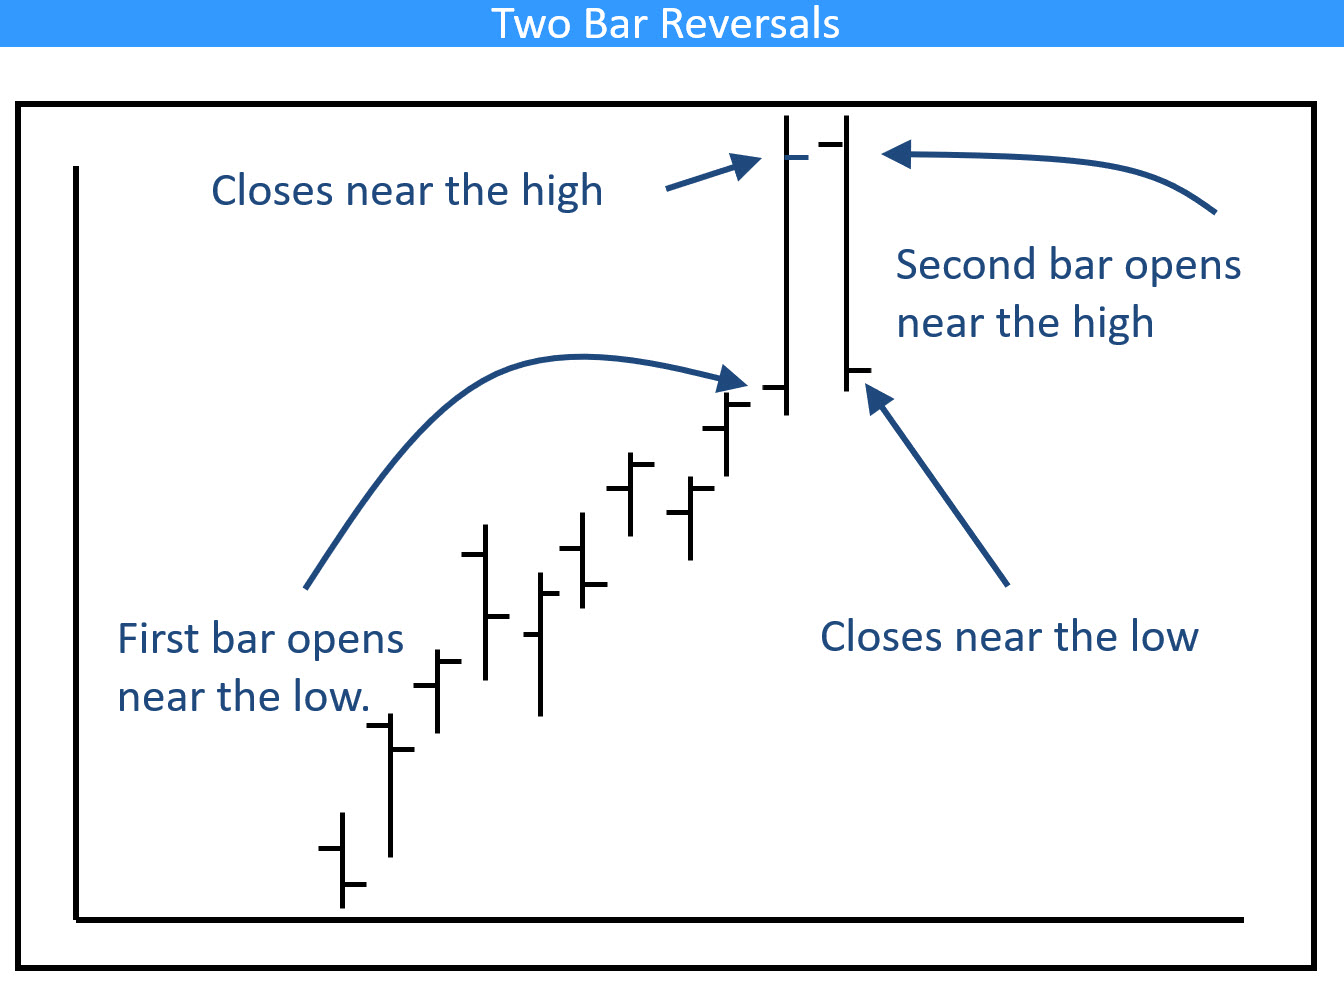
- A reversal formation should have something to reverse. In the case of a negative one, that means it should be preceded by a sharp rally, as demonstrated in Figure 1.
- The first bar should open near the low and close near the high, reflecting continued buyer dominance. The second should open near the high and close near the low, thereby showing sellers to now be in control. That also means those who bought during the pattern's formation are coming home with a loss. The wider these two bars relative to their predecessors, the greater the buyer/seller battle and, therefore, the more significant the pattern.
- The heavier the volume, the greater the number of trapped traders that overhang the market.
- The longer the time frame of the bar, the greater its significance. Hourly bars will have a smaller effect than daily ones, etc. The bars featured here are weekly in nature and are therefore expected to have an effect for between 5-10 weeks.
- These patterns represent just one piece of bearish evidence in the weight-of-the-evidence approach. Consequently, they should be confirmed by additional bearish action, such as a negative MA crossover trendline penetration and so forth.
Having established what a negative two bar reversal looks like, Chart 1 features an actual example for the iShares Telecommunications ETF (IYZ). It scores well on having something to reverse, because of the robust rally leading into the pattern. However, the bars are not that wide and do not therefore reflect a huge battle between supply and demand. I'd give it three stars out of a possible five. That implies any violation of the up trendline and 10-week MA by way of confirmation would suggest this sector is headed lower. Note the two bar reversal that took place in January of this year, which was followed by a 3-month decline.

Chart 2 features a negative two bar reversal for the financial sector (XLF). This example also scores on a strong rally preceding the pattern, but, again, the width of the individual bars is not that compelling. Confirmation would come from a violation of the up trendline, as that would also result in a negative 10-week MA crossover.
The two bar reversal pattern that formed in August offers a sharp reminder of why confirmation is needed. That's because the pattern was quickly invalidated with a move to new highs.

Chart 3 features a two-bar reversal for the XME, which also involved a breakout from a 6-month consolidation pattern. The problem is that the close for the second bar took the price back below the breakout point, thereby hinting that the breakout will turn out to be false. Once again, validation requires confirmation, which would come with a weekly close under the 10-week MA.

Dark Cloud Cover
We turn to a two bar candlestick pattern for our final chart. Last week, the VanEck Vectors Gold Miners ETF (GDX) completed the second bar of a dark cloud formation. Dark clouds do not appear on the charts that often. However, when they and their bullish white line counterparts do, it is usually consequential.
Dark clouds form at the culmination of a strong rally. The first candle has a long white real body. The second has two characteristics. First, it opens above the high of the white candle. Second, it closes half way or more down the white candle's real body. In the case of the GDX, confirmation would come with a break below the 10-week MA and the up trendline.

Good luck and good charting,
Martin J. Pring
The views expressed in this article are those of the author and do not necessarily reflect the position or opinion of Pring Turner Capital Groupof Walnut Creek or its affiliates.


