The Dollar's Technical Position is Crucial from a Short, Intermediate, Primary, and Secular Standpoint
Chart 1 shows the Dollar Index has been in a trading range for the last couple of years and is now at resistance in the form of its upper part. The big question relates as to whether it can break to the upside, or if the resistance will once again be overwhelming.
Bearing in mind that a rising tide (trend) lifts all boats (prices), we first need to gain some long-term perspective.
Secular Trend
In that respect, the red and green arrows approximate primary trends. The important thing to note is that they show a clear cut pattern of rising peaks and troughs, thereby signaling the secular, or very long-term, trend is bullish.
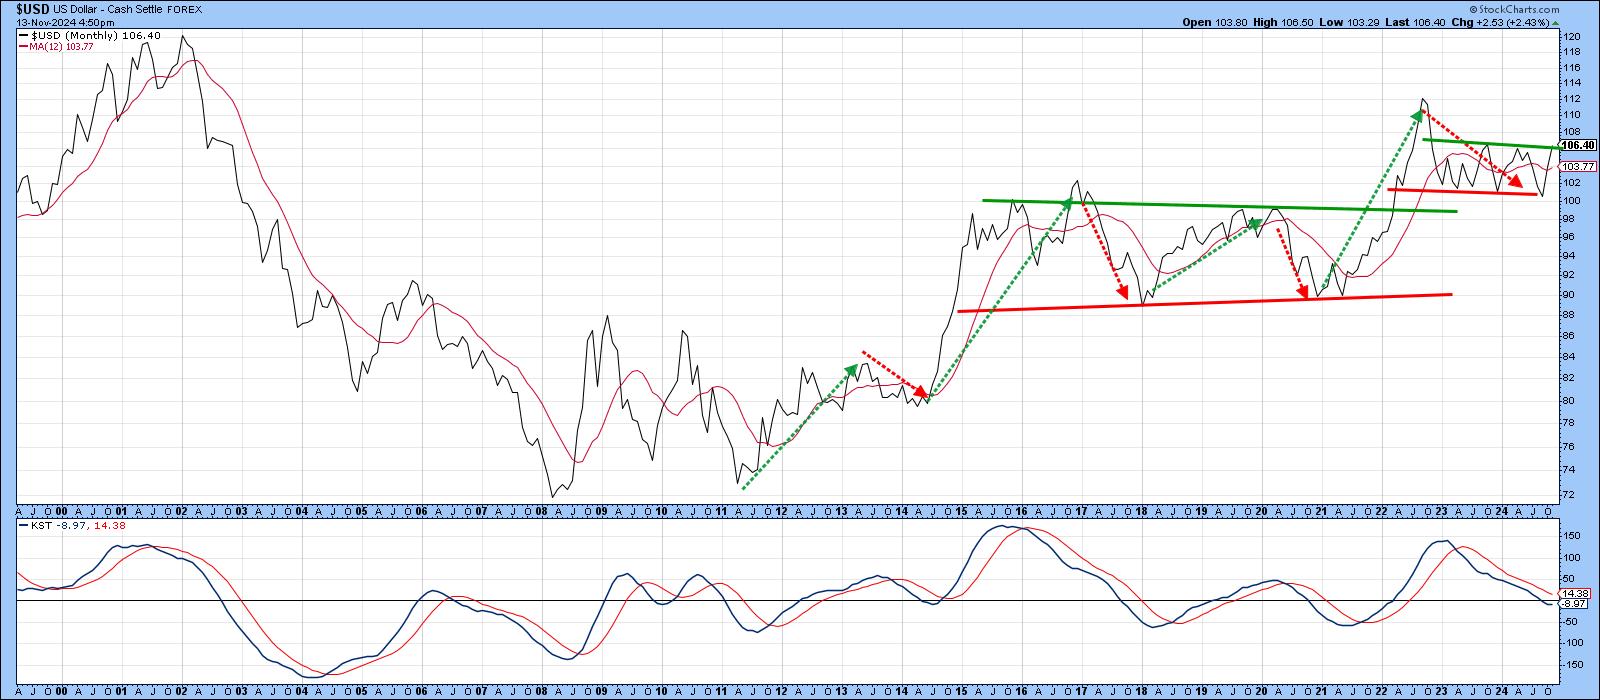
Chart 2, which features the Dollar Index on a quarterly basis, adds further evidence supporting this conclusion. First, the 1985-2022 secular down trendline and the red-dashed 23-year secondary down trendline have been decisively violated with an upside breakout. Second, the Index is comfortably above its 16-quarter MA, a time span that has proved to be a key pivotal point in the last several decades, demonstrated by the small green and red arrows. Finally, the Coppock Curve, in the bottom window, remains above its 6-quarterly MA by the narrowest of margins. It could therefore easily tip to the downside. The green-shaded areas indicate that a positive MA relationship has usually been associated with a bullish dollar trend; consequently, it is important that the Coppock Curve remains above it.

Primary Trend
One of my favorite techniques for identifying primary trends is to observe when the 6-month EMA crosses above its 15-month counterpart. This shows up as a positive zero crossover by the PPO in Chart 3 and earns some green shading in the chart. The oscillator recently dropped below zero for a bear signal. In the opening two weeks of November though, it clawed its way back above by a fraction of a point. With two weeks to go until the end of the month and an official plot, it is far too early to conclude that a bullish signal has been triggered. However, it does underline the point that the Index has reached a critical technical juncture.

Chart 4 features the long-term KST for relationships that usually move in sympathy with the Dollar Index, such as US vs. international bonds, US stocks vs. the world ex the US, and so forth. The shaded areas approximate periods when the (turquoise) KST for the Index itself is in a rising trend. In most situations, when these dollar "sympathy" relationships turn with the Index, the dollar rallies as well. The latest (preliminary) data shows that two of these relationships are already in a rising trend. Dollar Index momentum and that for the US/International bond ratio (AGG/BWX) have also begun to tick up. Further strength would offer powerful evidence in favor of an upside resolution of that dollar trading range.

Intermediate Trend
Chart 5 is based on a Friday close, so Wednesday's breakout does not officially count. However, it does look as if the move is now being supported by a positive intermediate KST and that an upside breakout is more likely than not.

Short-Term Trend
The Index is also trying to break out from its trading range on a daily closing basis. The Dollar Diffusion indicator in the lower window monitors a universe of cross dollar relationships in a positive trend. The two dashed arrows remind us that subzero upside reversals are not always followed by a rally, but the solid ones demonstrate that most are. The indicator is in a rising mode but not overextended, so it could support a breakout by the Index, even though the speed and magnitude of the November rally would suggest a near-term pause first.

I find Chart 7 to be the most intriguing of all. It cumulates the data derived from the Diffusion indicator featured in Chart 6. In 2014, it broke above a decade long down trendline, which was followed by a multi-year advance in the Index. If the current trading range is completed with an upside breakout, it is highly likely the cumulated indicator will rally above its 2016-2024 resistance trendline and be followed by a long-term advance in the Dollar Index itself.

Good luck and good charting,
Martin J. Pring
The views expressed in this article are those of the author and do not necessarily reflect the position or opinion of Pring Turner Capital Groupof Walnut Creek or its affiliates.


