These Country ETFs are Looking Particularly Vulnerable
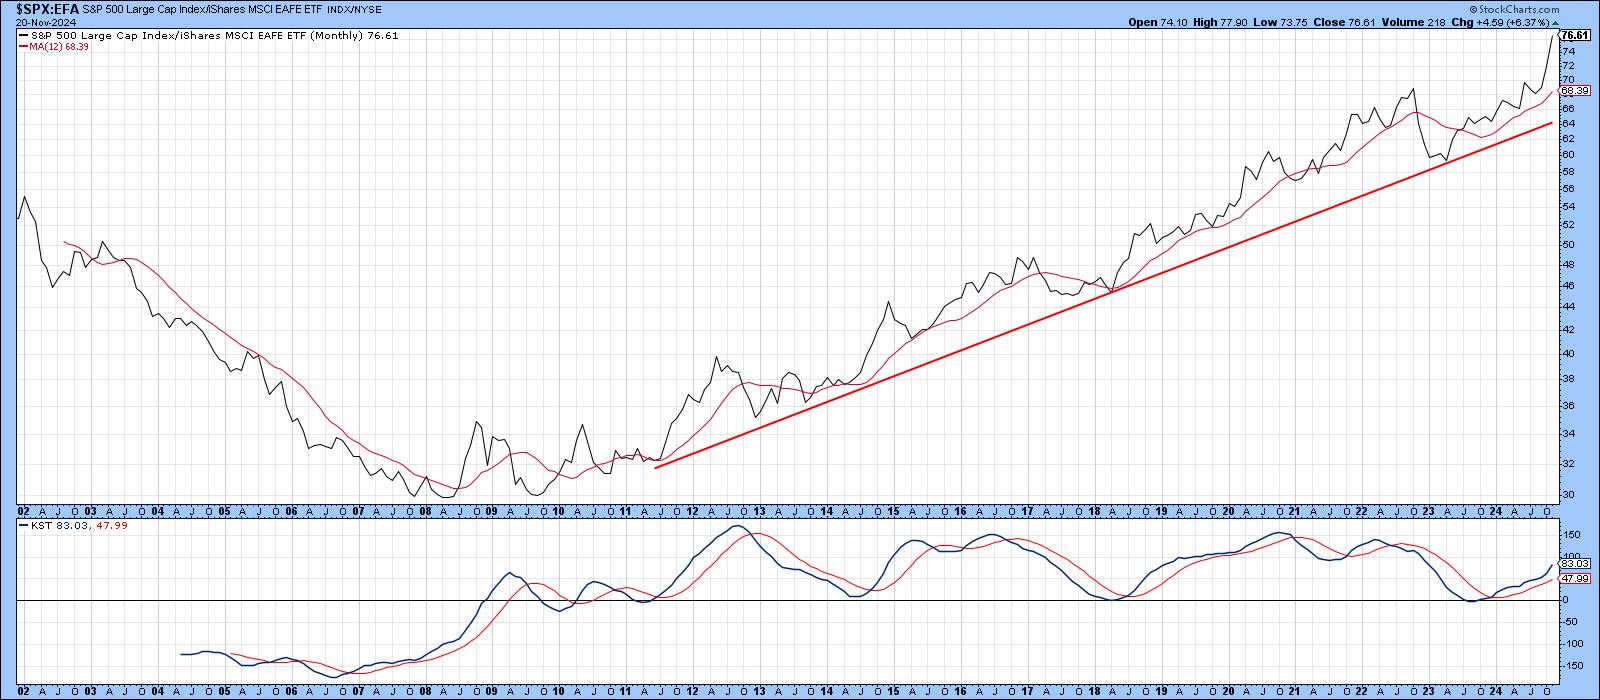
Chart 1, below, compares the S&P Composite to the Europe Australia Far East ETF (EFA), which is effectively the rest of the world. It shows that US equities have been on a tear against its rivals since the financial crisis. More to the point, there are very few signs, apart from a moderately overbought long-term KST, that this trend is going to reverse any time soon. It also begs the question: How do these non-US markets look on an absolute basis?
In that respect, Chart 2 features the EFA itself back to the pre-financial crisis period. In that period, it formed a giant trading range. A few weeks ago, the price managed to push through the overhead resistance, but failed to hold above it. This suggests a possible whipsaw situation. If not quickly cleared up, with a re-grouping and surge to new highs, false breakouts are usually followed by a strong move in the opposite direction to the break. The reason is that many traders justified their purchase on the breakout, expecting an extension to the rally. When that advance does not take place and prices "unexpectedly" retreat, they are forced to reposition themselves to the right side of the market, adding to the downside pressure in the process.

Under any false breakout scenario, it's important to seek additional evidence that confirms the probability that a whipsaw has taken place. In that respect, Chart 3 introduces a couple of momentum indicators and focuses on more recent price activity. close, The price requires a Friday close on this weekly chart for validation. As of Wednesday, it was toying with its 2022-24 bull market trendline and 65-week EMA.
Arguably of equal potential significance is the possibility that it may be tracing out a broadening wedge. Their widening characteristics reflect a growing instability. Consequently, broadening wedges are often particularly venomous formations when completed. This one has been identified with the two diverging dashed red trendlines. It's important to add that none of these chart points have yet been decisively violated, but they are certainly holding out there as something that needs to be watched closely.

Europe
Drilling down to its principal component, European shares in the form of the iShares Europe ETF (IEV), we, not surprisingly, see a another potentially false upside break (Chart 4).

However, Chart 5 shows that the IEV has experienced a more decisive trendline and EMA break. Bottom line, Europe, whilst overdue for a quick near-term retracement move, does not look attractive from a longer-term aspect.

Japan
Japan, which has a 20% weighting in the EFA, did not experience a false breakout, like its European counterpart. This can be seen in Chart 6. Even so, that did not stop its RS line from registering a new secular low. Note that the long-term KST for relative action is bearish again. Emphasizing the weak relative action is the fact that the RS KST, apart from a brief period around 2016, has been below its its equilibrium line since early 2011.

More Positive Non-US Country ETFs
Chart 7 tells us not all international markets look weak. It is true the commodity sensitive iShares MSCI Emerging Markets ETF (EEM) is experiencing a new relative low (third panel), but its long-term KST in the bottom window is definitely in an established uptrend. The absolute price has just completed a base and is above its 65-week EMA, all of which is constructive.

Chart 8, featuring the iShares China Large Cap (FXI), reveals the completion of a 2-year base, which is being supported by a rising long-term KST. Most impressive of all is the violation of the 2021-2024 down trendline in relative action and the bullish RS long-term KST.

Finally, the iShares MSCI Canada ETF (EWC) is probing new highs at a time when the RS line, in the third window, is trying to break to the upside; definitely something worth monitoring here!

Martin J. Pring
The views expressed in this article are those of the author and do not necessarily reflect the position or opinion of Pring Turner Capital Groupof Walnut Creek or its affiliates.


