Three Charts That Could Be About to Break in a Big Way
This article is not centered around a specific theme; rather, it focuses on some charts which look as if they are about to signal an important change in trend. In this case, "important" is defined as a forthcoming move lasting at least 3-months.
My indicator of choice for this task is the Special K (SPK). If you are not familiar with the SPK, you can read about it in detail here. To briefly summarize, it is calculated by adding the daily short-term KST to the intermediate- and long-term series. The result is a jagged indicator that has a strongtendencyto peak and trough very near to primary bull market tops and bear market lows of the price being monitored. I emphasize the word "tendency" because the SPK can turn well after the price during a truncated cycle and reverse prematurely during a linear uptrend or downtrend. Fortunately, those are the exception rather than the rule.
With the benefit of hindsight, these SPK turning points are easy to spot. Unfortunately, we live in the real world and need some techniques to help identify such pivot points. Since the SPK traces out a relatively jagged path, trendline violations are a great start. Another helpful vehicle comes from signal line crossovers. In this case, the signal line is a 100-day smoothing of a 100-day simple moving average.
Experience has shown that the most reliable signals tend to occur when a legitimate trendline and the signal line are simultaneously violated. By the term "legitimate", I mean a line that has been touched or approached on at least three occasions and which should be at least 6-to-9-months in length, thereby reflecting a similar trend to the signal line itself. One final point is that it should also be possible to observe a violation of a legitimate trendline or reliable MA for the price itself by way of confirmation.
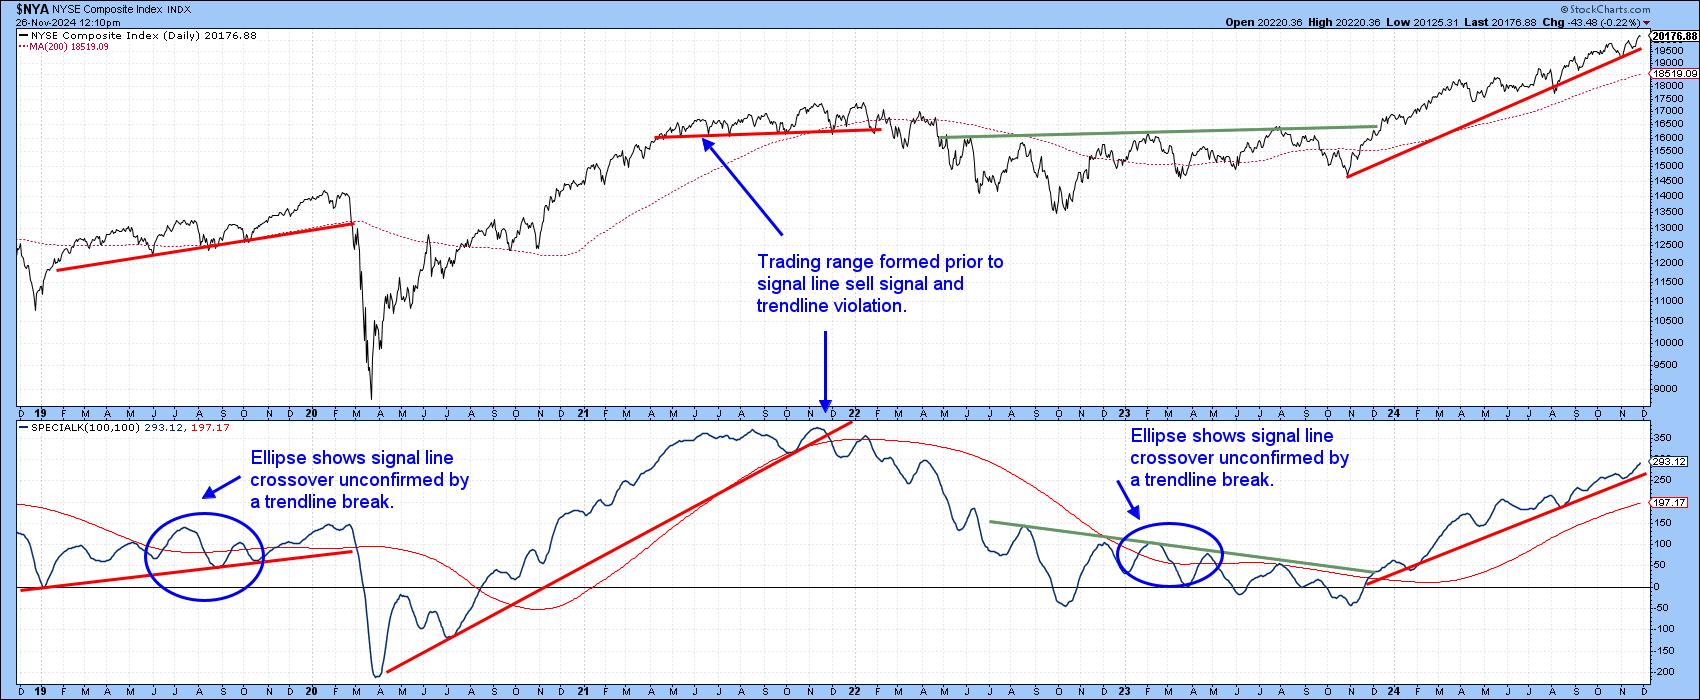
Chart 1, featuring the NYSE Composite, offers a great example from the spring of 2020, when a trendline and 200-day MA were penetrated at the same time the SPK and its signal line were being violated. Note the signal line experienced a couple of whipsaw crossovers in the summer of 2019, but these were not associated with a trendline break. A similar combination of whipsaw SPK signal line crossovers occurred in 2023, but it was not until late that year the green trendline and signal line were jointly violated, and this was later confirmed by the price.
Fast forward to the present, where we can construct a line for both the Index and the SPK. Both are currently intact but are telling us little, except that the bull market is getting long in the tooth. I am watching closely, because a joint violation will probably usher in a trading range environment similar to that of 2021, as the gap between the signal line and SPK itself narrows. I call this a steady-as-she-goes chart because it's not indicating any action is required at this time, but is certainly worth monitoring going forward.
Europe Looking Vulnerable
The US may be in good shape for the moment, but the iShares MSCI Eurozone ETF (EZU) is not looking so hot. To start with, the price has violated its bull market up trendline and its 200-day MA. In addition, the SPK has completed its 2024 top and dropped below its signal line. The 2022-2024 bull market trendline for the SPK remains intact, but, given the other breakdowns, is soon likely to give way after a relief rally.

The Dollar Index
Chart 3 is much more interesting in that the Dollar Index has tentatively broken out from a base and its SPK has violated its green down trendline. The next challenge lies at the signal line, which is likely to be surpassed if the Index can maintain its breakout.

Small Cap Relative Action
Our final chart features the relative action of small cap stocks in the form of the Russell 2k ETF (IWM), which has experienced a tentative upside breakout. The RS line is also above its 200-day MA, but we can't place a great deal of weight on that due to the numerous whipsaws that have been generated since late 2022. What we can say is that the SPK has violated its 2021-24 dashed down trendline, as well as the signal line. All that is now required for a positive long-term RS picture is a more decisive RS trendline violation and the completion of the potential base in the SPK itself. Remember, you can update any of these charts going forward simply by clicking on them.

Good luck and good charting,
Martin J. Pring
The views expressed in this article are those of the author and do not necessarily reflect the position or opinion of Pring Turner Capital Groupof Walnut Creek or its affiliates.


