Is The First Domino About to Fall for the Bitcoin Bull Market?
The Long-Term Picture
No market goes up forever and, at some point, Bitcoin will top out. It's currently down about 12% from its peak, set on December 17 less than 4 weeks ago, so there is scant evidence at this point indicating a primary bear market. For example, Chart 1 shows that the price has recently broken out from a consolidation reverse head-and-shoulders pattern and is way short of its minimum ultimate price objective, calculated by projecting the dashed blue arrow upwards at the point of breakout. It is also a long way from its red secular up trendline, which is currently around the $60,000 level.
The green-shaded areas tell us when the PPO, using the 6- and 15-month parameters, is above its red 8-month MA. These periods embrace each of the major rallies and the unshaded ones all the significant declines. The current picture is bullish because the price is above its MA. However, there are two observations worth noting.
Firstly, each major peak since 2018 has been higher than its predecessor, whereas those for the PPO have been progressively lower. This indicates a dissipation of long-term upside momentum. Second, the four previous PPO buys signals were associated with strong upside momentum coming out of the box. The most recent one has so far been anemic. That could always change, of course, but it does leave the oscillator in a precarious position should the current rally fail to pick up steam and a short-term decline set in.
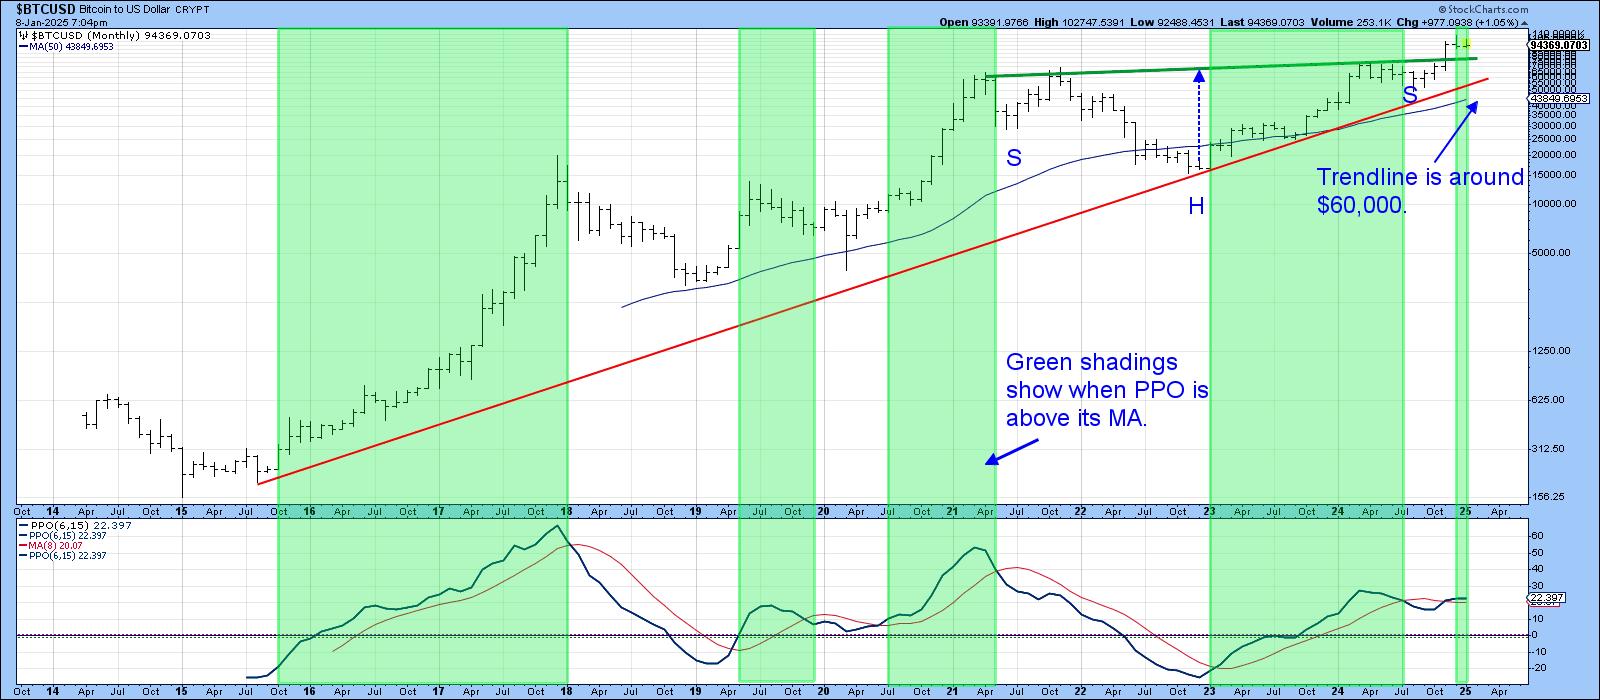
Chart 2 paints a similar picture with the Special K (SPK). The Special K is described here.It is currently bullish, as it is above its signal line. Once again, the margin of error is thin because it could easily drop below the line once more. Note there have been just two false SPK sell signals in the last four years, implying that any additional weakness is likely to have a lasting effect.

Chart 3 sets out the KST for the short-, intermediate-, and long-term trend. At this point, the long-term series is positive, as it is trading above its EMA. Here again the distance between the average and the indicator is narrow. Narrow enough perhaps, to allow the current short-term sell signal in a negative way. That said, the 3-year consolidation inverse head-and-shoulders ought to provide important long-term support to any short-term correction.

The Short-Term Picture
That short-term picture is looking a bit precarious at the moment, as we can see from Chart 4, which holds out the possibility that Bitcoin is in the final stages of forming a head-and-shoulders top. It is currently slightly above support in the form of the potential neckline, and its daily KST has started to turn up. If this is a bull market, we would expect to see that positive KST result in a rally, as has been the case in four of the five buy signals since last May. If it fails to trigger anything more than a reflexive bounce, that would be a bad sign.

Chart 5 suggests things are more likely to break to the downside, as the price has just experienced a negative two bar reversal. That two-day pattern also resulted in a false upside break. It is always wiser to make sure that potential whipsaws are confirmed by additional evidence. In this instance, a more decisive penetration of the red up trendline would suffice. The odds would then strongly favor the completion of the head-and-shoulders, since false breakouts are typically followed by an above-average move in the opposite direction to the breakout.

Chart 6 also points to a weakening technical structure. It shows that Bitcoin touched a new all-time high in December. However, Ethereum and XRP, the second and third largest crypto vehicles according to Forbes, failed to do so. That situation could change, of course, but at this juncture is not a positive sign.

Finally, Chart 7 features Bitcoin, along with two stocks that move in sympathy with its price, Coinbase and Micro Strategy. Note that neither confirmed the December Bitcoin peak, and have since sold off.

Conclusion
There is insufficient evidence to call a top in Bitcoin. However, forming one is a process that starts with a strategically placed short-term decline. Like the first domino, it subsequently tips over the intermediate- and long-term trends. The short-term technical position looks vulnerable, but it remains to be seen, if it does correct some more, whether it will turn out to be a domino or not.
Good luck and good charting,
Martin J. Pring
The views expressed in this article are those of the author and do not necessarily reflect the position or opinion of Pring Turner Capital Groupof Walnut Creek or its affiliates.


