One Small Push by Commodities Could Lead to a Giant Leap for Commoditykind
That may seem like a strange title, but it is intended to make the point that commodities look as though they are in the process of breaking out. Furthermore, this breakout, if successful, would jump-start a finely balanced long-term technical position into a primary bull market, all courtesy of our friends at the Fed.
In this respect, Chart 1 features four principal commodity indexes or exchange traded products. Three of them have violated 3-year down trendlines, while the fourth, the Invesco DB Commodity Index Tracking Fund (DBC), is right at its line.
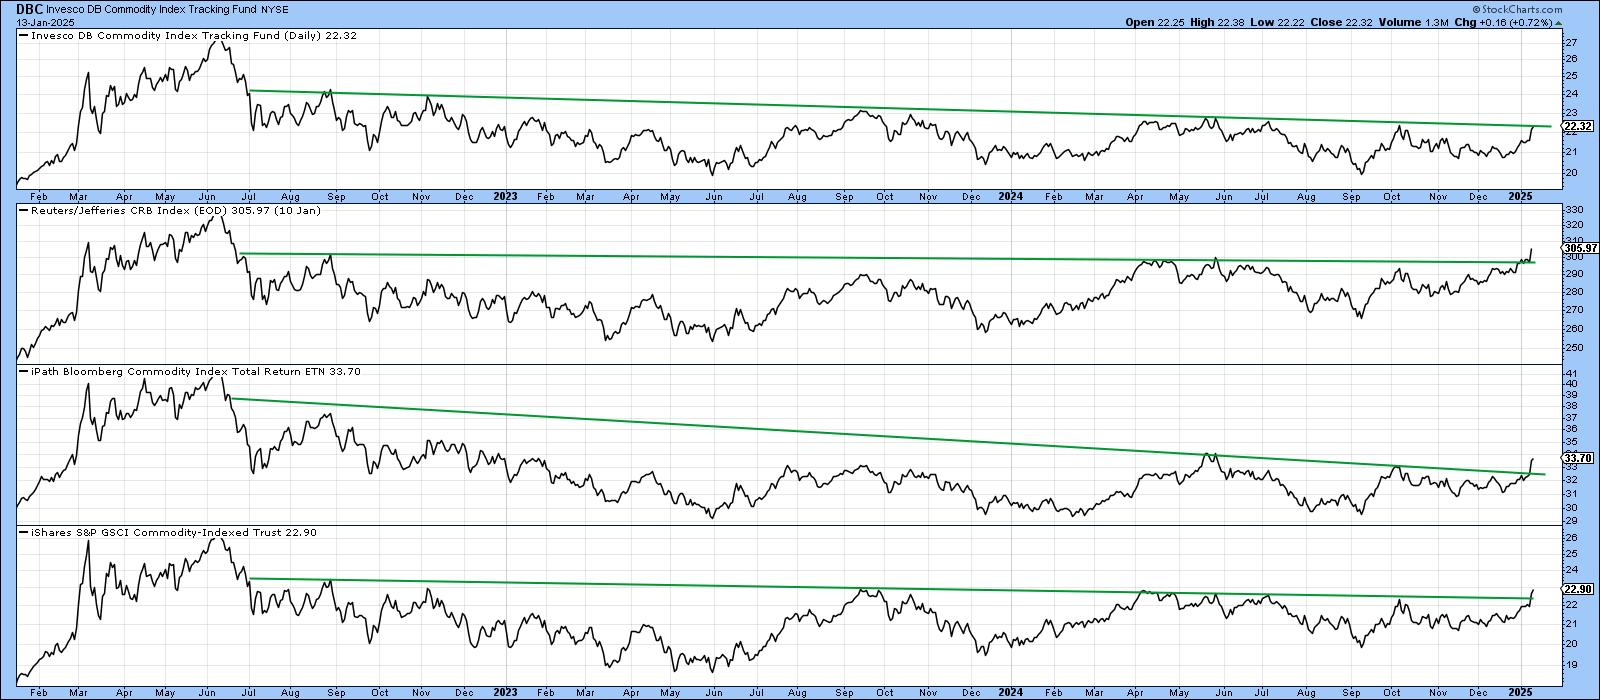
Chart 2 features the iPath Bloomberg Commodity Index (DJP) together with its Special K (SPK) indicator. Because the SPK is constructed by combining short-, intermediate-, and long-term momentum into one series, it has a strong tendency to peak and trough with the primary trend turning points of the price series it is monitoring. Since they are impossible to pinpoint in real time, violations of the signal line and long-term (6-month plus) trendlines are used to confirm these turning points as soon as possible after the fact. An example of a sell signal occurred in mid-2022, when the SPK simultaneously violated an up trendline and the signal line. This action was also confirmed by the price penetrating its own trendline as well as its 200-day MA.
Fast forward to the present and we see the price breaking to the upside, with the SPK literally right at its signal line and resistance trendline. If January's breakout is valid, then the SPK will certainly go bullish, thereby setting up a classic primary trend buy signal.

Some more upside is also required to turn Chart 3 into a bullish mode. In this instance, the CRB Commodity Index is right at the neckline of a potential continuation reverse head-and-shoulders pattern. I say "continuation" because it is important to remember that the last 20 years or so have represented a pause in an ongoing uptrend dating from the early 1930s. Note also that the long-term KST has just gone bullish. Typically, such signals have been followed by a nice advance.

Two reasons for suspecting a confirmed breakout will materialize comes from the action of bond traders. First, the Fed has lowered money market yields, but market forces have raised longer-dated maturities. That's because bond investors are confident of an economic recovery and that the Fed has erred too much on the side of easing. Market forces were correct in pushing down bond yields in 2019 ahead of the Fed. These same forces are offering similar guidance today, but in the opposite direction.

Chart 5 compares the DJP to the ratio between the iBoxx High Yield ETF and the iShares 20-year plus Treasury Bond ETF (HYG/TLT). The chart clearly shows that, for that the vast majority of the time, the two series move in a similar direction. When it is rising, the ratio reflects growing confidence, as bond traders have a preference for the high yield being offered by the HYG over the far safer but lower-yielding treasuries. In other words, a rising relationship tells us bond traders are unconcerned about defaults in view of their confidence concerning the economic outlook.
Most impressive is the fact that the ratio has decisively broken out to new high ground ahead of the DJP. This is a definite vote for an improving economy and, given its close correlation with the DJP, for commodities as well.

Commodities vs. Stocks
Our final chart features the ratio between stocks and commodities ($SPX/DJP). It is offering a mixed picture, but showing signs of vulnerability, as it has experienced a decisive penetration of its bull market trendline. Some could justifiably argue with me on my choice to ignore the October 2024 false break. My view on trendlines is that they should best reflect the underlying trend. In this case, the green arrows indicate this line has turned back numerous declines and, therefore, represents a credible and significant dynamic level of support.
On the plus side, the ratio has yet to decisively violate its 200-day MA and the dashed support trendline. If that line is immediately ruptured, it would result in the completion of a broadening formation with a flat bottom. On the other hand, if a small rally develops prior to its penetration, recent price action would qualify as a head-and-shoulders top. Either way, it would signal a major trend favoring commodities over stocks. That would not necessarily be negative for stocks in their own right, but would indicate a change in sector performance favoring resource areas.

Good luck and good charting,
Martin J. Pring
The views expressed in this article are those of the author and do not necessarily reflect the position or opinion of Pring Turner Capital Groupof Walnut Creek or its affiliates.


