Some Silver Linings Following a Day of AI Panic
I woke up this morning noting that NASDAQ futures had been down nearly 1,000 points at their overnight intraday low. Later, I tuned into a couple of general purpose, as opposed to financial, cable news channels. They, too, were talking about the sell-off and its rationale. I began to think that the story was getting widely enough known and had generated sufficient noise that we would see a great buying opportunity for AI stocks at the opening. That did not happen, of course, but, by the end of the session, several market averages and sectors had traced out some bullish one-day patterns, suggesting the storm is probably over and that it is now time to look up rather than down.
Chart 1, for instance, shows the S&P experienced an exhaustion bar. These patterns usually develop as a climax to a sharp decline; they open with a large gap to the left and close the session with part of it remaining intact. However, the key that makes it a relevant pattern is for the close to develop at a higher level than the opening, thereby indicating that buyers have a slight edge over sellers at the end of the session.
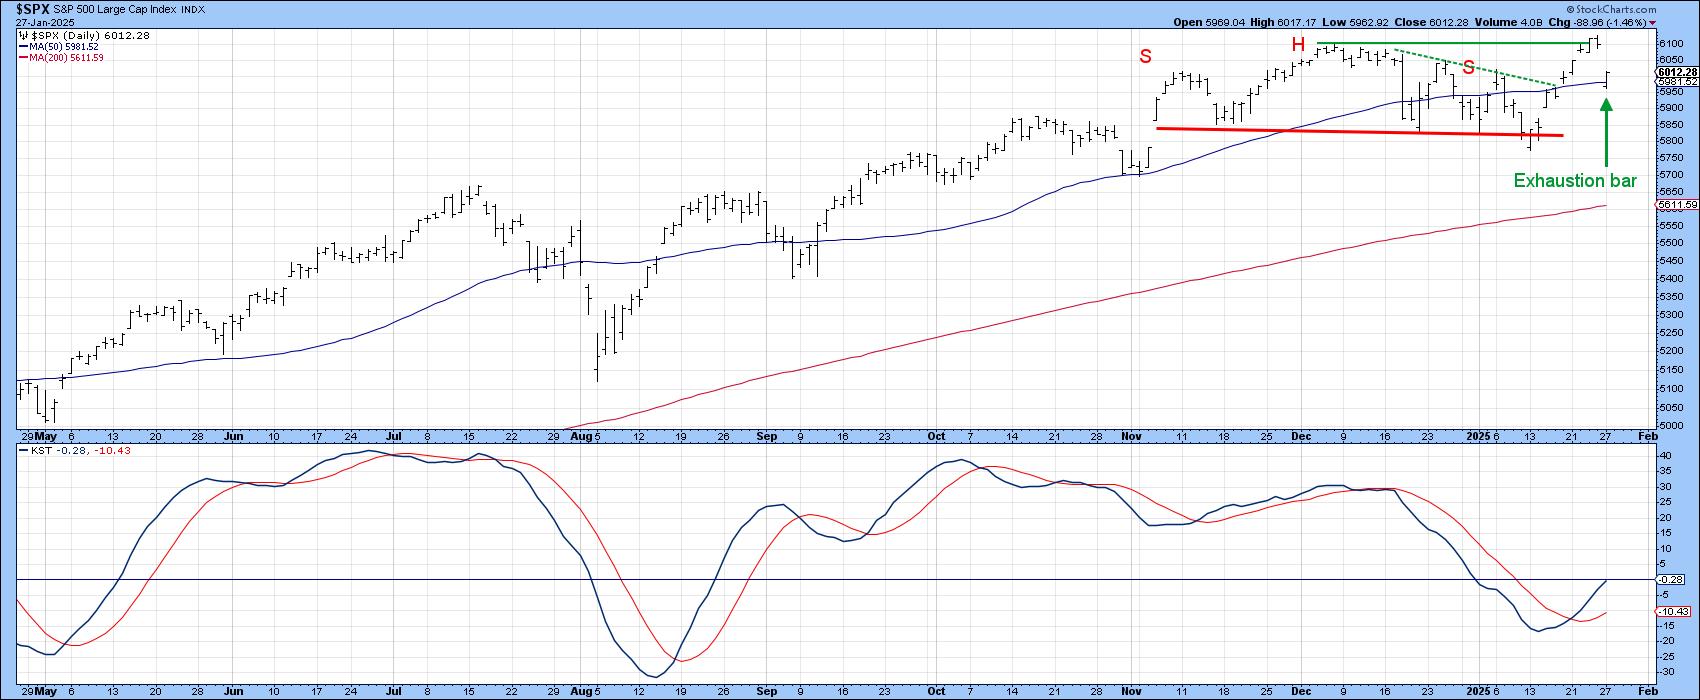
Monday's exhaustion bar does not follow such a pervasive short-term decline, which makes it a bit less than an ideal candidate. However, the fact that the close was also effectively the high for the day is very impressive. I also like the fact that the daily KST has just triggered a buy signal. The chart also features a false break below the neckline of what looks to be a head-and-shoulders. Since failed patterns are typically followed by sharp moves in the opposite direction to the breakout, it will be important to see whether this false break is confirmed.
It's worth noting that technically, that's already happened, with a break above the line joining the head with the two right shoulders. However, a beyond-reasonable-doubt confirmation would occur with the attainment of a new all-time high. If that proves to be the case, a strong rally would likely follow, not only because of the failed pattern, but also because it would have been preceded by Monday's shakeout move.
Over at the SPDR Dow Jones Industrial Average ETF (DIA), we see a different formation. This one happens to be a consolidation outside bar, which completely fills the gap that opened up at the start of Monday's trading. Once again, we see a positive daily KST.

Finally, Chart 3 shows that the NASDAQ also experienced an exhaustion bar. However, it was not as impressive as that for the S&P. That's because the close, whilst above the opening, was not separated by as much action. Also, it failed to close above its 50-day MA, unlike the $SPX. That said, if this exhaustion bar "works", and the green resistance line is surpassed, the Index will have completed a reverse head-and-shoulders pattern. Once again, the daily KST is in a position to help.

Sectors With Outside Days
Finally, Chart 4 presents several sectors and industry groups that experienced consolidation outside days on Monday.

Conclusion
None of these bullish signs guarantee the market will move higher. However, with so many positive one-day formations developing in the face of widespread panic, the US equity market has already successfully survived an important test. On the other hand, if these patterns do not "work" this would represent one piece of evidence of a potential bear market. Since all the major averages are currently trading north of their 200-day moving averages, this seems unlikely.
Good luck and good charting,
Martin J. Pring
The views expressed in this article are those of the author and do not necessarily reflect the position or opinion of Pring Turner Capital Group of Walnut Creek or its affiliates.


