Dr Copper Could Be Close to a Major Breakout. What That Could Mean for the CPI
The nickname "Dr. Copper" comes from its reputation as a reliable economic indicator. That's because it is used worldwide in a wide range of industries, including construction, electronics, and manufacturing. When demand for the red metal is high, it often signals that these industries are booming, reflecting a healthy, growing economy. Conversely, a shortfall in demand can indicate an economic slowdown or recession. Just like a doctor can diagnose a patient's health, "Dr. Copper", through its price swings, is said to reflect the pulse of the global economy. I bring this up because it looks to me as if the price could be on the verge of a multi-year breakout, which will not only mean higher copper prices but a new up wave in the annualized CPI.
The Short-Term Picture
Chart 1 shows that the price of the Copper Fund (CPER) has just broken out from an eight-month base. It's true that the 9-day RSI is overbought, but if this is a bull market, as I suspect, that will not matter. Young bull markets tend to shrug off overbought conditions, as they shake out the unwary during the course of a robust rally.
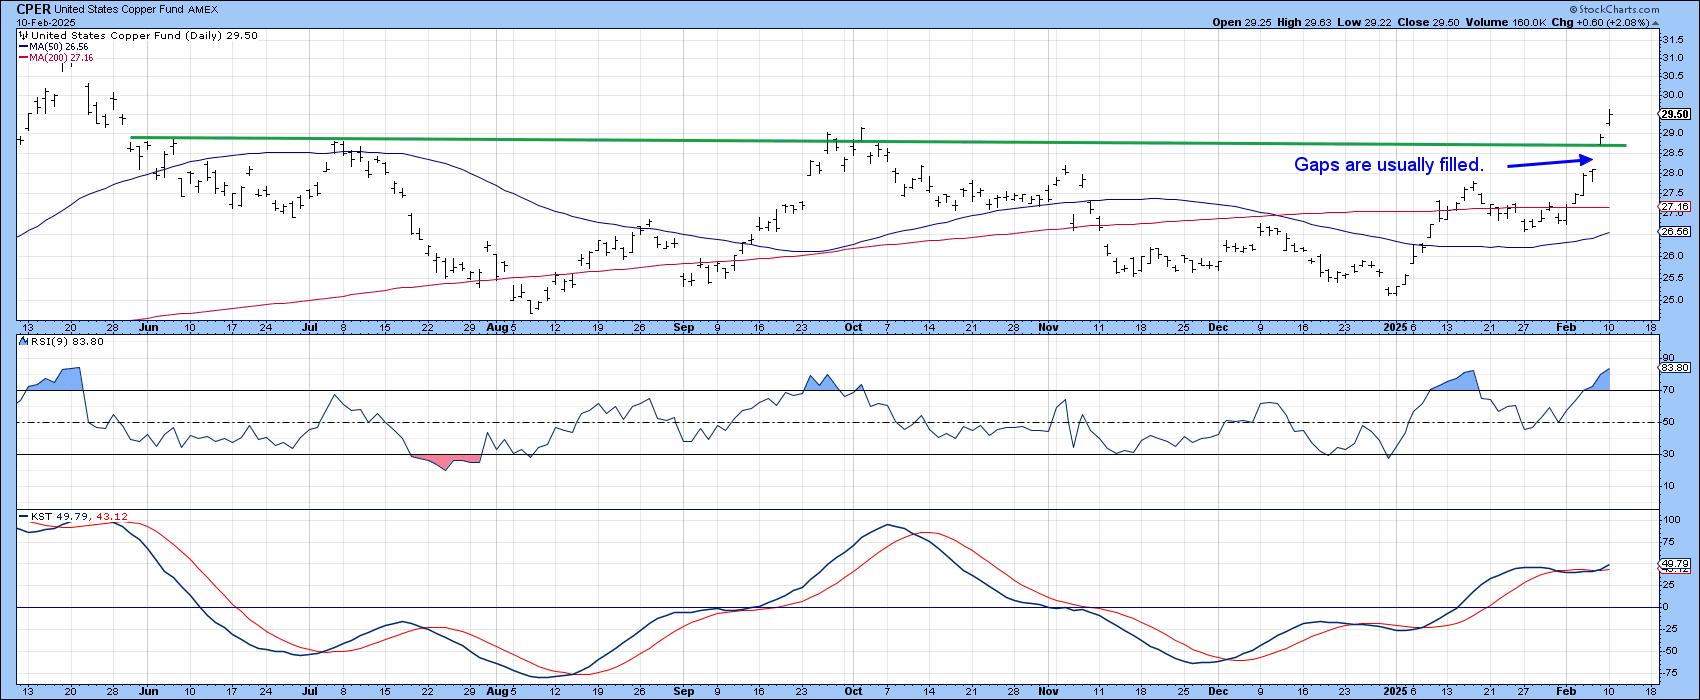
One troubling fact is the large gap that formed late last week, just prior to the breakout. It is a fact that the vast majority of gaps are closed or at least an attempt is made to close them. The problem is that we never know ahead of time when it will take place. It could be days or even years.
The Primary Trend
Chart 2 shows that the copper price itself is bumping up against resistance in the form of a 4-year potential consolidation formation. Note all three KSTs are in some form or another in a bullish mode, suggesting that an upside breakout will materialize soon. One thing to bear in mind is that this is a weekly chart and only Friday closes count. This chart only takes us up to Monday.

Chart 3 takes the price history back to the turn of the century. The green shading tells us when the PPO, using the 6 and 15 parameters, is trading above zero. This technique captures the majority of bull market activity. Its drawback is that it is occasionally late at triggering sell signals, such as 2008, 2011, and 2022. All these cases were preceded by an unusually robust rally but could have used a negative 24-month MA crossover as an early escape hatch. The current bullish situation has not been preceded by a sharp rally. Again, this chart is based on monthly closes, so any mid-month, whilst looking positive would not count until the close on February 28.

Copper and the Economy
Swings in the copper price often reflect stronger or weaker business activity. However, there are economic indicators that move ahead of copper in the economic cycle and can therefore warn us whether the prevailing trend of its price is healthy or without a solid foundation.
An example is presented by ISM Manufacturing New Orders. I use this data in KST momentum format to smooth it and bring out its underlying cyclicality. The KST is featured in Chart 4.

The vertical lines tell us when this momentum series is crossing above its equilibrium point. The solid ones are followed by a rally, the two dashed ones by false positives. January's data pushed the indicator decisively above that equilibrium point, suggesting that this leading indicator the copper price will once again lead it higher.
Copper's Inflationary Implications
Our final chart compares the long-term KST for copper to the annualized CPI. The relationship is far from perfect, but generally speaking, KST buy signals, as represented by the vertical lines, are typically followed by some kind of an up wave in the CPI. Unfortunately, there is no way to forecast the length or intensity of a forthcoming wave. The key point to bear in mind is that if the price breaks out from its multi-year trading range, expect to see another up wave in the CPI, which will likely get the attention of the Fed. For more information on the chronological sequence leading to a higher CPI, please read this.

Good luck and good charting,
Martin J. Pring
The views expressed in this article are those of the author and do not necessarily reflect the position or opinion of Pring Turner Capital Groupof Walnut Creek or its affiliates.


