Forget Technology and Take a Look at This Sector
Technology stocks, in the form of the SPDR Technology ETF (XLK), have been on a tear since their secular low in 2009. That strength has not only resulted in higher absolute prices, but also striking relative action.
Chart 1 compares the XLK to its long-term KST. Reversals in this indicator trigger helpful momentum buy and sell signals -- most of the time. However, when it comes to linear uptrends, such as that for the XLK since 2009, it is subject to false negatives and is not as reliable as we would like. The latest plot shows that the KST has started to roll over. If the linear uptrend is still intact, this signal will probably be followed by a trading range outcome.
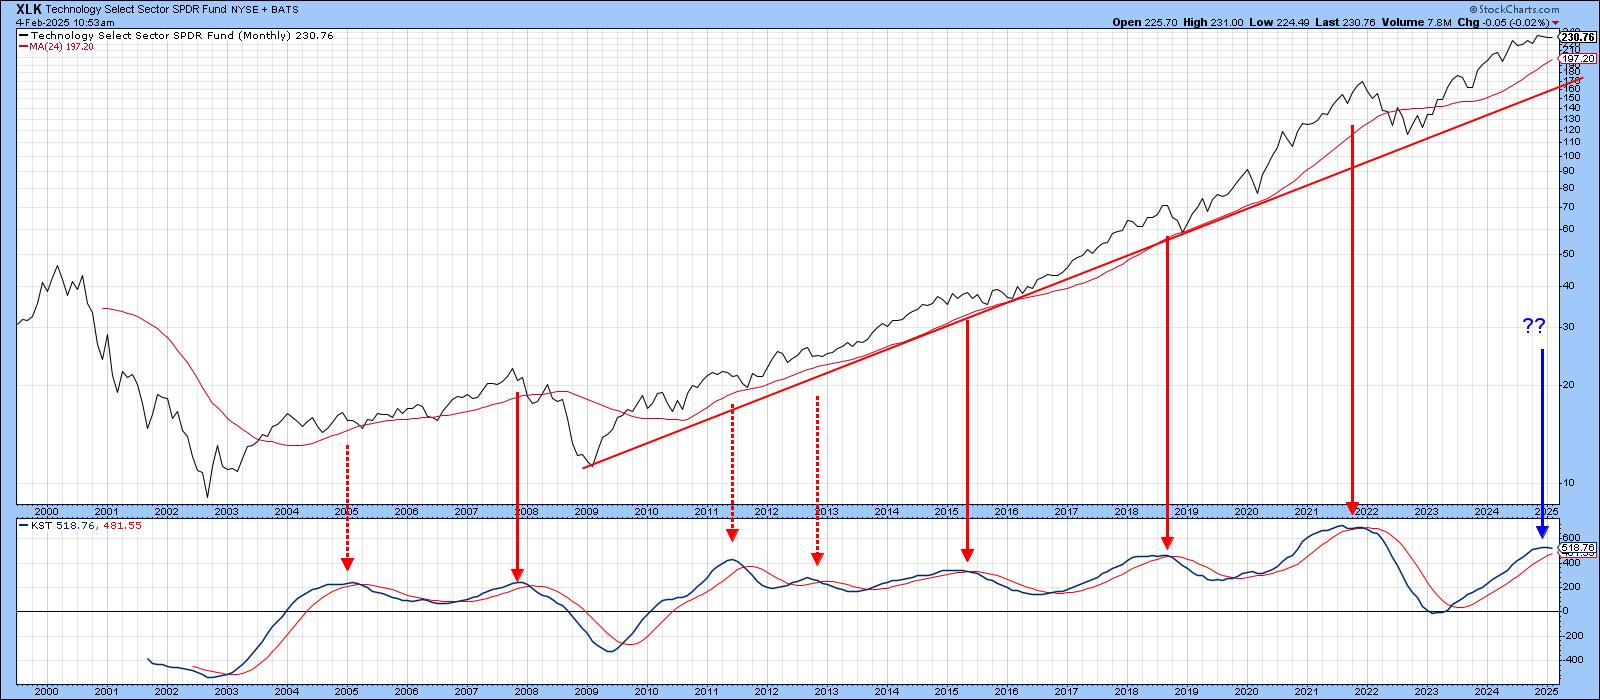
There is no question the price has come a long way in the last decade and a half. However, high prices do not mean the end of a trend. For this we need evidence, and, in this case, the price is comfortably above its 24-month MA and secular up trendline.
Relative action, on the other hand, is a different matter. For example, Chart 2 shows the XLK has been in a secular bull market for relative action since the financial crisis. However, relative performance has been substantially less robust than that for the absolute price. One way to appreciate this is to note the stronger negative response to RS KST sell signals. The latest, for example, has resulted in what could turn out to be a top for relative action. During the secular uptrend, the 24-month MA was penetrated on three occasions. These events have been flagged by the blue arrows. A fourth violation took place late last year. Now, the RS line is holding at its 2015-2025 up trendline. Should the line give way, it would not only be negative in its own right, but would also result in a more decisive negative MA crossover, thereby strongly suggesting the RS line had peaked in a major way.

Chart 3 features the XLK using weekly data. The price itself remains in an uptrend, which looks good on the surface. However, the RS line failed to confirm it by a wide margin and could be on the verge of breaking down. Note this action is totally different from that which took place in early 2023. At that time, the RS line was leading the price higher. Now, the opposite may be true, as the RS line looks as if it is about to break down.

Financials to the Rescue
In the relative strength world, if some sectors are losing others, by definition, should be picking up the slack, because the whole thing is a net zero game. Chart 4 offers a potential winner should the XLK relative action weaken more. We have already established that its RS line looks potentially toppy. On the other hand, the RS line for the SPDR Financial ETF (XLF) looks as if it is about to break out from a potential base. Momentum agrees, because the RS KST for the XLK is declining and that for the XLF rising.

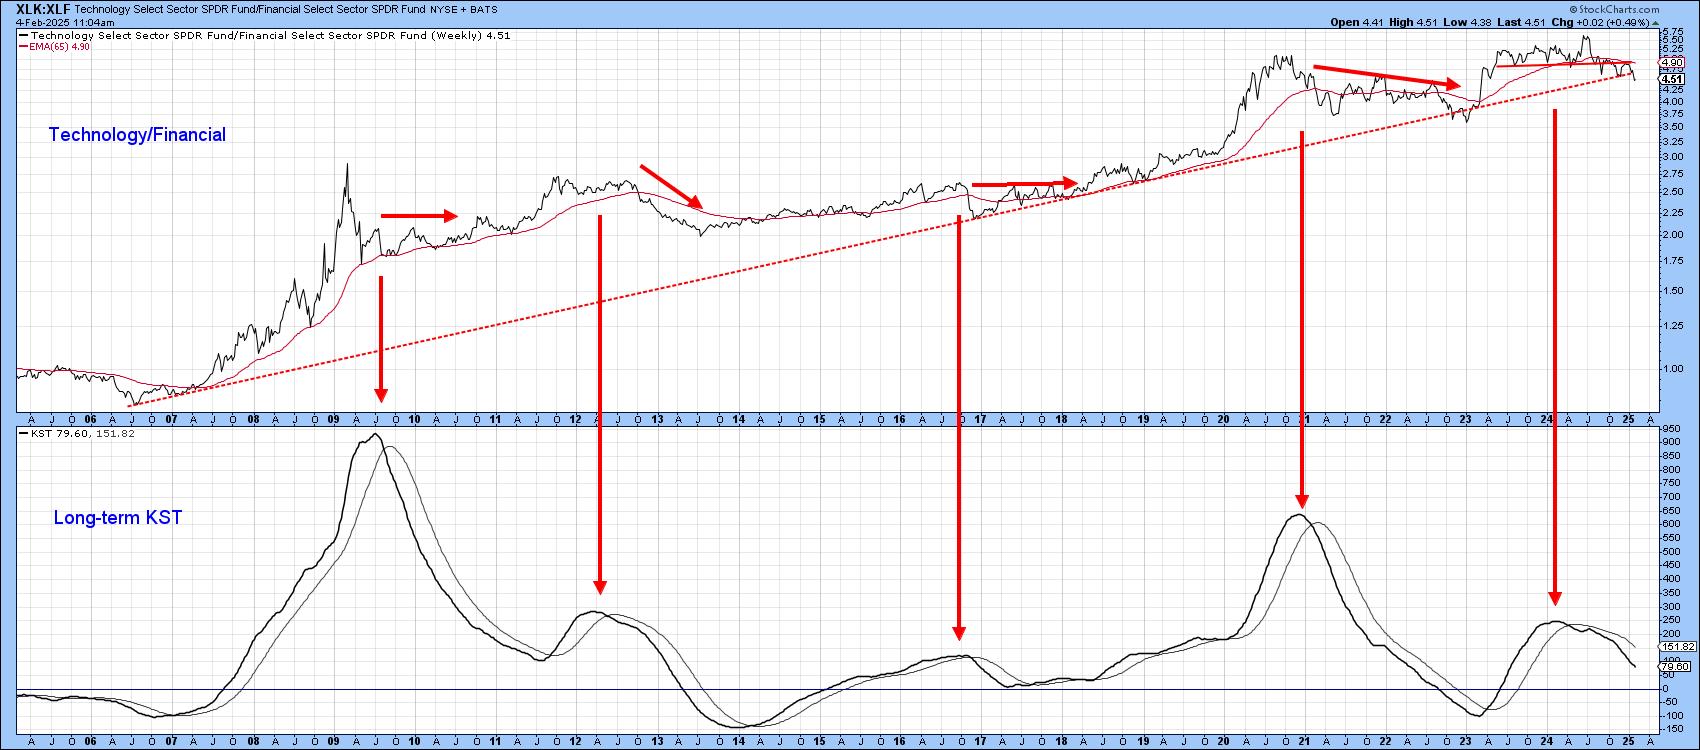
Finally, Chart 5 features the ratio between Technology and Financials (XLK/XLF), together with its long-term KST. The ratio has clearly completed a 2-year top and decisively violated its secular up trendline. I regard that line to be of great significance not only because of its nearly 20-year length, but because it has turned back numerous declines including the late 2022 whipsaw. It therefore represents an important level of dynamic support, whose violation favors financials over technology going forwards. That does not mean that financials will rally and technology sell-off, merely that financials have most likely begun a period of superior performance. After all, the absolute prices for both the XLK and XLF are still in confirmed uptrends.
Good luck and good charting,
Martin J. Pring
The views expressed in this article are those of the author and do not necessarily reflect the position or opinion of Pring Turner Capital Groupof Walnut Creek or its affiliates.


