If a Rising Tide Lifts All Boats, What Does It Mean for the Dollar?
KEY TAKEAWAYS
- The US dollar is still in a bullish trend.
- An analysis of a secular trend, primary trend, and short-term trend support the dollar's bullish case.
- The Pring Dollar Diffusion indicator tends to lead the action of the US dollar and is indicating a bullish move ahead.
This year has not been kind to the US dollar as it has lost some ground recently. That, however, may be about to change. They say a rising tide lifts all boats. In market parlance, it means short-term corrections that develop under the context of a primary bull market are typically subdued in duration and magnitude and record progressively higher lows. Shallow corrections don't happen in every instance, but most counter-cyclical price moves certainly do. So, what is the evidence the dollar is in a bull market?
The Secular Trend
Several charts help to make our case. The first goes back to basics and points out that the US Dollar Index ($USD) has experienced a series of rising peaks and troughs since the financial crisis. Of course, the latest rally can always fail to surpass its 2022 top. However, the recently generated long-term KST buy signal makes such a scenario unlikely. There is an old technical adage that says a trend is a trend, which means we should assume the prevailing trend is in operation until proven otherwise. At this point, we don't have proof that the secular trend that began in 2008 is over. Incidentally, the rising tide scenario operates with the secular trend as well. In that respect, note the weak counter-secular moves identified by the declining red arrows.
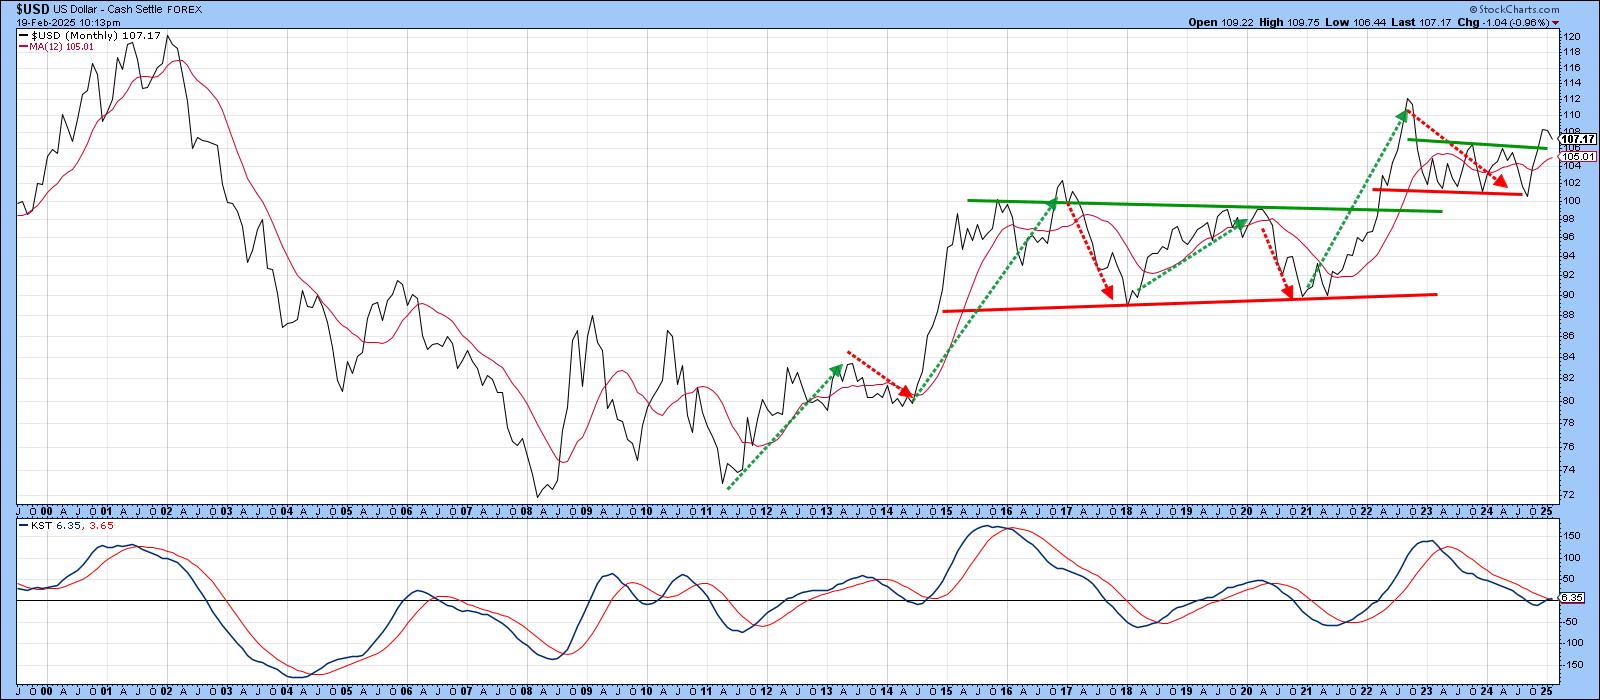
Chart 2 plots the US Dollar Index on a quarterly basis. The green shading approximates periods when the Coppock Curve is above its 16-quarter (4-year) simple moving average (SMA). The small red and green arrows show that this average has turned back numerous rallies and reactions, which means penetrations are a big deal when they happen. At the moment the Coppock Curve is positive and the Index is above its SMA and red secular up trendline. Consequently, there is not much dispute concerning its direction.

The Primary Trend
We have already seen that the long-term KST, which monitors the primary trend, is bullish. Chart 3, though, considers the situation from a different aspect, substituting the Percentage Price Oscillator (PPO) and using the 6- and 15-month parameters. It's not a perfect indicator, as you can see from the 2024 whipsaw. Right now though, it is bullish and the Index is above its 12-month MA.

Chart 4 compares the Index to its Special K (SPK). It generates primary trend buy and sell signals with trendline and signal line crossovers, hopefully with confirmation from the price series it is monitoring with a trendline violation or SMA crossover of its own. The large arrows identify previous signal line crossovers, the most recent of which took place at the turn of the year. This was followed by a breakout from the 2023-25 trading range and subsequent pull-back.

The Short-Term Picture
Chart 5 focuses on more recent price action, where we can see major support lying at the intersection between the 65-week EMA and the extended breakout trendline. The short-term KST is not yet oversold, but if this is a bull market it doesn't necessarily have to reach such a condition. Just look at its action during the green shading when the long-term KST was positive, I am certainly not saying that we will see a repeat of that explosive rally, but it does point up the fallacy of trying to time short-term counter-cyclical price moves.

The final chart features a cumulation of my Dollar Diffusion Indicator. It has a tendency to lead the Index itself, as you can see from the red and green dashed arrows. The indicator broke out from a narrow trading range in late 2014 and was followed by a nice rally. Recent action has seen a similar breakout and now it is at a post-2023 high. Can the Index be far behind?

Good luck and good charting,
Martin J. Pring
The views expressed in this article are those of the author and do not necessarily reflect the position or opinion of Pring Turner Capital Groupof Walnut Creek or its affiliates.


