Confidence Ratios are in an Uptrend, But Looking Vulnerable
At this week's news conference, Jerome Powell mentioned that the Fed is cautious about making significant changes to interest rates due to unclear economic conditions, citing factors like trade policies and inflation, which have contributed to this uncertainty. If the "experts" don't know, it's a good idea to see if the markets can give us better clarity.
In that respect, Chart 1 compares the S&P Composite to a credit spread, calculated by dividing the iBoxx High Yield Bond Fund by the iShares 7-10-year Treasury Fund (_HYG/_IEF). When the ratio is rising, it means that investors are confident because they are willing to bid up the high-yielding junk bonds relative to the less risky treasuries. Alternatively, a persistently declining relationship implies investors are concerned about a weakening economy and, therefore, growing defaults. In many cases, the ratio works its way lower ahead of the stock market as these savvy bond investors smell economic weakness before their equity counterparts. We can see that from Chart 1 in the 2014-2015 and 2019-2020 periods. In 2022, the tables were turned as a strong confidence ratio turned well ahead of a declining stock market.
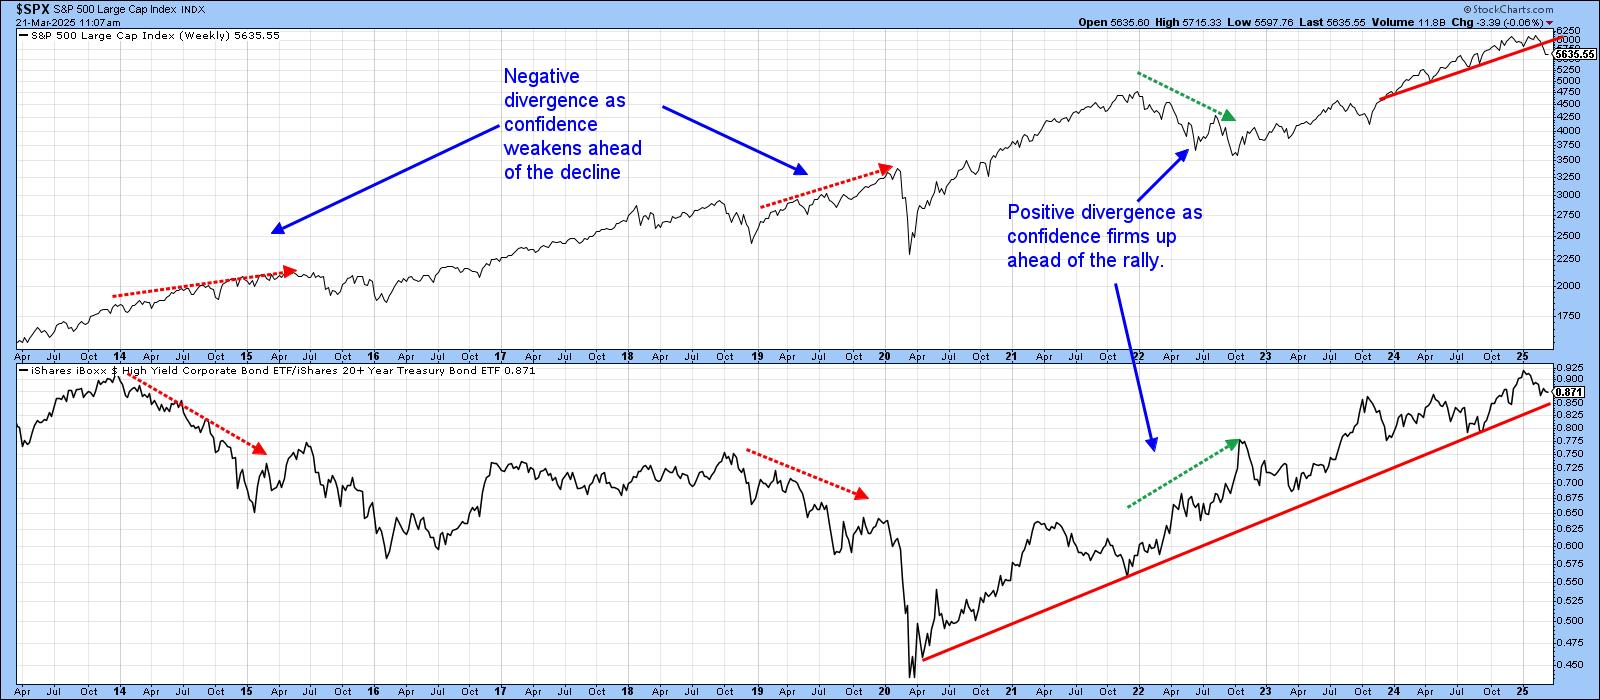
The ratio has fallen slightly in recent weeks, but has not offered the kind of negative warning seen prior to other periods of economic weakness. This small drop pales in response to the widespread negativity concerning the economy. I will begin to worry though, if the post-2020 uptrend line is violated, as that could be the prelude to an important setback for the ratio. In the meantime, the S&P has violated its post-2023 up trendline and therefore looking a bit shaky.
Another key relationship worth monitoring is the S&P Composite relative to the SPDR Consumer Staples ETF ($SPX/XLP). Staples are regarded as a defensive sector, so, when they are outperforming the S&P, the implication is that investors have moved to a defensive posture, which tends to be bearish for the overall market. The pink-shaded areas in Chart 2 tell us when the long-term KST of the ratio is below its EMA. This is not always bearish, but we can say the market is more vulnerable under such circumstances, and, if a decline is going to take place, it's more likely to happen when the KST is in a negative mode. At present, this momentum indicator is bullish, but has begun to roll over.

Nevertheless, it's important to note that the ratio itself recently experienced what appears to be a false break above what the green resistance trendline. Whipsaws require confirmation, so it will be critical for the ratio to hold above the red support trendline and its 65-week EMA. In this instance, the ratio has fallen sharply, so it would not be surprising to see it experience a small rally prior to any breakdown.
Chart 3 portrays a confidence ratio based on international data. The chart features the ratio between the International High-Yield ETF and Barclays International Treasury (_HYXU/_BWX). The principle is the same, in that a declining relationship implies international bond investors are concerned about defaults. The pink-shaded areas once again represent periods when the long-term KST is below its EMA. The ratio itself is finely balanced at the moment, as it is in the middle of a potential head-and-shoulders trading range. For its part, the Dow Jones World Index is straddled on its 2022-2025 bull market trendline.

Conclusion
Negative sentiment is widespread, and many short-term indicators are oversold, so, from a contrary aspect, some form of a relief rally is likely. However, the momentum indicators for these relationships are rolling over in a manner that suggests something more significant on the downside ultimately lies ahead.
Good luck and good charting,
Martin J. Pring
The views expressed in this article are those of the author and do not necessarily reflect the position or opinion of Pring Turner Capital Groupof Walnut Creek or its affiliates.


