Can Gold Defy Gravity and Break to the Upside?
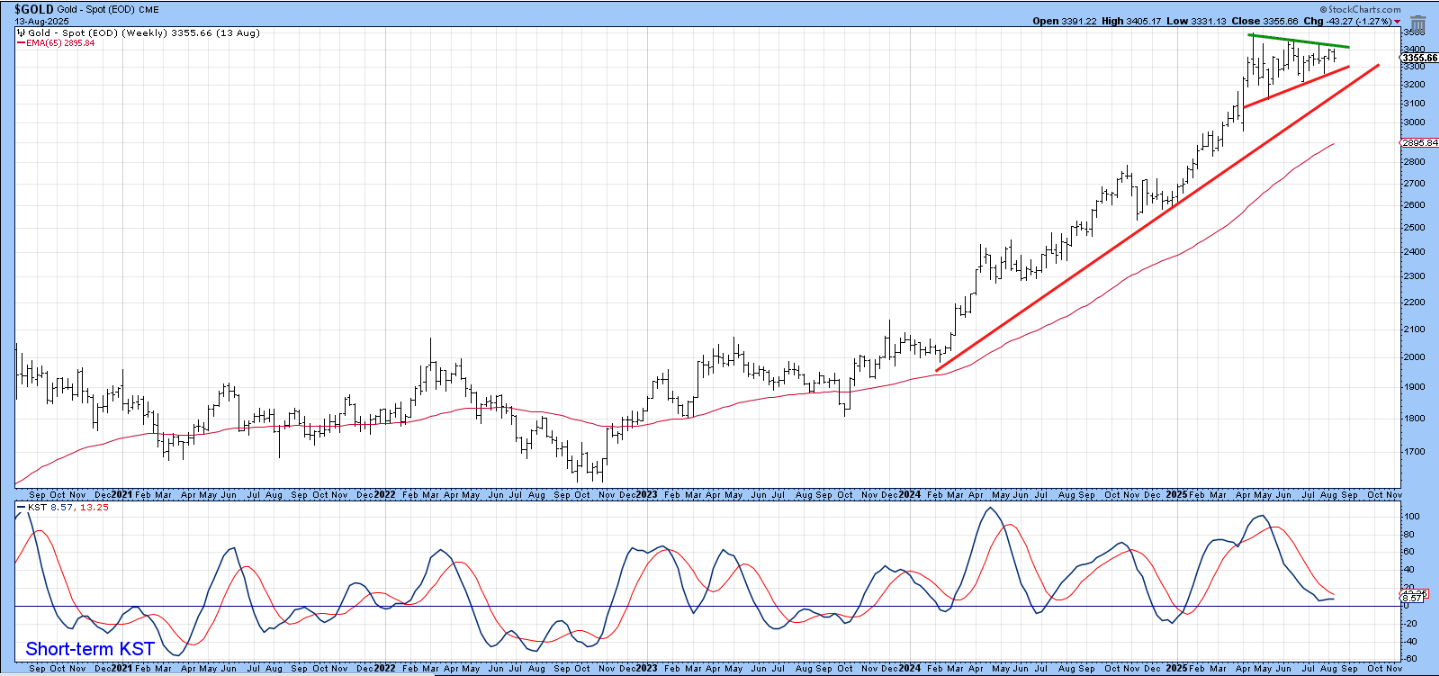
For nearly five months, the gold price has been caught in a narrow trading range, raising the question of whether it will break to the upside or downside.
Usually, it’s wise to assume that the price will resolve such dilemmas in the direction of the prevailing trend, which Chart 1 shows to be a rising one.
We can also see from Chart 2 that the short-term KST looks ready to trigger a buy signal with a positive EMA cross. So why might it be ready to “defy gravity”?
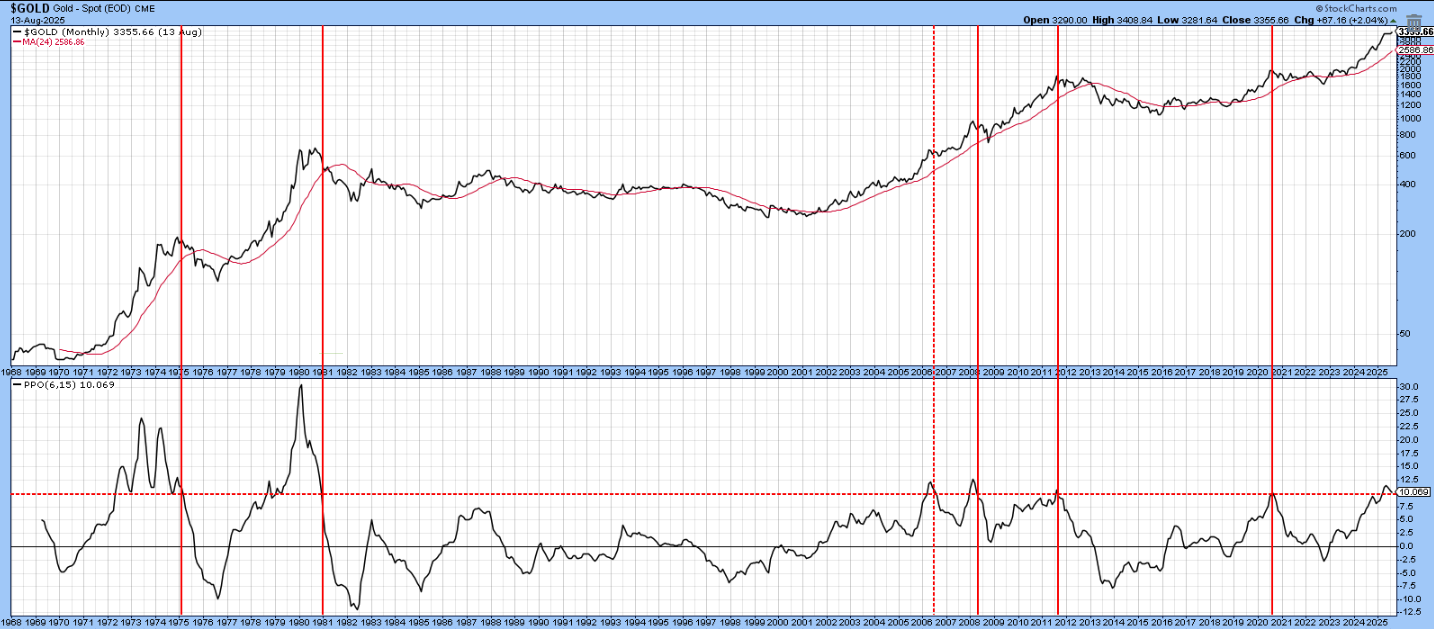
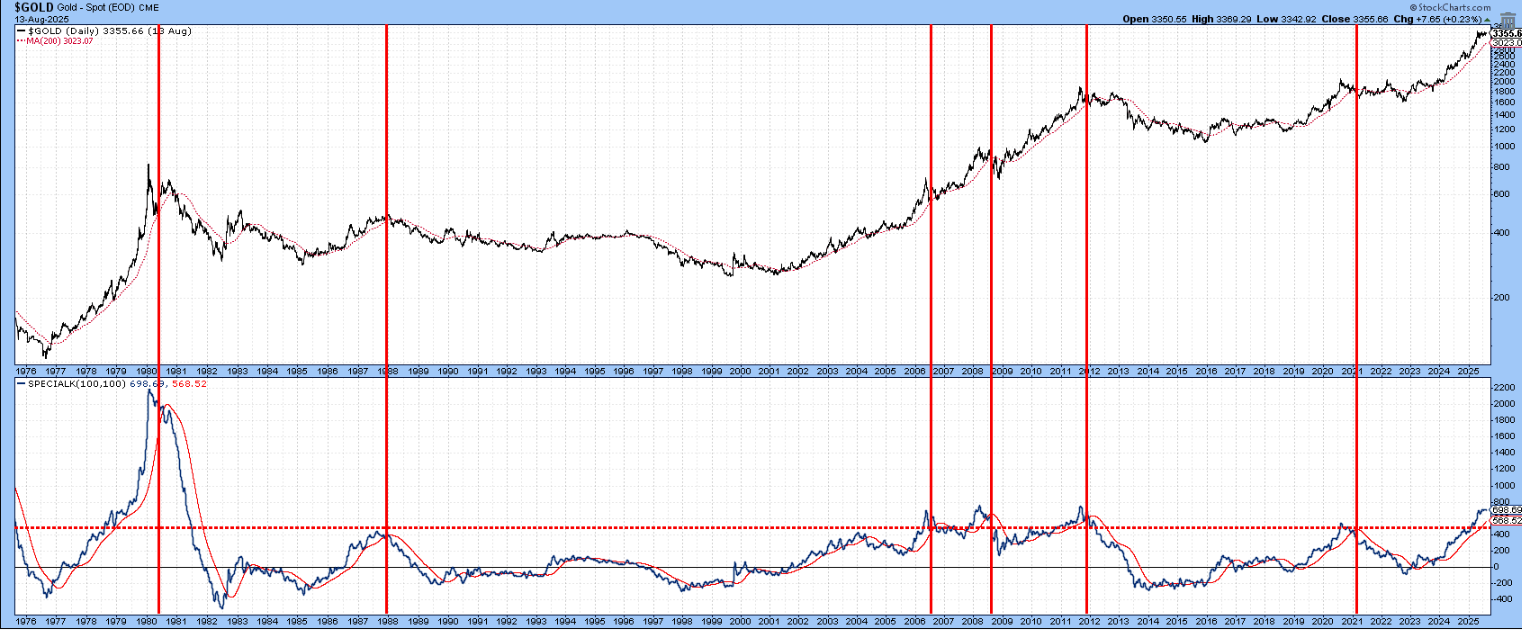
The answer partly lies in Chart 3, which compares price history back to the 1970s to a PPO (Price Percentage Oscillator) using the 6- and 15-month parameters. The six vertical lines tell us when the PPO re-crossed its overbought zone on its way back to zero. All instances, except 2006, were followed by a sharp contra-trend bull market correction or the start of a bear market. Fast-forward to the present and you can see that this oscillator has again reached that overstretched level and begun to tip slightly to the downside. This chart is based on monthly close data, so the latest plot pushing it back to the overbought line is not yet official, especially as we are a couple of weeks shy of the August 31 close. Nonetheless, it does underscore the critical nature of the current technical structure.
Arguably a timelier indication that gold is about to experience a little mean reversion comes from its Special K (SPK), which you can read about here. The vertical lines isolate instances when the SPK reaches or exceeds an extreme reading and signifies a momentum reversal by crossing below its red moving average, known as the “signal line”. The fallout from the 2006 and 2008 signals was limited to a sharp intermediate correction during the 1999- 2011 bull market; however, all the others were followed by bear markets. As it stands now, the trend of the SPK is bullish since it is above its signal line. Nevertheless, both series are trading north of the overbought horizontal dashed red line, which implies that a momentum sell signal of this nature may not be far off.
Gold vs. Commodities
That may appear deflationary, since gold has a strong tendency to lead commodities. However, Chart 5 shows that, once it starts to underperform the CRB Composite, the commodity index has a strong tendency to rally in its own right.
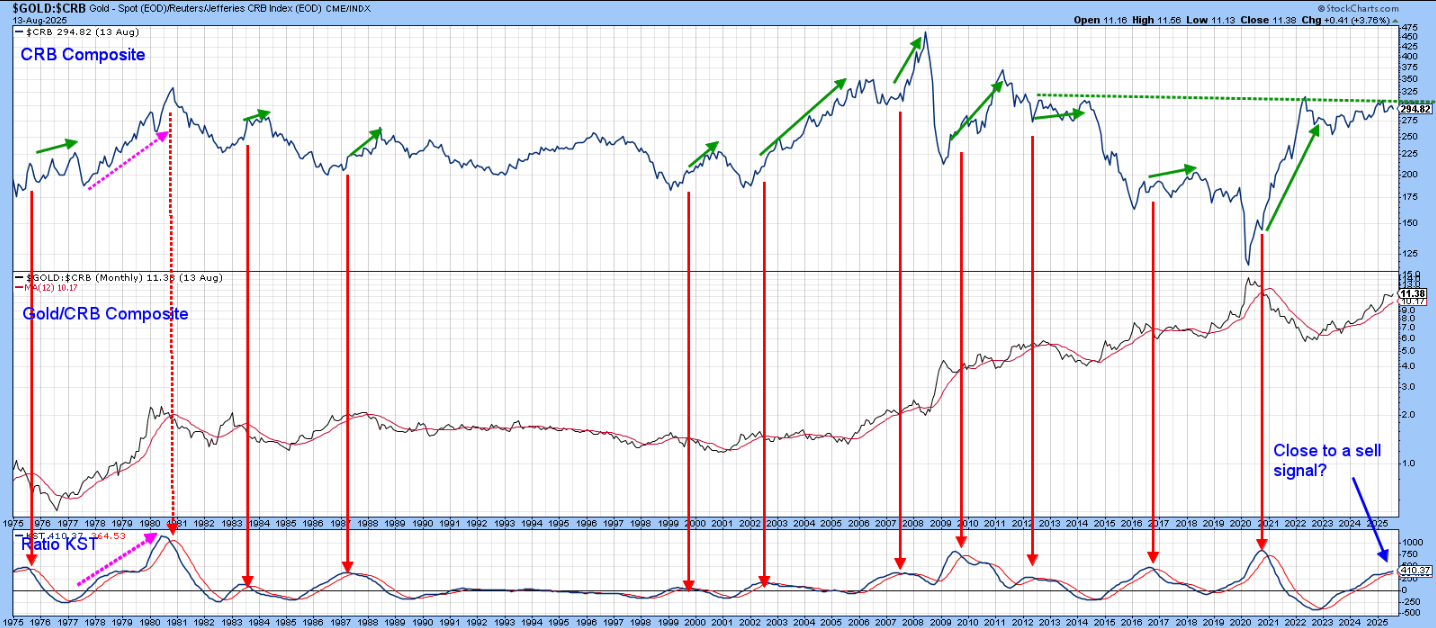
The ratio between gold and the CRB Composite is displayed in the middle window of Chart 5. When it is rising, it means that gold is outperforming the CRB, and vice versa. The long-term KST of this relationship is featured in the bottom panel. The red arrows approximate their peaks, which signifies that momentum for the yellow metal is about to underperform that for commodities. Note that this is almost always followed by an upward-sloping green arrow in the top window, indicating a rising CRB.
The uptrend favoring gold that began in 2022 is still intact, as the ratio itself is above its 12-month MA. However, the distance between the KST and its 9-month MA has been narrowing recently and could easily turn. If the gold price itself is able to experience a positive break out from its recent trading range, that would likely prolong its period of superior performance. On the other hand, a downside resolution would threaten the Gold/CRB uptrend, probably enabling the CRB to successfully violate its green dashed resistance trendline, just slightly above the 300 level.
Gold and the CPI
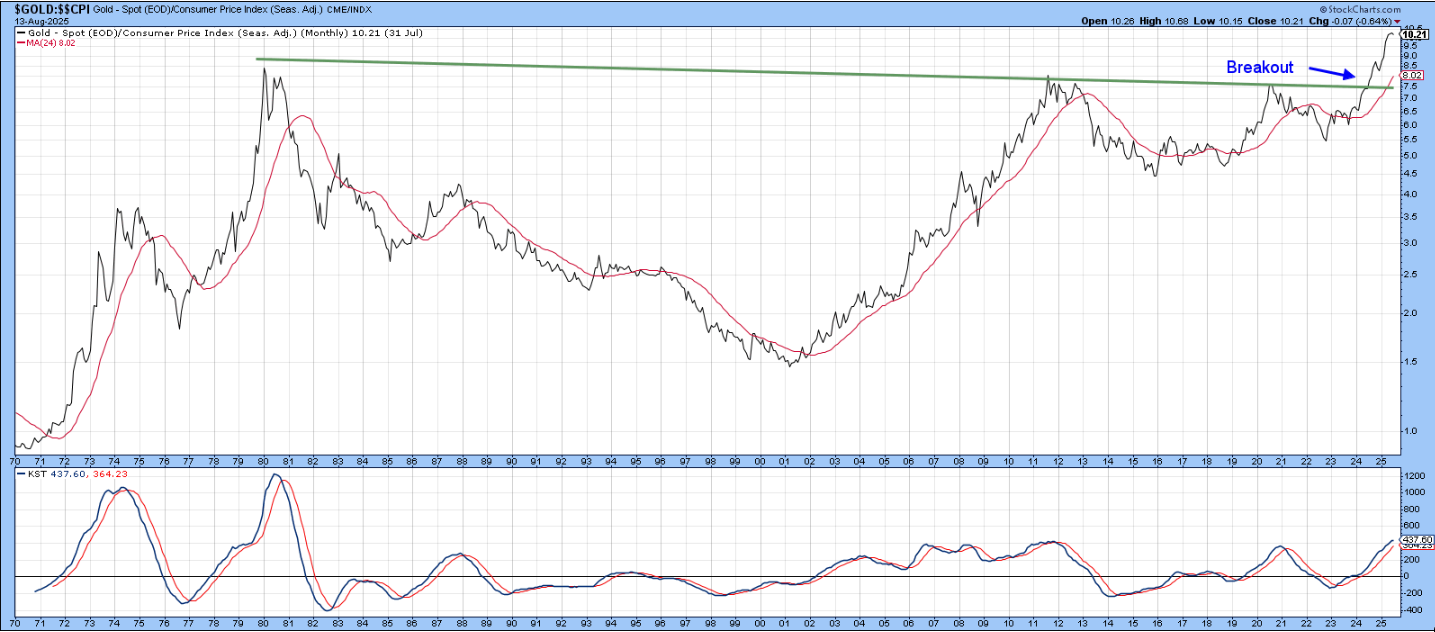
Since gold discounts commodity price inflation, it also has limited predictive powers so far as CPI inflation is concerned. In that respect, the green solid arrows of Chart 6 show that cyclic lows in the gold KST are almost always followed by a rising trend in the 12-month ROC of the CPI. The magnitude, duration, leads, and lags of these trends differ from cycle to cycle.
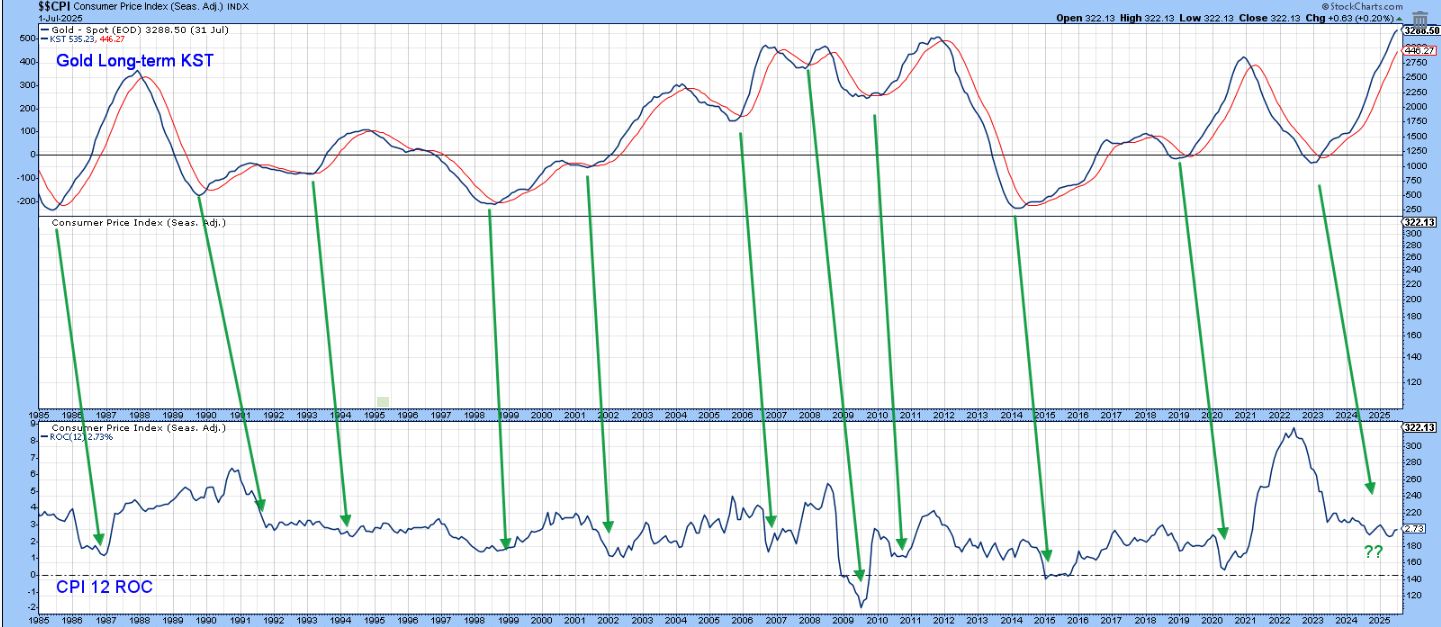
So far, the CPI has not responded to the historic gold rally of the last few years. However, if it breaks out from its recent trading range on the upside, it will represent one more reason to expect a firming in CPI momentum.
Good luck and good charting,
Martin J. Pring
The views expressed in this article are those of the author and do not necessarily reflect the position or opinion of Pring Turner Capital Group of Walnut Creek or its affiliates.


