Last Week’s Market Action Showed Signs of Exhaustion, Especially In This One Key Stock

Key Takeaways
- Recent weekly charts for the S&P 500, Nasdaq Composite, and Microsoft have formed bearish patterns suggesting potential intermediate-term downside.
- A single candlestick or bar pattern is only one piece of evidence. For a valid trend reversal, it is essential to see confirmation via additional indicators.
- MSFT's weekly shooting star and daily exhaustion bar highlight elevated bearish pressure. If confirmed by trendline breaks, these patterns could mark an intermediate top, though not a bear market.
I have a couple of ChartLists that I like to review over the weekend to see if they reveal any weekly one- or two-bar western or candlestick patterns. Most of the time, little turns up, but this weekend, a couple of interesting charts did. None were earth-shattering, but, since a bearish weekly bar usually has an effect for between 5-10 weeks, these charts may have negative consequences over the intermediate term.
Technical analysis deals in probabilities and is therefore concerned with the weight -of-the-evidence approach. In other words, the more pieces of evidence that point in the direction of a trend reversal, the greater the probability it will be valid. The point I am trying to make is that a one- or two-bar or candlestick pattern is just one piece of evidence, so we need to see it confirmed with some other form of trend reversal signal.
Chart 1 features the S&P Composite ($SPX) and shows that last week’s action amounted to a bearish outside week. Outside bars develop after a rally where the final bar totally encompasses its predecessor; ideally, it opens in the upper half of the bar and closes near the low. Such action indicates that there's buyer dominance coming into the bar but, by Friday’s close, it’s the sellers who are in control. The sharper the preceding rally, the greater the bar’s significance, since that implies greater potential for profit-taking. Also, the wider the bar relative to its forerunners, the more intense the battle between supply and demand, and, thus, the more important the victory.
Last week’s bar was preceded by a pretty strong rally. The width comparison was acceptable, but nothing to get excited about. Confirmation requires a break below the extended green breakout trendline and 10-week moving average (MA).
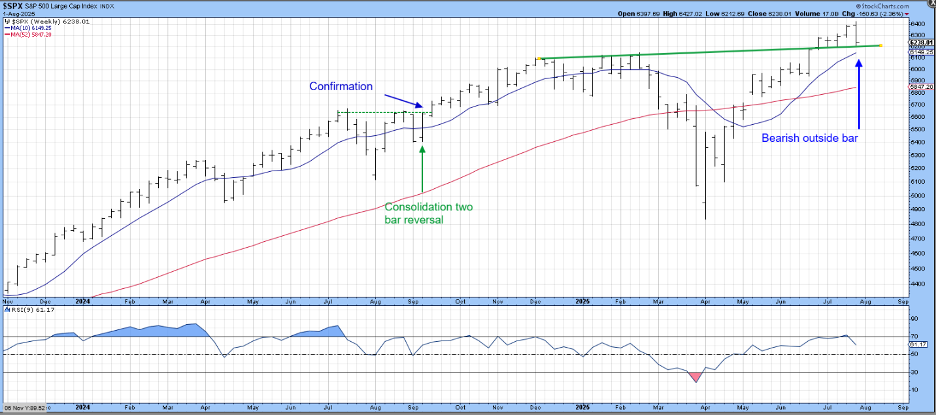
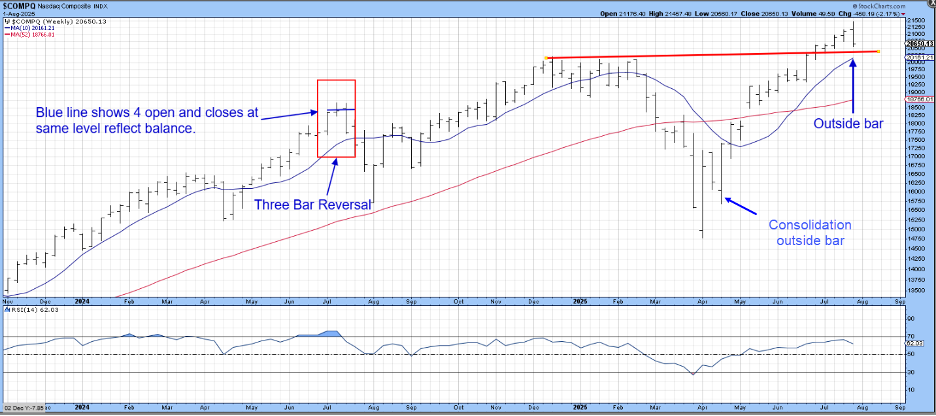
Chart 2 displays the Nasdaq Composite ($COMPQ), which also experienced an outside week. It’s a very similar setup to the S&P, which is not surprising. However, the index touched a new bull market high, but the 14-week Relative Strength Index (RSI) was unable to even reach its overbought zone at 70. As in the case of the S&P, it would require a drop below the 10-week MA and red extended breakout trendline as evidence confirming the outside week.
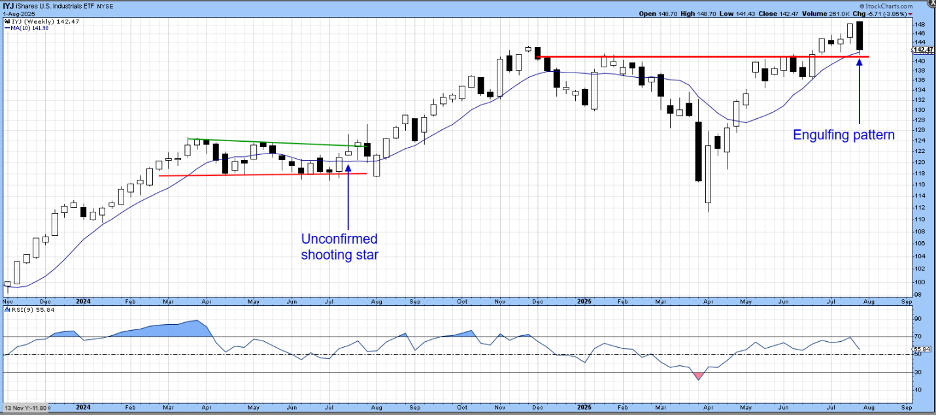
Had the S&P and NASDAQ been plotted as candlesticks, they would also indicate bearish engulfing patterns. So would the iShares US Industrials ETF (IYJ), but the two real bodies are more impressive. In this case, confirmation requires a penetration of the red trendline and 10-week MA.
Microsoft's Bearish Pattern
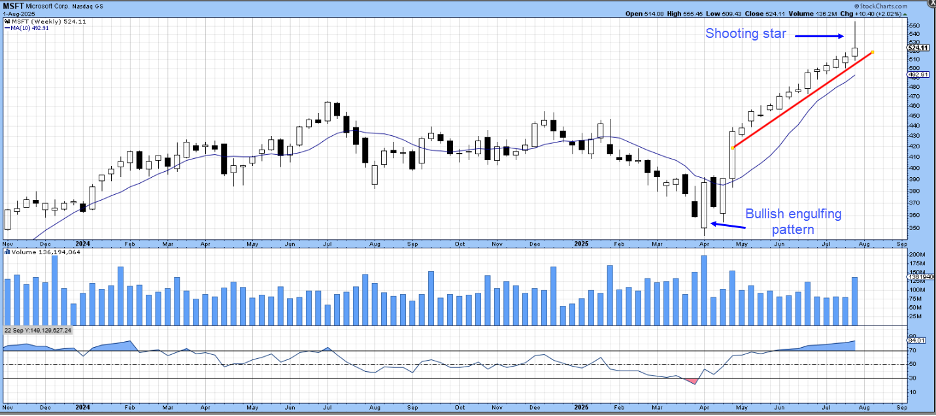
Last week’s price action for Microsoft Corp. (MSFT) took the form of a bearish shooting star. These patterns appear in the charts following a sharp rally. They open near the low and then rally sharply; however, by the close, the rally completely disappears as the price falls back towards its opening level, and therefore the low for the week. As a result, many traders end the session with significant losses.
In Microsoft’s case, confirmation of the shooting star would come with a decisive rupture of the red up trendline.
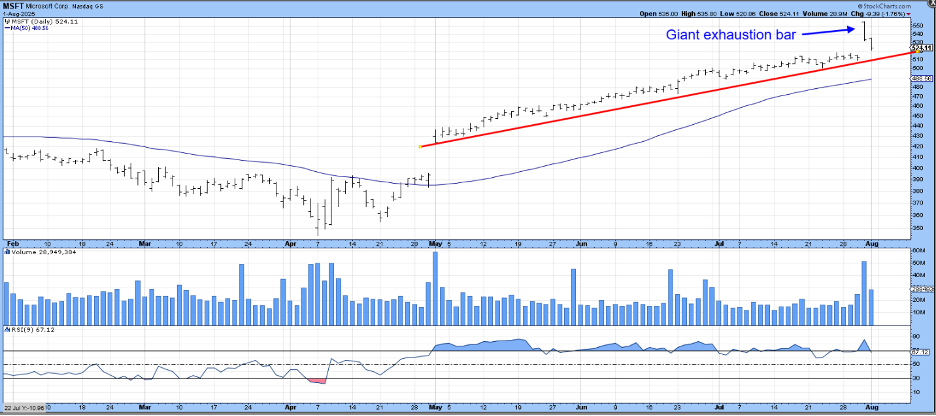
Finally, Chart 5 displays the daily action for MSFT, where we can see that Thursday’s action took the form of a very significant exhaustion bar.
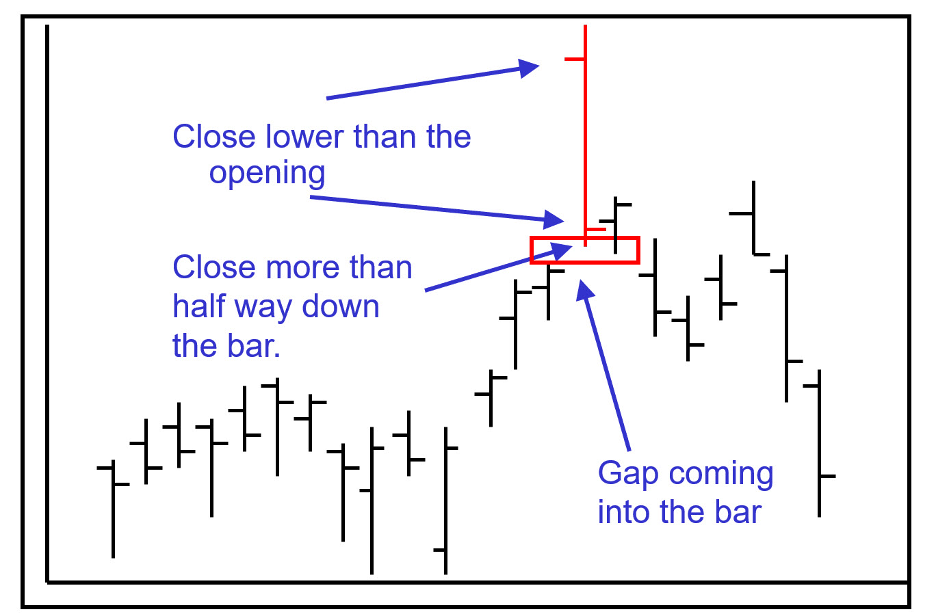
The requirements for an exhaustion bar, as laid out in Figure 1, are:
- It is extremely wide relative to previous bars.
- The opening price gaps higher in the upper half of the bar. In other words, sentiment is at, or very close to, its most extreme at the start of the bar.
- The closing price should be both below the opening and in the bottom half of the bar. This offers a few pointers that sentiment, at least during the bar’s formation, has begun to reverse.
- The bar is completed with a gap to the left still in place.
There is no doubt that Thursday’s exhaustion bar for MSFT is significant, especially as it is very wide and was accompanied by very heavy volume. The shooting star also adds to the bearish case, especially if the two patterns are confirmed with a violation of their respective red up trendlines.
These are important bars individually, but they are not signaling a primary bear market. That requires a reversal in the longer-term indicators. However, if confirmed, they would indicate the possibility of an intermediate peak lasting for several months.
Good luck and good charting,
Martin J. Pring
The views expressed in this article are those of the author and do not necessarily reflect the position or opinion of Pring Turner Capital Group of Walnut Creek or its affiliates.


